

Key Insights
The global market for NTC Inrush Current Limiters is experiencing robust growth, driven by increasing demand across diverse sectors including consumer electronics, automotive, industrial automation, and renewable energy. The rising adoption of power electronics, the need for improved power quality, and stringent safety regulations are key factors propelling market expansion. A compounded annual growth rate (CAGR) of approximately 8% is projected for the forecast period of 2025-2033, indicating a significant market opportunity. Major players like Murata, Amphenol, and TDK Corporation are actively engaged in product innovation and strategic partnerships to enhance their market share. Market segmentation reveals strong growth in automotive applications due to the electrification trend and increasing complexity of electronic systems in vehicles. The industrial automation segment is also expected to show significant expansion fueled by the growing automation of manufacturing processes and the adoption of smart factories. However, price fluctuations in raw materials and the potential for substitute technologies pose challenges to sustained market growth.
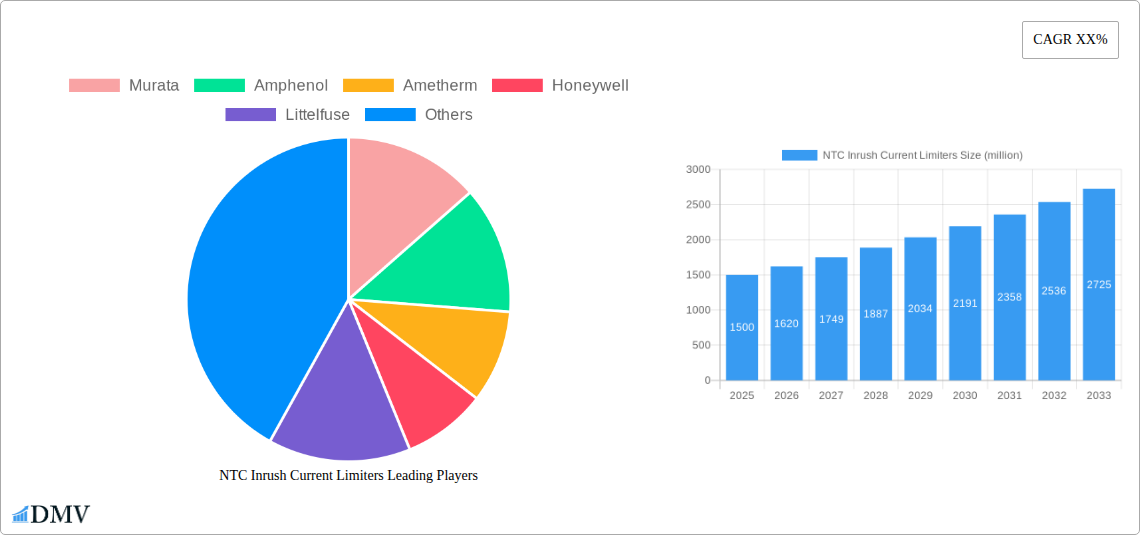
NTC Inrush Current Limiters Market Size (In Billion)
Despite these restraints, the long-term outlook for NTC Inrush Current Limiters remains positive. The increasing adoption of renewable energy sources and the rising demand for energy-efficient solutions are expected to further boost market growth. Furthermore, the miniaturization of these devices and advancements in materials science are expected to create new applications and opportunities. The market is geographically diverse, with North America and Europe representing significant shares. However, growth in emerging economies like Asia-Pacific is expected to accelerate in the coming years due to increasing industrialization and infrastructure development. The forecast period of 2025-2033 promises continued market expansion, driven by technological advancements, increasing demand from key sectors, and the ongoing efforts of major market participants.

NTC Inrush Current Limiters Company Market Share
NTC Inrush Current Limiters Market Report: 2019-2033 Forecast
This comprehensive report provides an in-depth analysis of the global NTC Inrush Current Limiters market, projecting a multi-million dollar valuation by 2033. It offers invaluable insights for stakeholders, investors, and industry professionals seeking to understand market trends, competitive dynamics, and future growth opportunities. The study period spans 2019-2033, with 2025 serving as the base and estimated year. The forecast period covers 2025-2033, while the historical period encompasses 2019-2024.
NTC Inrush Current Limiters Market Composition & Trends
The global NTC Inrush Current Limiter market, valued at $XX million in 2024, is expected to reach $XX million by 2033, exhibiting a CAGR of XX%. This growth is fueled by increasing demand across diverse sectors, including consumer electronics, automotive, industrial automation, and renewable energy. Market concentration is moderately high, with key players like Murata, TDK Corporation, and Littelfuse holding significant market share. However, smaller, specialized companies are also emerging, creating a dynamic competitive landscape.
- Market Share Distribution (2024): Murata (XX%), TDK Corporation (XX%), Littelfuse (XX%), Others (XX%).
- Innovation Catalysts: Miniaturization, improved thermal performance, and enhanced surge protection capabilities are driving innovation.
- Regulatory Landscape: Stringent safety and efficiency standards are influencing product development and adoption.
- Substitute Products: While few direct substitutes exist, alternative surge protection methods pose indirect competition.
- End-User Profiles: The automotive, industrial, and consumer electronics sectors are major end-users.
- M&A Activities: The past five years have witnessed approximately XX M&A deals in the NTC Inrush Current Limiter market, totaling approximately $XX million in value. These transactions indicate consolidation and expansion strategies among leading players.
NTC Inrush Current Limiters Industry Evolution
The NTC Inrush Current Limiter market has experienced significant evolution since 2019. Growth has been driven by the increasing adoption of electronic devices and the need for reliable surge protection across various applications. Technological advancements, such as the development of higher-power, smaller-sized devices, have further fueled market expansion. Consumer demand for energy-efficient and reliable electronic products also plays a crucial role. The market witnessed a growth rate of XX% from 2019 to 2024, demonstrating robust expansion. Adoption rates are particularly high in regions with rapidly developing infrastructure and increasing industrialization. Technological advancements like the introduction of improved material compositions and innovative manufacturing processes are expected to maintain this upward trajectory. The market is projected to expand significantly driven by increasing electronic device usage and stricter regulatory compliance.
Leading Regions, Countries, or Segments in NTC Inrush Current Limiters
The Asia-Pacific region currently dominates the NTC Inrush Current Limiter market, driven by booming electronics manufacturing and rapid industrial growth. North America and Europe follow as significant markets.
- Key Drivers in Asia-Pacific:
- High levels of investment in manufacturing and infrastructure.
- Favorable government policies promoting technological advancements in electronics.
- Strong demand from the rapidly growing consumer electronics sector.
- Dominance Factors: The region’s dominance is attributed to its large manufacturing base, lower labor costs, and strong demand for electronics. The presence of major electronics manufacturers further contributes to the region's leading position.
NTC Inrush Current Limiters Product Innovations
Recent innovations in NTC Inrush Current Limiters focus on enhancing thermal management, miniaturization, and improving surge absorption capabilities. New materials and designs allow for improved performance metrics, including faster response times and increased surge handling capacity. Unique selling propositions often revolve around enhanced energy efficiency, reduced device size, and superior reliability.
Propelling Factors for NTC Inrush Current Limiters Growth
The market's growth is propelled by several factors. Technological advancements continually improve device performance, making them more appealing for diverse applications. The growing demand for energy-efficient electronics also drives the need for effective surge protection solutions. Stringent safety regulations and growing awareness of the importance of reliable power protection are further contributing to market growth.
Obstacles in the NTC Inrush Current Limiters Market
Despite the growth potential, the market faces challenges. Supply chain disruptions and fluctuating raw material prices can impact production costs and availability. Intense competition from established players and the emergence of new competitors put downward pressure on pricing. Regulatory changes and compliance requirements can also pose challenges for manufacturers.
Future Opportunities in NTC Inrush Current Limiters
Significant opportunities exist in emerging markets like Africa and Latin America, where infrastructure development and increasing adoption of electronic devices are creating high demand. The development of next-generation NTC materials and improved manufacturing techniques offer further expansion avenues. Moreover, integrating NTC inrush current limiters with other power protection components could open new market segments.
Major Players in the NTC Inrush Current Limiters Ecosystem
- Murata
- Amphenol
- Ametherm
- Honeywell
- Littelfuse
- TDK Corporation
- ABB
- Eaton
- Cantherm
- Siemens
- Swatee Electronics
- Schneider Electric
- Vishay
- STMicroelectronics
- Rockwell Automation
Key Developments in NTC Inrush Current Limiters Industry
- 2022 Q3: Littelfuse launched a new line of high-power NTC inrush current limiters.
- 2023 Q1: Murata and TDK Corporation announced a strategic partnership focused on joint R&D in NTC technology.
- 2024 Q2: Ametherm acquired a smaller competitor, expanding its market share. (Further developments for subsequent years will be included in the full report)
Strategic NTC Inrush Current Limiters Market Forecast
The NTC Inrush Current Limiter market is poised for sustained growth, driven by technological advancements, expanding applications, and increasing demand across key sectors. Opportunities in emerging markets, coupled with ongoing product innovations, ensure robust growth prospects throughout the forecast period. The market is expected to continue its upward trajectory, with significant potential for expansion in diverse sectors and geographies.
NTC Inrush Current Limiters Segmentation
-
1. Application
- 1.1. Consumer Electronics
- 1.2. Automotive
- 1.3. Home Appliance
- 1.4. Industrial Equipment
- 1.5. Aerospace and Defense
- 1.6. Others
-
2. Types
- 2.1. Radial Type
- 2.2. Diode Type
NTC Inrush Current Limiters Segmentation By Geography
-
1. North America
- 1.1. United States
- 1.2. Canada
- 1.3. Mexico
-
2. South America
- 2.1. Brazil
- 2.2. Argentina
- 2.3. Rest of South America
-
3. Europe
- 3.1. United Kingdom
- 3.2. Germany
- 3.3. France
- 3.4. Italy
- 3.5. Spain
- 3.6. Russia
- 3.7. Benelux
- 3.8. Nordics
- 3.9. Rest of Europe
-
4. Middle East & Africa
- 4.1. Turkey
- 4.2. Israel
- 4.3. GCC
- 4.4. North Africa
- 4.5. South Africa
- 4.6. Rest of Middle East & Africa
-
5. Asia Pacific
- 5.1. China
- 5.2. India
- 5.3. Japan
- 5.4. South Korea
- 5.5. ASEAN
- 5.6. Oceania
- 5.7. Rest of Asia Pacific

NTC Inrush Current Limiters Regional Market Share
Geographic Coverage of NTC Inrush Current Limiters
NTC Inrush Current Limiters REPORT HIGHLIGHTS
| Aspects | Details |
|---|---|
| Study Period | 2020-2034 |
| Base Year | 2025 |
| Estimated Year | 2026 |
| Forecast Period | 2026-2034 |
| Historical Period | 2020-2025 |
| Growth Rate | CAGR of XX% from 2020-2034 |
| Segmentation |
|
Table of Contents
- 1. Introduction
- 1.1. Research Scope
- 1.2. Market Segmentation
- 1.3. Research Methodology
- 1.4. Definitions and Assumptions
- 2. Executive Summary
- 2.1. Introduction
- 3. Market Dynamics
- 3.1. Introduction
- 3.2. Market Drivers
- 3.3. Market Restrains
- 3.4. Market Trends
- 4. Market Factor Analysis
- 4.1. Porters Five Forces
- 4.2. Supply/Value Chain
- 4.3. PESTEL analysis
- 4.4. Market Entropy
- 4.5. Patent/Trademark Analysis
- 5. Global NTC Inrush Current Limiters Analysis, Insights and Forecast, 2020-2032
- 5.1. Market Analysis, Insights and Forecast - by Application
- 5.1.1. Consumer Electronics
- 5.1.2. Automotive
- 5.1.3. Home Appliance
- 5.1.4. Industrial Equipment
- 5.1.5. Aerospace and Defense
- 5.1.6. Others
- 5.2. Market Analysis, Insights and Forecast - by Types
- 5.2.1. Radial Type
- 5.2.2. Diode Type
- 5.3. Market Analysis, Insights and Forecast - by Region
- 5.3.1. North America
- 5.3.2. South America
- 5.3.3. Europe
- 5.3.4. Middle East & Africa
- 5.3.5. Asia Pacific
- 5.1. Market Analysis, Insights and Forecast - by Application
- 6. North America NTC Inrush Current Limiters Analysis, Insights and Forecast, 2020-2032
- 6.1. Market Analysis, Insights and Forecast - by Application
- 6.1.1. Consumer Electronics
- 6.1.2. Automotive
- 6.1.3. Home Appliance
- 6.1.4. Industrial Equipment
- 6.1.5. Aerospace and Defense
- 6.1.6. Others
- 6.2. Market Analysis, Insights and Forecast - by Types
- 6.2.1. Radial Type
- 6.2.2. Diode Type
- 6.1. Market Analysis, Insights and Forecast - by Application
- 7. South America NTC Inrush Current Limiters Analysis, Insights and Forecast, 2020-2032
- 7.1. Market Analysis, Insights and Forecast - by Application
- 7.1.1. Consumer Electronics
- 7.1.2. Automotive
- 7.1.3. Home Appliance
- 7.1.4. Industrial Equipment
- 7.1.5. Aerospace and Defense
- 7.1.6. Others
- 7.2. Market Analysis, Insights and Forecast - by Types
- 7.2.1. Radial Type
- 7.2.2. Diode Type
- 7.1. Market Analysis, Insights and Forecast - by Application
- 8. Europe NTC Inrush Current Limiters Analysis, Insights and Forecast, 2020-2032
- 8.1. Market Analysis, Insights and Forecast - by Application
- 8.1.1. Consumer Electronics
- 8.1.2. Automotive
- 8.1.3. Home Appliance
- 8.1.4. Industrial Equipment
- 8.1.5. Aerospace and Defense
- 8.1.6. Others
- 8.2. Market Analysis, Insights and Forecast - by Types
- 8.2.1. Radial Type
- 8.2.2. Diode Type
- 8.1. Market Analysis, Insights and Forecast - by Application
- 9. Middle East & Africa NTC Inrush Current Limiters Analysis, Insights and Forecast, 2020-2032
- 9.1. Market Analysis, Insights and Forecast - by Application
- 9.1.1. Consumer Electronics
- 9.1.2. Automotive
- 9.1.3. Home Appliance
- 9.1.4. Industrial Equipment
- 9.1.5. Aerospace and Defense
- 9.1.6. Others
- 9.2. Market Analysis, Insights and Forecast - by Types
- 9.2.1. Radial Type
- 9.2.2. Diode Type
- 9.1. Market Analysis, Insights and Forecast - by Application
- 10. Asia Pacific NTC Inrush Current Limiters Analysis, Insights and Forecast, 2020-2032
- 10.1. Market Analysis, Insights and Forecast - by Application
- 10.1.1. Consumer Electronics
- 10.1.2. Automotive
- 10.1.3. Home Appliance
- 10.1.4. Industrial Equipment
- 10.1.5. Aerospace and Defense
- 10.1.6. Others
- 10.2. Market Analysis, Insights and Forecast - by Types
- 10.2.1. Radial Type
- 10.2.2. Diode Type
- 10.1. Market Analysis, Insights and Forecast - by Application
- 11. Competitive Analysis
- 11.1. Global Market Share Analysis 2025
- 11.2. Company Profiles
- 11.2.1 Murata
- 11.2.1.1. Overview
- 11.2.1.2. Products
- 11.2.1.3. SWOT Analysis
- 11.2.1.4. Recent Developments
- 11.2.1.5. Financials (Based on Availability)
- 11.2.2 Amphenol
- 11.2.2.1. Overview
- 11.2.2.2. Products
- 11.2.2.3. SWOT Analysis
- 11.2.2.4. Recent Developments
- 11.2.2.5. Financials (Based on Availability)
- 11.2.3 Ametherm
- 11.2.3.1. Overview
- 11.2.3.2. Products
- 11.2.3.3. SWOT Analysis
- 11.2.3.4. Recent Developments
- 11.2.3.5. Financials (Based on Availability)
- 11.2.4 Honeywell
- 11.2.4.1. Overview
- 11.2.4.2. Products
- 11.2.4.3. SWOT Analysis
- 11.2.4.4. Recent Developments
- 11.2.4.5. Financials (Based on Availability)
- 11.2.5 Littelfuse
- 11.2.5.1. Overview
- 11.2.5.2. Products
- 11.2.5.3. SWOT Analysis
- 11.2.5.4. Recent Developments
- 11.2.5.5. Financials (Based on Availability)
- 11.2.6 TDK Corporation
- 11.2.6.1. Overview
- 11.2.6.2. Products
- 11.2.6.3. SWOT Analysis
- 11.2.6.4. Recent Developments
- 11.2.6.5. Financials (Based on Availability)
- 11.2.7 ABB
- 11.2.7.1. Overview
- 11.2.7.2. Products
- 11.2.7.3. SWOT Analysis
- 11.2.7.4. Recent Developments
- 11.2.7.5. Financials (Based on Availability)
- 11.2.8 Eaton
- 11.2.8.1. Overview
- 11.2.8.2. Products
- 11.2.8.3. SWOT Analysis
- 11.2.8.4. Recent Developments
- 11.2.8.5. Financials (Based on Availability)
- 11.2.9 Cantherm
- 11.2.9.1. Overview
- 11.2.9.2. Products
- 11.2.9.3. SWOT Analysis
- 11.2.9.4. Recent Developments
- 11.2.9.5. Financials (Based on Availability)
- 11.2.10 Siemens
- 11.2.10.1. Overview
- 11.2.10.2. Products
- 11.2.10.3. SWOT Analysis
- 11.2.10.4. Recent Developments
- 11.2.10.5. Financials (Based on Availability)
- 11.2.11 Swatee Electronics
- 11.2.11.1. Overview
- 11.2.11.2. Products
- 11.2.11.3. SWOT Analysis
- 11.2.11.4. Recent Developments
- 11.2.11.5. Financials (Based on Availability)
- 11.2.12 Schneider Electric
- 11.2.12.1. Overview
- 11.2.12.2. Products
- 11.2.12.3. SWOT Analysis
- 11.2.12.4. Recent Developments
- 11.2.12.5. Financials (Based on Availability)
- 11.2.13 Vishay
- 11.2.13.1. Overview
- 11.2.13.2. Products
- 11.2.13.3. SWOT Analysis
- 11.2.13.4. Recent Developments
- 11.2.13.5. Financials (Based on Availability)
- 11.2.14 STMicroelectronics
- 11.2.14.1. Overview
- 11.2.14.2. Products
- 11.2.14.3. SWOT Analysis
- 11.2.14.4. Recent Developments
- 11.2.14.5. Financials (Based on Availability)
- 11.2.15 Rockwell Automation
- 11.2.15.1. Overview
- 11.2.15.2. Products
- 11.2.15.3. SWOT Analysis
- 11.2.15.4. Recent Developments
- 11.2.15.5. Financials (Based on Availability)
- 11.2.1 Murata
List of Figures
- Figure 1: Global NTC Inrush Current Limiters Revenue Breakdown (million, %) by Region 2025 & 2033
- Figure 2: North America NTC Inrush Current Limiters Revenue (million), by Application 2025 & 2033
- Figure 3: North America NTC Inrush Current Limiters Revenue Share (%), by Application 2025 & 2033
- Figure 4: North America NTC Inrush Current Limiters Revenue (million), by Types 2025 & 2033
- Figure 5: North America NTC Inrush Current Limiters Revenue Share (%), by Types 2025 & 2033
- Figure 6: North America NTC Inrush Current Limiters Revenue (million), by Country 2025 & 2033
- Figure 7: North America NTC Inrush Current Limiters Revenue Share (%), by Country 2025 & 2033
- Figure 8: South America NTC Inrush Current Limiters Revenue (million), by Application 2025 & 2033
- Figure 9: South America NTC Inrush Current Limiters Revenue Share (%), by Application 2025 & 2033
- Figure 10: South America NTC Inrush Current Limiters Revenue (million), by Types 2025 & 2033
- Figure 11: South America NTC Inrush Current Limiters Revenue Share (%), by Types 2025 & 2033
- Figure 12: South America NTC Inrush Current Limiters Revenue (million), by Country 2025 & 2033
- Figure 13: South America NTC Inrush Current Limiters Revenue Share (%), by Country 2025 & 2033
- Figure 14: Europe NTC Inrush Current Limiters Revenue (million), by Application 2025 & 2033
- Figure 15: Europe NTC Inrush Current Limiters Revenue Share (%), by Application 2025 & 2033
- Figure 16: Europe NTC Inrush Current Limiters Revenue (million), by Types 2025 & 2033
- Figure 17: Europe NTC Inrush Current Limiters Revenue Share (%), by Types 2025 & 2033
- Figure 18: Europe NTC Inrush Current Limiters Revenue (million), by Country 2025 & 2033
- Figure 19: Europe NTC Inrush Current Limiters Revenue Share (%), by Country 2025 & 2033
- Figure 20: Middle East & Africa NTC Inrush Current Limiters Revenue (million), by Application 2025 & 2033
- Figure 21: Middle East & Africa NTC Inrush Current Limiters Revenue Share (%), by Application 2025 & 2033
- Figure 22: Middle East & Africa NTC Inrush Current Limiters Revenue (million), by Types 2025 & 2033
- Figure 23: Middle East & Africa NTC Inrush Current Limiters Revenue Share (%), by Types 2025 & 2033
- Figure 24: Middle East & Africa NTC Inrush Current Limiters Revenue (million), by Country 2025 & 2033
- Figure 25: Middle East & Africa NTC Inrush Current Limiters Revenue Share (%), by Country 2025 & 2033
- Figure 26: Asia Pacific NTC Inrush Current Limiters Revenue (million), by Application 2025 & 2033
- Figure 27: Asia Pacific NTC Inrush Current Limiters Revenue Share (%), by Application 2025 & 2033
- Figure 28: Asia Pacific NTC Inrush Current Limiters Revenue (million), by Types 2025 & 2033
- Figure 29: Asia Pacific NTC Inrush Current Limiters Revenue Share (%), by Types 2025 & 2033
- Figure 30: Asia Pacific NTC Inrush Current Limiters Revenue (million), by Country 2025 & 2033
- Figure 31: Asia Pacific NTC Inrush Current Limiters Revenue Share (%), by Country 2025 & 2033
List of Tables
- Table 1: Global NTC Inrush Current Limiters Revenue million Forecast, by Application 2020 & 2033
- Table 2: Global NTC Inrush Current Limiters Revenue million Forecast, by Types 2020 & 2033
- Table 3: Global NTC Inrush Current Limiters Revenue million Forecast, by Region 2020 & 2033
- Table 4: Global NTC Inrush Current Limiters Revenue million Forecast, by Application 2020 & 2033
- Table 5: Global NTC Inrush Current Limiters Revenue million Forecast, by Types 2020 & 2033
- Table 6: Global NTC Inrush Current Limiters Revenue million Forecast, by Country 2020 & 2033
- Table 7: United States NTC Inrush Current Limiters Revenue (million) Forecast, by Application 2020 & 2033
- Table 8: Canada NTC Inrush Current Limiters Revenue (million) Forecast, by Application 2020 & 2033
- Table 9: Mexico NTC Inrush Current Limiters Revenue (million) Forecast, by Application 2020 & 2033
- Table 10: Global NTC Inrush Current Limiters Revenue million Forecast, by Application 2020 & 2033
- Table 11: Global NTC Inrush Current Limiters Revenue million Forecast, by Types 2020 & 2033
- Table 12: Global NTC Inrush Current Limiters Revenue million Forecast, by Country 2020 & 2033
- Table 13: Brazil NTC Inrush Current Limiters Revenue (million) Forecast, by Application 2020 & 2033
- Table 14: Argentina NTC Inrush Current Limiters Revenue (million) Forecast, by Application 2020 & 2033
- Table 15: Rest of South America NTC Inrush Current Limiters Revenue (million) Forecast, by Application 2020 & 2033
- Table 16: Global NTC Inrush Current Limiters Revenue million Forecast, by Application 2020 & 2033
- Table 17: Global NTC Inrush Current Limiters Revenue million Forecast, by Types 2020 & 2033
- Table 18: Global NTC Inrush Current Limiters Revenue million Forecast, by Country 2020 & 2033
- Table 19: United Kingdom NTC Inrush Current Limiters Revenue (million) Forecast, by Application 2020 & 2033
- Table 20: Germany NTC Inrush Current Limiters Revenue (million) Forecast, by Application 2020 & 2033
- Table 21: France NTC Inrush Current Limiters Revenue (million) Forecast, by Application 2020 & 2033
- Table 22: Italy NTC Inrush Current Limiters Revenue (million) Forecast, by Application 2020 & 2033
- Table 23: Spain NTC Inrush Current Limiters Revenue (million) Forecast, by Application 2020 & 2033
- Table 24: Russia NTC Inrush Current Limiters Revenue (million) Forecast, by Application 2020 & 2033
- Table 25: Benelux NTC Inrush Current Limiters Revenue (million) Forecast, by Application 2020 & 2033
- Table 26: Nordics NTC Inrush Current Limiters Revenue (million) Forecast, by Application 2020 & 2033
- Table 27: Rest of Europe NTC Inrush Current Limiters Revenue (million) Forecast, by Application 2020 & 2033
- Table 28: Global NTC Inrush Current Limiters Revenue million Forecast, by Application 2020 & 2033
- Table 29: Global NTC Inrush Current Limiters Revenue million Forecast, by Types 2020 & 2033
- Table 30: Global NTC Inrush Current Limiters Revenue million Forecast, by Country 2020 & 2033
- Table 31: Turkey NTC Inrush Current Limiters Revenue (million) Forecast, by Application 2020 & 2033
- Table 32: Israel NTC Inrush Current Limiters Revenue (million) Forecast, by Application 2020 & 2033
- Table 33: GCC NTC Inrush Current Limiters Revenue (million) Forecast, by Application 2020 & 2033
- Table 34: North Africa NTC Inrush Current Limiters Revenue (million) Forecast, by Application 2020 & 2033
- Table 35: South Africa NTC Inrush Current Limiters Revenue (million) Forecast, by Application 2020 & 2033
- Table 36: Rest of Middle East & Africa NTC Inrush Current Limiters Revenue (million) Forecast, by Application 2020 & 2033
- Table 37: Global NTC Inrush Current Limiters Revenue million Forecast, by Application 2020 & 2033
- Table 38: Global NTC Inrush Current Limiters Revenue million Forecast, by Types 2020 & 2033
- Table 39: Global NTC Inrush Current Limiters Revenue million Forecast, by Country 2020 & 2033
- Table 40: China NTC Inrush Current Limiters Revenue (million) Forecast, by Application 2020 & 2033
- Table 41: India NTC Inrush Current Limiters Revenue (million) Forecast, by Application 2020 & 2033
- Table 42: Japan NTC Inrush Current Limiters Revenue (million) Forecast, by Application 2020 & 2033
- Table 43: South Korea NTC Inrush Current Limiters Revenue (million) Forecast, by Application 2020 & 2033
- Table 44: ASEAN NTC Inrush Current Limiters Revenue (million) Forecast, by Application 2020 & 2033
- Table 45: Oceania NTC Inrush Current Limiters Revenue (million) Forecast, by Application 2020 & 2033
- Table 46: Rest of Asia Pacific NTC Inrush Current Limiters Revenue (million) Forecast, by Application 2020 & 2033
Frequently Asked Questions
1. What is the projected Compound Annual Growth Rate (CAGR) of the NTC Inrush Current Limiters?
The projected CAGR is approximately XX%.
2. Which companies are prominent players in the NTC Inrush Current Limiters?
Key companies in the market include Murata, Amphenol, Ametherm, Honeywell, Littelfuse, TDK Corporation, ABB, Eaton, Cantherm, Siemens, Swatee Electronics, Schneider Electric, Vishay, STMicroelectronics, Rockwell Automation.
3. What are the main segments of the NTC Inrush Current Limiters?
The market segments include Application, Types.
4. Can you provide details about the market size?
The market size is estimated to be USD XXX million as of 2022.
5. What are some drivers contributing to market growth?
N/A
6. What are the notable trends driving market growth?
N/A
7. Are there any restraints impacting market growth?
N/A
8. Can you provide examples of recent developments in the market?
N/A
9. What pricing options are available for accessing the report?
Pricing options include single-user, multi-user, and enterprise licenses priced at USD 2900.00, USD 4350.00, and USD 5800.00 respectively.
10. Is the market size provided in terms of value or volume?
The market size is provided in terms of value, measured in million.
11. Are there any specific market keywords associated with the report?
Yes, the market keyword associated with the report is "NTC Inrush Current Limiters," which aids in identifying and referencing the specific market segment covered.
12. How do I determine which pricing option suits my needs best?
The pricing options vary based on user requirements and access needs. Individual users may opt for single-user licenses, while businesses requiring broader access may choose multi-user or enterprise licenses for cost-effective access to the report.
13. Are there any additional resources or data provided in the NTC Inrush Current Limiters report?
While the report offers comprehensive insights, it's advisable to review the specific contents or supplementary materials provided to ascertain if additional resources or data are available.
14. How can I stay updated on further developments or reports in the NTC Inrush Current Limiters?
To stay informed about further developments, trends, and reports in the NTC Inrush Current Limiters, consider subscribing to industry newsletters, following relevant companies and organizations, or regularly checking reputable industry news sources and publications.
Methodology
Step 1 - Identification of Relevant Samples Size from Population Database


Step 2 - Approaches for Defining Global Market Size (Value, Volume* & Price*)

Note*: In applicable scenarios
Step 3 - Data Sources
Primary Research
- Web Analytics
- Survey Reports
- Research Institute
- Latest Research Reports
- Opinion Leaders
Secondary Research
- Annual Reports
- White Paper
- Latest Press Release
- Industry Association
- Paid Database
- Investor Presentations

Step 4 - Data Triangulation
Involves using different sources of information in order to increase the validity of a study
These sources are likely to be stakeholders in a program - participants, other researchers, program staff, other community members, and so on.
Then we put all data in single framework & apply various statistical tools to find out the dynamic on the market.
During the analysis stage, feedback from the stakeholder groups would be compared to determine areas of agreement as well as areas of divergence