

Key Insights
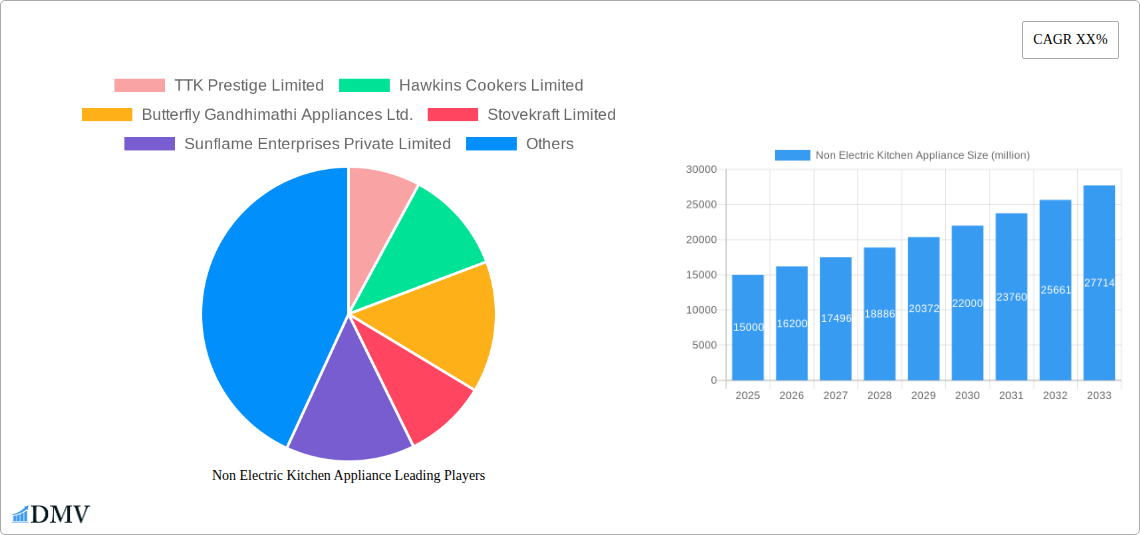
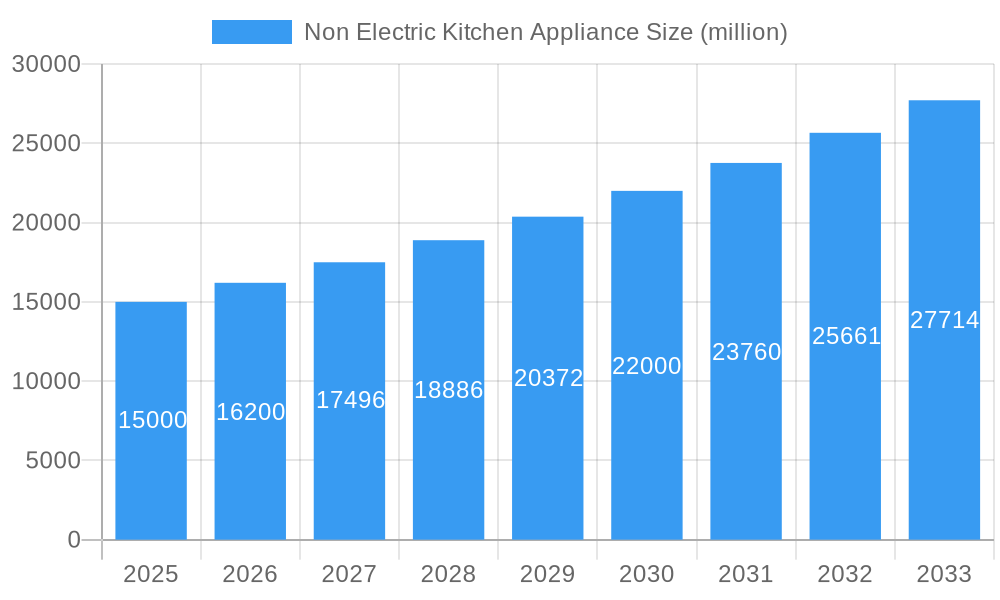
The global market for non-electric kitchen appliances is poised for significant expansion, projected to reach a robust market size of approximately $15,000 million by 2025, with a compelling Compound Annual Growth Rate (CAGR) of around 8%. This sustained growth trajectory is primarily fueled by increasing consumer awareness regarding energy efficiency and a desire for sustainable living solutions, particularly in emerging economies. The growing appeal of manual kitchen tools that offer greater control and a more traditional cooking experience also contributes to market momentum. Furthermore, the inherent affordability and low maintenance costs associated with non-electric appliances make them an attractive option for a broad consumer base, especially in price-sensitive markets. The convenience and reliability offered by these appliances, independent of power supply fluctuations, further bolster their demand.
Non Electric Kitchen Appliance Market Size (In Billion)
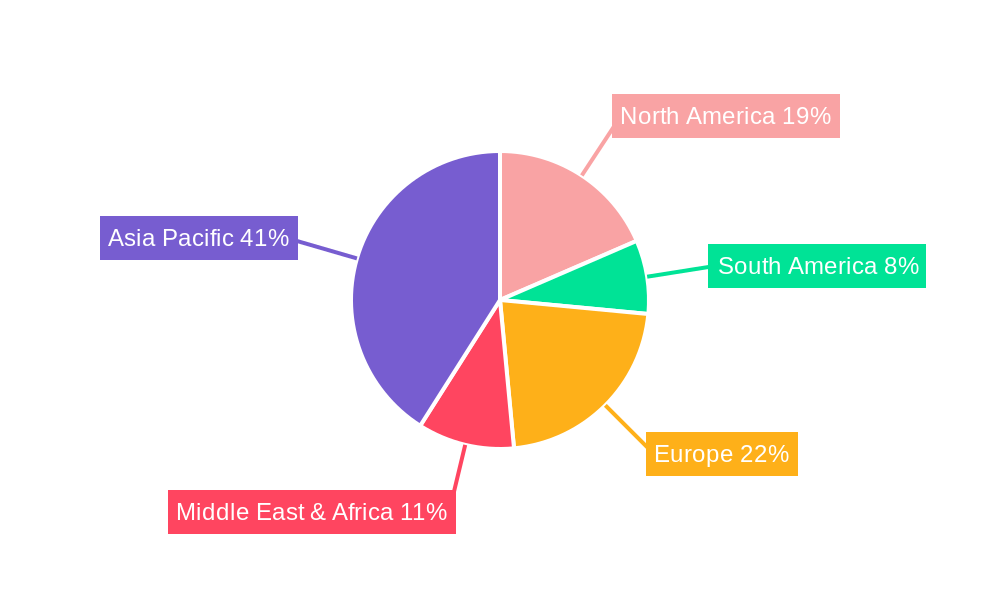
The market is segmented into two primary application areas: Household and Commercial. Within household applications, the demand for gas stoves and pressure cookers is expected to remain strong, driven by their widespread adoption and perceived efficiency. However, the "Other" category, encompassing innovative non-electric juicers, toasters, and food processors, is anticipated to witness the fastest growth due to product diversification and increasing consumer interest in healthier and more convenient kitchen gadgets. Geographically, the Asia Pacific region, led by India and China, is expected to dominate the market share, attributing to its large population, rising disposable incomes, and a strong cultural inclination towards traditional cooking methods. While North America and Europe represent mature markets, they will still contribute substantially through the adoption of specialized and premium non-electric kitchenware.
Non Electric Kitchen Appliance Company Market Share
Non Electric Kitchen Appliance Market Composition & Trends
The global non-electric kitchen appliance market is characterized by a moderate concentration of key players, with a significant portion of the market share held by established brands like TTK Prestige Limited, Hawkins Cookers Limited, and Butterfly Gandhimathi Appliances Ltd. Innovation is primarily driven by the pursuit of enhanced user convenience, energy efficiency, and durability. Regulatory landscapes are largely focused on product safety and material compliance, with minimal direct intervention in non-electric product development. Substitute products, such as electric alternatives and advanced cooking technologies, pose a moderate threat, yet the inherent reliability and affordability of non-electric appliances maintain their strong appeal. End-user profiles are diverse, ranging from budget-conscious households seeking cost-effective solutions to commercial establishments prioritizing robust and low-maintenance equipment. Mergers and acquisition activities have been relatively subdued but are anticipated to increase as companies seek to expand their product portfolios and geographical reach. M&A deal values are projected to be in the range of XX million to XX million.
- Market Share Distribution: The top five players collectively hold an estimated XX% of the market share.
- Innovation Catalysts: Focus on material science for improved durability, ergonomic designs, and eco-friendly materials.
- Regulatory Landscapes: Emphasis on food-grade materials and safety certifications.
- Substitute Products: Threat from electric appliances and induction cooktops, countered by lower initial cost and zero electricity dependence.
- End-User Profiles: Households prioritizing affordability and reliability, and commercial kitchens valuing longevity and ease of maintenance.
- M&A Activities: Limited but growing, with potential for consolidation in specialized product segments.
Non Electric Kitchen Appliance Industry Evolution
The non-electric kitchen appliance industry has undergone a remarkable evolution, demonstrating consistent growth trajectories fueled by shifting consumer preferences and technological refinements. Throughout the historical period of 2019–2024, the market experienced a steady expansion, driven by the inherent advantages of these appliances, such as their independence from electricity grids and lower operational costs. The base year of 2025 marks a pivotal point, with the market poised for accelerated growth in the forecast period extending to 2033. This growth is underpinned by several key factors. Firstly, increasing consumer awareness regarding energy conservation and sustainability has propelled demand for non-electric alternatives, aligning with global environmental initiatives. Secondly, rising disposable incomes in emerging economies have led to a greater purchasing power for household goods, including kitchen appliances, where affordability remains a significant consideration.
Technological advancements, though less disruptive than in the electric appliance sector, have focused on improving the functionality and user experience of non-electric products. This includes the development of more efficient designs for pressure cookers that reduce cooking times, the introduction of ergonomic features in manual food processors, and the enhancement of heat distribution in gas stoves. Furthermore, the raw materials used in manufacturing have seen innovations, leading to lighter yet more durable products. Adoption metrics for specialized non-electric appliances like non-electric juicers and toasters are gradually increasing as consumers seek healthy and convenient kitchen solutions. The estimated year of 2025 is expected to see a market growth rate of approximately XX%, with projections indicating a compound annual growth rate (CAGR) of XX% during the forecast period of 2025–2033. This sustained expansion reflects the enduring relevance and adaptability of non-electric kitchen appliances in meeting the diverse needs of consumers worldwide. The industry's ability to maintain competitive pricing while incorporating subtle but impactful product enhancements ensures its continued prominence in the global kitchenware market.
Leading Regions, Countries, or Segments in Non Electric Kitchen Appliance
The global non-electric kitchen appliance market is significantly influenced by regional dynamics and segment-specific demand. Among the various applications, the Household segment consistently leads, driven by its widespread adoption across a vast consumer base prioritizing affordability, reliability, and independence from electricity. This dominance is particularly pronounced in emerging economies where consistent power supply can be a concern, and budget constraints are a primary purchasing factor. Countries within Asia-Pacific, such as India, are major contributors to this leadership, with a strong presence of key manufacturers like TTK Prestige Limited, Hawkins Cookers Limited, and Butterfly Gandhimathi Appliances Ltd. These companies have deeply penetrated the household segment with their extensive range of gas stoves and pressure cookers.
- Dominant Application Segment: Household, accounting for an estimated XX% of the total market revenue.
- Key Drivers: Growing middle-class population, increasing disposable incomes, and a strong preference for cost-effective kitchen solutions.
- Market Penetration: High adoption rates for essential kitchenware like pressure cookers and gas stoves.
In terms of product types, Gas Stoves and Pressure Cookers are the undisputed leaders within the non-electric kitchen appliance landscape. These products form the backbone of daily cooking in millions of households and commercial establishments alike. Their continued popularity stems from their proven efficiency, ease of use, and relatively low initial investment compared to their electric counterparts. The Commercial application segment, while smaller than the household segment, is also a crucial contributor, with restaurants, cafes, and catering services relying on the durability and long-term cost-effectiveness of non-electric appliances.
- Dominant Product Types: Gas Stoves and Pressure Cookers, collectively representing over XX% of the non-electric appliance market.
- Key Drivers for Gas Stoves: Versatility in cooking, precise heat control, and widespread availability of LPG.
- Key Drivers for Pressure Cookers: Significant reduction in cooking time, energy savings, and retention of nutrients in food.
- Commercial Application Influence: Robust demand from food service industry for durability and low maintenance.
The Commercial segment, although smaller, is a critical market for these durable goods. Countries with thriving hospitality industries often exhibit higher demand for commercial-grade non-electric appliances due to their resilience and cost-effectiveness in high-usage environments. Regulatory support in certain regions, emphasizing energy efficiency and safety standards for kitchen appliances, indirectly bolsters the market for well-designed and compliant non-electric options. Investment trends are increasingly focused on optimizing manufacturing processes for these core products, ensuring competitive pricing and consistent quality. The interplay between these applications and product types, driven by specific regional economic conditions and consumer behaviors, solidifies the dominance of the household segment and the widespread appeal of gas stoves and pressure cookers within the non-electric kitchen appliance market.
Non Electric Kitchen Appliance Product Innovations
Product innovations in the non-electric kitchen appliance sector are primarily focused on enhancing user experience, durability, and safety. Manufacturers are incorporating advanced materials like reinforced polymers and high-grade stainless steel to increase the lifespan and reduce the weight of appliances. Ergonomic designs are a key focus, with features like improved handle grips on pressure cookers and more intuitive burner controls on gas stoves. For non-electric juicers, innovations include enhanced juicing mechanisms for better yield and easier cleaning. Similarly, non-electric toasters are seeing advancements in crumb tray design and uniform toasting capabilities. The application of heat-resistant coatings and improved sealing technologies in pressure cookers further boosts their performance and safety. These incremental yet impactful advancements are crucial for maintaining market relevance.
Propelling Factors for Non Electric Kitchen Appliance Growth
The growth of the non-electric kitchen appliance market is propelled by a confluence of economic, technological, and consumer-driven factors. Economically, the affordability of these appliances, coupled with lower operational costs compared to their electric counterparts, makes them highly attractive, especially in emerging economies. Technologically, innovations in material science have led to more durable and user-friendly designs, enhancing their appeal. Consumer trends, such as a growing emphasis on sustainability and a desire for reliable, independent kitchen solutions, further fuel demand. The consistent availability of LPG and other non-electric fuel sources in many regions also supports their sustained usage.
- Affordability: Lower upfront cost and reduced running expenses.
- Energy Independence: Reliable functionality even during power outages.
- Durability & Reliability: Often built for longevity and heavy use.
- Environmental Consciousness: Perceived as more eco-friendly due to zero direct electricity consumption.
Obstacles in the Non Electric Kitchen Appliance Market
Despite its robust growth, the non-electric kitchen appliance market faces several obstacles. Regulatory challenges, while generally focused on safety, can sometimes lead to increased manufacturing costs. Supply chain disruptions, particularly for raw materials like specialized metals, can impact production volumes and pricing. Competitive pressures from the rapidly advancing electric appliance market, which offers greater convenience and advanced features, also pose a significant threat. Consumer perception, sometimes associating non-electric appliances with older technology, can also be a barrier to adoption for newer generations. Quantifiable impacts include potential price increases of XX% due to supply chain issues and a market share erosion of XX% to electric alternatives in certain segments.
Future Opportunities in Non Electric Kitchen Appliance
The future of the non-electric kitchen appliance market is ripe with opportunities. Emerging markets in developing nations present significant untapped potential due to their growing middle class and existing reliance on non-electric cooking methods. Technological advancements in areas like improved insulation for heat retention in stovetop appliances and more efficient manual grinding mechanisms for food processors can create new product categories. Furthermore, a growing global focus on sustainable living and resilience in the face of potential energy grid instability will continue to drive demand for these reliable and eco-friendly kitchen solutions.
Major Players in the Non Electric Kitchen Appliance Ecosystem
- TTK Prestige Limited
- Hawkins Cookers Limited
- Butterfly Gandhimathi Appliances Ltd.
- Stovekraft Limited
- Sunflame Enterprises Private Limited
- United Ekta Engineering
- Bajaj Electricals Limited
- Jaipan Industries Limited
- Preethi Kitchen Appliances Pvt Ltd
- Singer India Limited
Key Developments in Non Electric Kitchen Appliance Industry
- 2023 March: TTK Prestige Limited launches a new range of induction-compatible pressure cookers, enhancing product versatility.
- 2023 August: Hawkins Cookers Limited introduces advanced safety features in their popular pressure cooker models, further solidifying consumer trust.
- 2024 January: Butterfly Gandhimathi Appliances Ltd. expands its gas stove portfolio with energy-efficient models, catering to eco-conscious consumers.
- 2024 June: Stovekraft Limited announces strategic partnerships to improve its distribution network for non-electric appliances in rural areas.
- 2024 December: Sunflame Enterprises Private Limited focuses on material innovation, utilizing lighter and more durable alloys for its gas stoves.
Strategic Non Electric Kitchen Appliance Market Forecast
The strategic non-electric kitchen appliance market forecast indicates sustained growth driven by inherent advantages and evolving consumer needs. The increasing demand for affordable, reliable, and energy-independent kitchen solutions, particularly in developing economies, will be a primary growth catalyst. Innovations in material science and design will continue to enhance product performance and user experience, making non-electric appliances more competitive. The global emphasis on sustainability and resilience in energy infrastructure further bolsters the long-term market potential for these essential kitchen tools, solidifying their place in both household and commercial settings for the foreseeable future.
Non Electric Kitchen Appliance Segmentation
-
1. Application
- 1.1. Household
- 1.2. Commercial
-
2. Types
- 2.1. Gas Stoves
- 2.2. Pressure Cookers
- 2.3. Non Electric Juicers
- 2.4. Non Electric Toasters
- 2.5. Non Electric Food Processors
- 2.6. Other
Non Electric Kitchen Appliance Segmentation By Geography
-
1. North America
- 1.1. United States
- 1.2. Canada
- 1.3. Mexico
-
2. South America
- 2.1. Brazil
- 2.2. Argentina
- 2.3. Rest of South America
-
3. Europe
- 3.1. United Kingdom
- 3.2. Germany
- 3.3. France
- 3.4. Italy
- 3.5. Spain
- 3.6. Russia
- 3.7. Benelux
- 3.8. Nordics
- 3.9. Rest of Europe
-
4. Middle East & Africa
- 4.1. Turkey
- 4.2. Israel
- 4.3. GCC
- 4.4. North Africa
- 4.5. South Africa
- 4.6. Rest of Middle East & Africa
-
5. Asia Pacific
- 5.1. China
- 5.2. India
- 5.3. Japan
- 5.4. South Korea
- 5.5. ASEAN
- 5.6. Oceania
- 5.7. Rest of Asia Pacific
Non Electric Kitchen Appliance Regional Market Share
Geographic Coverage of Non Electric Kitchen Appliance
Non Electric Kitchen Appliance REPORT HIGHLIGHTS
| Aspects | Details |
|---|---|
| Study Period | 2020-2034 |
| Base Year | 2025 |
| Estimated Year | 2026 |
| Forecast Period | 2026-2034 |
| Historical Period | 2020-2025 |
| Growth Rate | CAGR of 4.5% from 2020-2034 |
| Segmentation |
|
Table of Contents
- 1. Introduction
- 1.1. Research Scope
- 1.2. Market Segmentation
- 1.3. Research Methodology
- 1.4. Definitions and Assumptions
- 2. Executive Summary
- 2.1. Introduction
- 3. Market Dynamics
- 3.1. Introduction
- 3.2. Market Drivers
- 3.3. Market Restrains
- 3.4. Market Trends
- 4. Market Factor Analysis
- 4.1. Porters Five Forces
- 4.2. Supply/Value Chain
- 4.3. PESTEL analysis
- 4.4. Market Entropy
- 4.5. Patent/Trademark Analysis
- 5. Global Non Electric Kitchen Appliance Analysis, Insights and Forecast, 2020-2032
- 5.1. Market Analysis, Insights and Forecast - by Application
- 5.1.1. Household
- 5.1.2. Commercial
- 5.2. Market Analysis, Insights and Forecast - by Types
- 5.2.1. Gas Stoves
- 5.2.2. Pressure Cookers
- 5.2.3. Non Electric Juicers
- 5.2.4. Non Electric Toasters
- 5.2.5. Non Electric Food Processors
- 5.2.6. Other
- 5.3. Market Analysis, Insights and Forecast - by Region
- 5.3.1. North America
- 5.3.2. South America
- 5.3.3. Europe
- 5.3.4. Middle East & Africa
- 5.3.5. Asia Pacific
- 5.1. Market Analysis, Insights and Forecast - by Application
- 6. North America Non Electric Kitchen Appliance Analysis, Insights and Forecast, 2020-2032
- 6.1. Market Analysis, Insights and Forecast - by Application
- 6.1.1. Household
- 6.1.2. Commercial
- 6.2. Market Analysis, Insights and Forecast - by Types
- 6.2.1. Gas Stoves
- 6.2.2. Pressure Cookers
- 6.2.3. Non Electric Juicers
- 6.2.4. Non Electric Toasters
- 6.2.5. Non Electric Food Processors
- 6.2.6. Other
- 6.1. Market Analysis, Insights and Forecast - by Application
- 7. South America Non Electric Kitchen Appliance Analysis, Insights and Forecast, 2020-2032
- 7.1. Market Analysis, Insights and Forecast - by Application
- 7.1.1. Household
- 7.1.2. Commercial
- 7.2. Market Analysis, Insights and Forecast - by Types
- 7.2.1. Gas Stoves
- 7.2.2. Pressure Cookers
- 7.2.3. Non Electric Juicers
- 7.2.4. Non Electric Toasters
- 7.2.5. Non Electric Food Processors
- 7.2.6. Other
- 7.1. Market Analysis, Insights and Forecast - by Application
- 8. Europe Non Electric Kitchen Appliance Analysis, Insights and Forecast, 2020-2032
- 8.1. Market Analysis, Insights and Forecast - by Application
- 8.1.1. Household
- 8.1.2. Commercial
- 8.2. Market Analysis, Insights and Forecast - by Types
- 8.2.1. Gas Stoves
- 8.2.2. Pressure Cookers
- 8.2.3. Non Electric Juicers
- 8.2.4. Non Electric Toasters
- 8.2.5. Non Electric Food Processors
- 8.2.6. Other
- 8.1. Market Analysis, Insights and Forecast - by Application
- 9. Middle East & Africa Non Electric Kitchen Appliance Analysis, Insights and Forecast, 2020-2032
- 9.1. Market Analysis, Insights and Forecast - by Application
- 9.1.1. Household
- 9.1.2. Commercial
- 9.2. Market Analysis, Insights and Forecast - by Types
- 9.2.1. Gas Stoves
- 9.2.2. Pressure Cookers
- 9.2.3. Non Electric Juicers
- 9.2.4. Non Electric Toasters
- 9.2.5. Non Electric Food Processors
- 9.2.6. Other
- 9.1. Market Analysis, Insights and Forecast - by Application
- 10. Asia Pacific Non Electric Kitchen Appliance Analysis, Insights and Forecast, 2020-2032
- 10.1. Market Analysis, Insights and Forecast - by Application
- 10.1.1. Household
- 10.1.2. Commercial
- 10.2. Market Analysis, Insights and Forecast - by Types
- 10.2.1. Gas Stoves
- 10.2.2. Pressure Cookers
- 10.2.3. Non Electric Juicers
- 10.2.4. Non Electric Toasters
- 10.2.5. Non Electric Food Processors
- 10.2.6. Other
- 10.1. Market Analysis, Insights and Forecast - by Application
- 11. Competitive Analysis
- 11.1. Global Market Share Analysis 2025
- 11.2. Company Profiles
- 11.2.1 TTK Prestige Limited
- 11.2.1.1. Overview
- 11.2.1.2. Products
- 11.2.1.3. SWOT Analysis
- 11.2.1.4. Recent Developments
- 11.2.1.5. Financials (Based on Availability)
- 11.2.2 Hawkins Cookers Limited
- 11.2.2.1. Overview
- 11.2.2.2. Products
- 11.2.2.3. SWOT Analysis
- 11.2.2.4. Recent Developments
- 11.2.2.5. Financials (Based on Availability)
- 11.2.3 Butterfly Gandhimathi Appliances Ltd.
- 11.2.3.1. Overview
- 11.2.3.2. Products
- 11.2.3.3. SWOT Analysis
- 11.2.3.4. Recent Developments
- 11.2.3.5. Financials (Based on Availability)
- 11.2.4 Stovekraft Limited
- 11.2.4.1. Overview
- 11.2.4.2. Products
- 11.2.4.3. SWOT Analysis
- 11.2.4.4. Recent Developments
- 11.2.4.5. Financials (Based on Availability)
- 11.2.5 Sunflame Enterprises Private Limited
- 11.2.5.1. Overview
- 11.2.5.2. Products
- 11.2.5.3. SWOT Analysis
- 11.2.5.4. Recent Developments
- 11.2.5.5. Financials (Based on Availability)
- 11.2.6 United Ekta Engineering
- 11.2.6.1. Overview
- 11.2.6.2. Products
- 11.2.6.3. SWOT Analysis
- 11.2.6.4. Recent Developments
- 11.2.6.5. Financials (Based on Availability)
- 11.2.7 Bajaj Electricals Limited
- 11.2.7.1. Overview
- 11.2.7.2. Products
- 11.2.7.3. SWOT Analysis
- 11.2.7.4. Recent Developments
- 11.2.7.5. Financials (Based on Availability)
- 11.2.8 Jaipan Industries Limited
- 11.2.8.1. Overview
- 11.2.8.2. Products
- 11.2.8.3. SWOT Analysis
- 11.2.8.4. Recent Developments
- 11.2.8.5. Financials (Based on Availability)
- 11.2.9 Preethi Kitchen Appliances Pvt Ltd
- 11.2.9.1. Overview
- 11.2.9.2. Products
- 11.2.9.3. SWOT Analysis
- 11.2.9.4. Recent Developments
- 11.2.9.5. Financials (Based on Availability)
- 11.2.10 Singer India Limited
- 11.2.10.1. Overview
- 11.2.10.2. Products
- 11.2.10.3. SWOT Analysis
- 11.2.10.4. Recent Developments
- 11.2.10.5. Financials (Based on Availability)
- 11.2.1 TTK Prestige Limited
List of Figures
- Figure 1: Global Non Electric Kitchen Appliance Revenue Breakdown (undefined, %) by Region 2025 & 2033
- Figure 2: North America Non Electric Kitchen Appliance Revenue (undefined), by Application 2025 & 2033
- Figure 3: North America Non Electric Kitchen Appliance Revenue Share (%), by Application 2025 & 2033
- Figure 4: North America Non Electric Kitchen Appliance Revenue (undefined), by Types 2025 & 2033
- Figure 5: North America Non Electric Kitchen Appliance Revenue Share (%), by Types 2025 & 2033
- Figure 6: North America Non Electric Kitchen Appliance Revenue (undefined), by Country 2025 & 2033
- Figure 7: North America Non Electric Kitchen Appliance Revenue Share (%), by Country 2025 & 2033
- Figure 8: South America Non Electric Kitchen Appliance Revenue (undefined), by Application 2025 & 2033
- Figure 9: South America Non Electric Kitchen Appliance Revenue Share (%), by Application 2025 & 2033
- Figure 10: South America Non Electric Kitchen Appliance Revenue (undefined), by Types 2025 & 2033
- Figure 11: South America Non Electric Kitchen Appliance Revenue Share (%), by Types 2025 & 2033
- Figure 12: South America Non Electric Kitchen Appliance Revenue (undefined), by Country 2025 & 2033
- Figure 13: South America Non Electric Kitchen Appliance Revenue Share (%), by Country 2025 & 2033
- Figure 14: Europe Non Electric Kitchen Appliance Revenue (undefined), by Application 2025 & 2033
- Figure 15: Europe Non Electric Kitchen Appliance Revenue Share (%), by Application 2025 & 2033
- Figure 16: Europe Non Electric Kitchen Appliance Revenue (undefined), by Types 2025 & 2033
- Figure 17: Europe Non Electric Kitchen Appliance Revenue Share (%), by Types 2025 & 2033
- Figure 18: Europe Non Electric Kitchen Appliance Revenue (undefined), by Country 2025 & 2033
- Figure 19: Europe Non Electric Kitchen Appliance Revenue Share (%), by Country 2025 & 2033
- Figure 20: Middle East & Africa Non Electric Kitchen Appliance Revenue (undefined), by Application 2025 & 2033
- Figure 21: Middle East & Africa Non Electric Kitchen Appliance Revenue Share (%), by Application 2025 & 2033
- Figure 22: Middle East & Africa Non Electric Kitchen Appliance Revenue (undefined), by Types 2025 & 2033
- Figure 23: Middle East & Africa Non Electric Kitchen Appliance Revenue Share (%), by Types 2025 & 2033
- Figure 24: Middle East & Africa Non Electric Kitchen Appliance Revenue (undefined), by Country 2025 & 2033
- Figure 25: Middle East & Africa Non Electric Kitchen Appliance Revenue Share (%), by Country 2025 & 2033
- Figure 26: Asia Pacific Non Electric Kitchen Appliance Revenue (undefined), by Application 2025 & 2033
- Figure 27: Asia Pacific Non Electric Kitchen Appliance Revenue Share (%), by Application 2025 & 2033
- Figure 28: Asia Pacific Non Electric Kitchen Appliance Revenue (undefined), by Types 2025 & 2033
- Figure 29: Asia Pacific Non Electric Kitchen Appliance Revenue Share (%), by Types 2025 & 2033
- Figure 30: Asia Pacific Non Electric Kitchen Appliance Revenue (undefined), by Country 2025 & 2033
- Figure 31: Asia Pacific Non Electric Kitchen Appliance Revenue Share (%), by Country 2025 & 2033
List of Tables
- Table 1: Global Non Electric Kitchen Appliance Revenue undefined Forecast, by Application 2020 & 2033
- Table 2: Global Non Electric Kitchen Appliance Revenue undefined Forecast, by Types 2020 & 2033
- Table 3: Global Non Electric Kitchen Appliance Revenue undefined Forecast, by Region 2020 & 2033
- Table 4: Global Non Electric Kitchen Appliance Revenue undefined Forecast, by Application 2020 & 2033
- Table 5: Global Non Electric Kitchen Appliance Revenue undefined Forecast, by Types 2020 & 2033
- Table 6: Global Non Electric Kitchen Appliance Revenue undefined Forecast, by Country 2020 & 2033
- Table 7: United States Non Electric Kitchen Appliance Revenue (undefined) Forecast, by Application 2020 & 2033
- Table 8: Canada Non Electric Kitchen Appliance Revenue (undefined) Forecast, by Application 2020 & 2033
- Table 9: Mexico Non Electric Kitchen Appliance Revenue (undefined) Forecast, by Application 2020 & 2033
- Table 10: Global Non Electric Kitchen Appliance Revenue undefined Forecast, by Application 2020 & 2033
- Table 11: Global Non Electric Kitchen Appliance Revenue undefined Forecast, by Types 2020 & 2033
- Table 12: Global Non Electric Kitchen Appliance Revenue undefined Forecast, by Country 2020 & 2033
- Table 13: Brazil Non Electric Kitchen Appliance Revenue (undefined) Forecast, by Application 2020 & 2033
- Table 14: Argentina Non Electric Kitchen Appliance Revenue (undefined) Forecast, by Application 2020 & 2033
- Table 15: Rest of South America Non Electric Kitchen Appliance Revenue (undefined) Forecast, by Application 2020 & 2033
- Table 16: Global Non Electric Kitchen Appliance Revenue undefined Forecast, by Application 2020 & 2033
- Table 17: Global Non Electric Kitchen Appliance Revenue undefined Forecast, by Types 2020 & 2033
- Table 18: Global Non Electric Kitchen Appliance Revenue undefined Forecast, by Country 2020 & 2033
- Table 19: United Kingdom Non Electric Kitchen Appliance Revenue (undefined) Forecast, by Application 2020 & 2033
- Table 20: Germany Non Electric Kitchen Appliance Revenue (undefined) Forecast, by Application 2020 & 2033
- Table 21: France Non Electric Kitchen Appliance Revenue (undefined) Forecast, by Application 2020 & 2033
- Table 22: Italy Non Electric Kitchen Appliance Revenue (undefined) Forecast, by Application 2020 & 2033
- Table 23: Spain Non Electric Kitchen Appliance Revenue (undefined) Forecast, by Application 2020 & 2033
- Table 24: Russia Non Electric Kitchen Appliance Revenue (undefined) Forecast, by Application 2020 & 2033
- Table 25: Benelux Non Electric Kitchen Appliance Revenue (undefined) Forecast, by Application 2020 & 2033
- Table 26: Nordics Non Electric Kitchen Appliance Revenue (undefined) Forecast, by Application 2020 & 2033
- Table 27: Rest of Europe Non Electric Kitchen Appliance Revenue (undefined) Forecast, by Application 2020 & 2033
- Table 28: Global Non Electric Kitchen Appliance Revenue undefined Forecast, by Application 2020 & 2033
- Table 29: Global Non Electric Kitchen Appliance Revenue undefined Forecast, by Types 2020 & 2033
- Table 30: Global Non Electric Kitchen Appliance Revenue undefined Forecast, by Country 2020 & 2033
- Table 31: Turkey Non Electric Kitchen Appliance Revenue (undefined) Forecast, by Application 2020 & 2033
- Table 32: Israel Non Electric Kitchen Appliance Revenue (undefined) Forecast, by Application 2020 & 2033
- Table 33: GCC Non Electric Kitchen Appliance Revenue (undefined) Forecast, by Application 2020 & 2033
- Table 34: North Africa Non Electric Kitchen Appliance Revenue (undefined) Forecast, by Application 2020 & 2033
- Table 35: South Africa Non Electric Kitchen Appliance Revenue (undefined) Forecast, by Application 2020 & 2033
- Table 36: Rest of Middle East & Africa Non Electric Kitchen Appliance Revenue (undefined) Forecast, by Application 2020 & 2033
- Table 37: Global Non Electric Kitchen Appliance Revenue undefined Forecast, by Application 2020 & 2033
- Table 38: Global Non Electric Kitchen Appliance Revenue undefined Forecast, by Types 2020 & 2033
- Table 39: Global Non Electric Kitchen Appliance Revenue undefined Forecast, by Country 2020 & 2033
- Table 40: China Non Electric Kitchen Appliance Revenue (undefined) Forecast, by Application 2020 & 2033
- Table 41: India Non Electric Kitchen Appliance Revenue (undefined) Forecast, by Application 2020 & 2033
- Table 42: Japan Non Electric Kitchen Appliance Revenue (undefined) Forecast, by Application 2020 & 2033
- Table 43: South Korea Non Electric Kitchen Appliance Revenue (undefined) Forecast, by Application 2020 & 2033
- Table 44: ASEAN Non Electric Kitchen Appliance Revenue (undefined) Forecast, by Application 2020 & 2033
- Table 45: Oceania Non Electric Kitchen Appliance Revenue (undefined) Forecast, by Application 2020 & 2033
- Table 46: Rest of Asia Pacific Non Electric Kitchen Appliance Revenue (undefined) Forecast, by Application 2020 & 2033
Frequently Asked Questions
1. What is the projected Compound Annual Growth Rate (CAGR) of the Non Electric Kitchen Appliance?
The projected CAGR is approximately 4.5%.
2. Which companies are prominent players in the Non Electric Kitchen Appliance?
Key companies in the market include TTK Prestige Limited, Hawkins Cookers Limited, Butterfly Gandhimathi Appliances Ltd., Stovekraft Limited, Sunflame Enterprises Private Limited, United Ekta Engineering, Bajaj Electricals Limited, Jaipan Industries Limited, Preethi Kitchen Appliances Pvt Ltd, Singer India Limited.
3. What are the main segments of the Non Electric Kitchen Appliance?
The market segments include Application, Types.
4. Can you provide details about the market size?
The market size is estimated to be USD XXX N/A as of 2022.
5. What are some drivers contributing to market growth?
N/A
6. What are the notable trends driving market growth?
N/A
7. Are there any restraints impacting market growth?
N/A
8. Can you provide examples of recent developments in the market?
N/A
9. What pricing options are available for accessing the report?
Pricing options include single-user, multi-user, and enterprise licenses priced at USD 2900.00, USD 4350.00, and USD 5800.00 respectively.
10. Is the market size provided in terms of value or volume?
The market size is provided in terms of value, measured in N/A.
11. Are there any specific market keywords associated with the report?
Yes, the market keyword associated with the report is "Non Electric Kitchen Appliance," which aids in identifying and referencing the specific market segment covered.
12. How do I determine which pricing option suits my needs best?
The pricing options vary based on user requirements and access needs. Individual users may opt for single-user licenses, while businesses requiring broader access may choose multi-user or enterprise licenses for cost-effective access to the report.
13. Are there any additional resources or data provided in the Non Electric Kitchen Appliance report?
While the report offers comprehensive insights, it's advisable to review the specific contents or supplementary materials provided to ascertain if additional resources or data are available.
14. How can I stay updated on further developments or reports in the Non Electric Kitchen Appliance?
To stay informed about further developments, trends, and reports in the Non Electric Kitchen Appliance, consider subscribing to industry newsletters, following relevant companies and organizations, or regularly checking reputable industry news sources and publications.
Methodology
Step 1 - Identification of Relevant Samples Size from Population Database


Step 2 - Approaches for Defining Global Market Size (Value, Volume* & Price*)

Note*: In applicable scenarios
Step 3 - Data Sources
Primary Research
- Web Analytics
- Survey Reports
- Research Institute
- Latest Research Reports
- Opinion Leaders
Secondary Research
- Annual Reports
- White Paper
- Latest Press Release
- Industry Association
- Paid Database
- Investor Presentations

Step 4 - Data Triangulation
Involves using different sources of information in order to increase the validity of a study
These sources are likely to be stakeholders in a program - participants, other researchers, program staff, other community members, and so on.
Then we put all data in single framework & apply various statistical tools to find out the dynamic on the market.
During the analysis stage, feedback from the stakeholder groups would be compared to determine areas of agreement as well as areas of divergence