

Key Insights
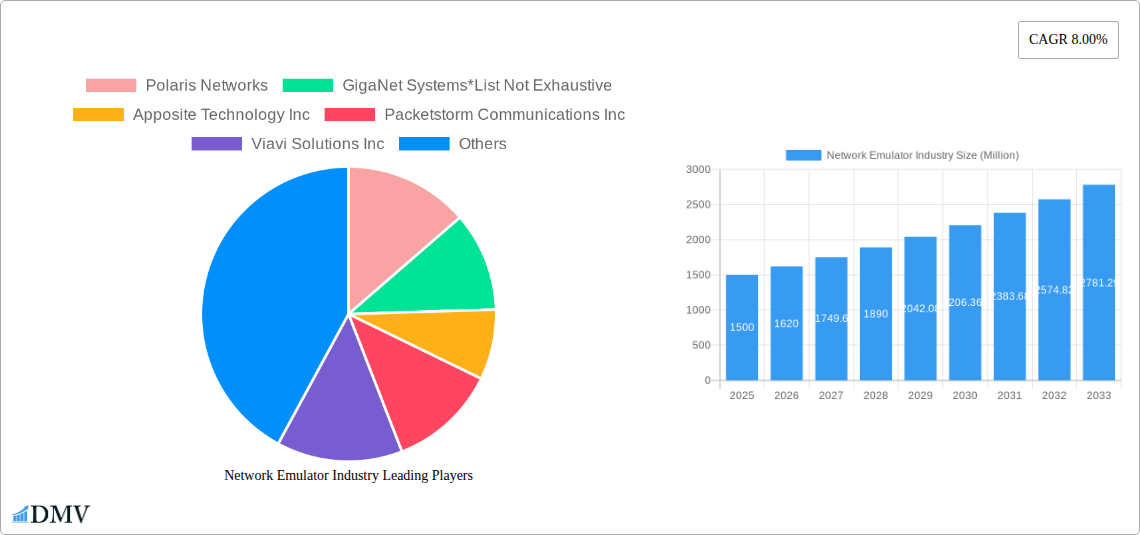
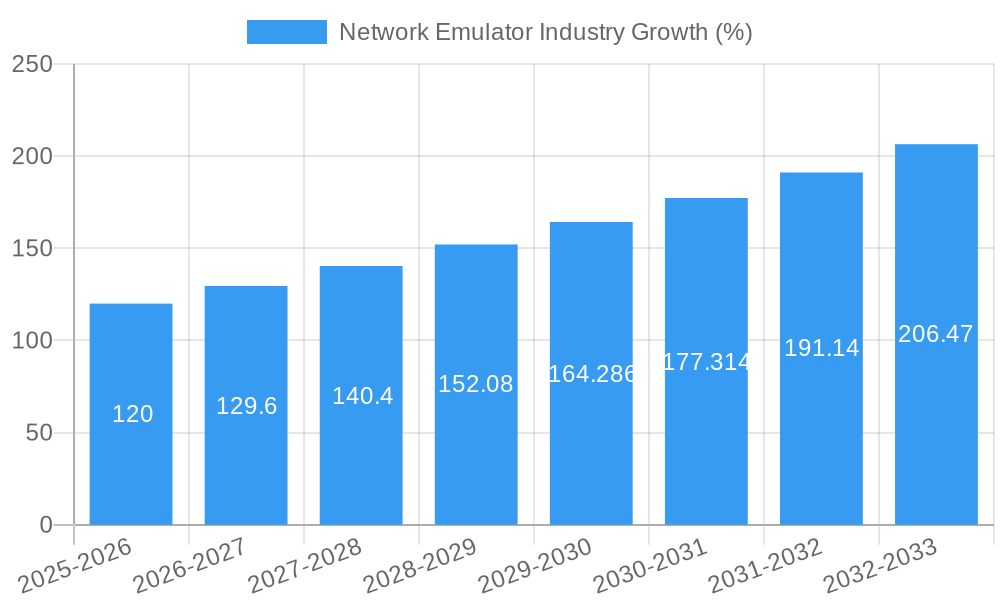
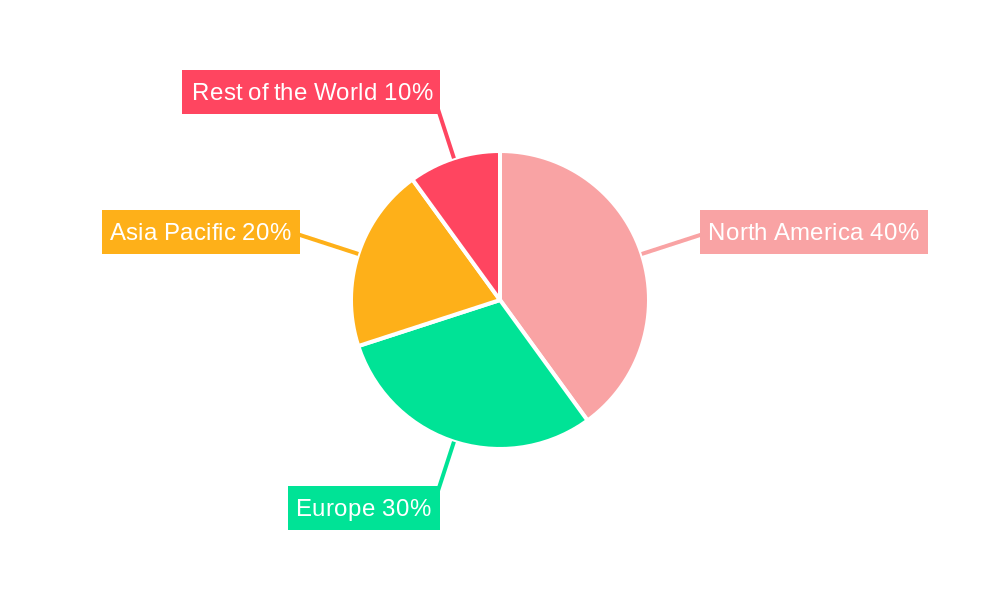
The Network Emulator market is experiencing robust growth, driven by the increasing demand for advanced network testing and simulation capabilities across various sectors. The market, valued at approximately $1.5 billion in 2025, is projected to exhibit a Compound Annual Growth Rate (CAGR) of 8% from 2025 to 2033, reaching an estimated value exceeding $2.8 billion by 2033. This growth is fueled by several key factors. The expanding adoption of 5G and other advanced network technologies necessitates rigorous testing and simulation to ensure seamless deployment and optimal performance. Furthermore, the rising complexity of network architectures and the growing need for efficient network security testing are significantly contributing to market expansion. The Telecommunication sector currently dominates the end-user vertical, followed by the Defense industry, with other sectors, such as automotive and finance, exhibiting increasing adoption. The market is segmented into hardware and software components, each playing a crucial role in the overall network emulation process. Hardware components, including specialized network emulation devices, form the foundation of the system, while software components provide the necessary control, monitoring, and analysis tools. The competitive landscape is characterized by a mix of established players like Keysight Technologies and Viavi Solutions, alongside emerging companies offering innovative solutions. Geographic expansion is also a key driver, with North America and Europe currently holding significant market share, but the Asia-Pacific region is poised for rapid growth due to increasing investment in advanced network infrastructure.
The ongoing digital transformation across industries is fueling the demand for sophisticated network emulation solutions. Enterprises are increasingly relying on network emulators to optimize network performance, reduce deployment risks, and accelerate innovation. The market's growth trajectory is influenced by technological advancements, such as the development of more realistic and scalable emulation models capable of replicating complex real-world network scenarios. However, the high cost of implementing and maintaining network emulation systems and the need for specialized technical expertise can act as potential restraints. To overcome these challenges, vendors are focusing on developing user-friendly interfaces and offering cloud-based solutions to enhance accessibility and reduce overall costs. Furthermore, strategic partnerships and collaborations are becoming increasingly crucial to expand market reach and offer comprehensive solutions.
Network Emulator Industry Market Report: 2019-2033 Forecast
This comprehensive report provides an in-depth analysis of the Network Emulator industry, offering invaluable insights for stakeholders seeking to navigate this dynamic market. With a meticulous study period spanning 2019-2033, a base year of 2025, and a forecast period extending to 2033, this report delivers a robust understanding of historical trends, current market dynamics, and future growth projections. The total market size is estimated at $XX Million in 2025 and is projected to reach $XX Million by 2033.
Network Emulator Industry Market Composition & Trends
This section evaluates the competitive landscape, technological advancements, regulatory influences, and market dynamics within the Network Emulator industry. The global market is characterized by a moderately concentrated structure, with key players such as Viavi Solutions Inc, Spirent Communications Inc, and Keysight Technologies Inc holding significant market share. However, the presence of numerous smaller players fosters healthy competition.
- Market Share Distribution (2025): Viavi Solutions Inc (XX%), Spirent Communications Inc (XX%), Keysight Technologies Inc (XX%), Others (XX%). M&A activity has been moderate, with total deal values exceeding $XX Million in the past five years. Notable transactions include [Insert details of any significant M&A activity if available, otherwise replace with "No major M&A events reported."].
- Innovation Catalysts: Increased demand for 5G network testing, the rise of software-defined networking (SDN), and the growing adoption of network virtualization are driving innovation within the industry.
- Regulatory Landscape: Government regulations related to network security and interoperability influence market growth and product development. Variations in regulatory frameworks across different regions lead to varied adoption rates.
- Substitute Products: While dedicated network emulators remain the primary solution, software-based solutions and cloud-based testing platforms pose some level of competitive threat.
- End-User Profiles: The industry serves diverse end-users, predominantly Telecommunication companies, followed by the Defense sector and other vertical markets, including education and research.
Network Emulator Industry Evolution
The Network Emulator industry has witnessed significant growth throughout the historical period (2019-2024), driven by the expanding adoption of advanced technologies such as 5G and SDN. The Compound Annual Growth Rate (CAGR) during this period is estimated at XX%. Technological advancements, such as the integration of Artificial Intelligence (AI) and Machine Learning (ML) for more efficient network simulation and analysis, are further fueling market growth. Consumer demand is shifting towards more sophisticated and integrated solutions that offer improved scalability, performance, and ease of use. The forecast period (2025-2033) is expected to see continued growth, albeit at a slightly moderated CAGR of XX%, primarily driven by the increasing demand for network testing and optimization across various sectors and the ongoing development and adoption of 6G technologies. This growth will also be impacted by the evolution of cloud-based network emulation solutions.
Leading Regions, Countries, or Segments in Network Emulator Industry
North America currently dominates the Network Emulator market, driven by robust investment in technological infrastructure and a strong presence of key players.
- Key Drivers for North American Dominance:
- High levels of R&D investment in telecommunication technologies.
- Stringent regulatory standards encouraging network testing and optimization.
- Early adoption of 5G and SDN technologies.
- Hardware Segment: This segment currently holds the largest market share due to the need for high-performance equipment for accurate network emulation. Growth is projected to continue, although at a slower pace than the software segment.
- Telecommunication Vertical: This segment represents the largest end-user vertical, driven by the need for rigorous testing and validation of network infrastructure before deployment.
- Other End-user Verticals: Growth in other sectors, such as defense and automotive, is projected to be significant, driven by increasing demands for secure and reliable network infrastructure.
Network Emulator Industry Product Innovations
Recent product innovations focus on increased automation, improved scalability, and integration with advanced analytics tools. This includes the development of emulators capable of simulating complex 5G and SDN environments, along with integrated dashboards that provide real-time insights into network performance. Unique selling propositions are focused on improved accuracy, reduced testing time, and cost-effective solutions.
Propelling Factors for Network Emulator Industry Growth
The growth of the network emulator industry is primarily propelled by the need for robust network testing and optimization, particularly in the context of 5G deployment and the expanding adoption of SDN and NFV technologies. Increasing government spending on defense and cybersecurity initiatives also contributes to market growth. Moreover, the growing adoption of cloud-based solutions is streamlining network testing processes and improving accessibility for various industry verticals.
Obstacles in the Network Emulator Industry Market
Key obstacles include the high cost of advanced network emulators, the complexity of integrating them into existing testing workflows, and the need for skilled personnel to operate and maintain the equipment. Supply chain disruptions, particularly in the procurement of specialized hardware components, can also impact market growth. Additionally, the emergence of competitive software-based solutions presents challenges to established players.
Future Opportunities in Network Emulator Industry
Future opportunities lie in the expansion into emerging markets, particularly in developing economies, as well as in the development of emulators specifically designed for testing emerging technologies such as 6G and IoT networks. The integration of AI and ML into network emulators to automate testing processes and provide predictive analytics will open new avenues for growth. Furthermore, the development of cloud-based, subscription-based models offers significant potential for market expansion.
Major Players in the Network Emulator Industry Ecosystem
- Polaris Networks
- GigaNet Systems
- Apposite Technology Inc
- Packetstorm Communications Inc
- Viavi Solutions Inc
- Spirent Communications Inc
- Keysight Technologies Inc
- Aukua Systems Inc
- iTrinegy
- InterWorking Labs
Key Developments in Network Emulator Industry Industry
- 2022-Q4: Viavi Solutions Inc launches a new series of 5G network emulators.
- 2023-Q1: Spirent Communications Inc acquires a smaller competitor, expanding its market share.
- 2023-Q3: Keysight Technologies Inc introduces an AI-powered network emulator. [Add more specific developments with dates as they become available]
Strategic Network Emulator Industry Market Forecast
The Network Emulator market is poised for significant growth over the forecast period (2025-2033), fueled by the continued expansion of 5G and the adoption of new technologies like 6G. The increasing demand for network optimization and security across diverse verticals presents substantial opportunities for market expansion. The shift towards cloud-based solutions and the integration of AI and ML will further propel market growth. This robust outlook makes the Network Emulator market an attractive prospect for investors and industry participants alike.
Network Emulator Industry Segmentation
-
1. Component
- 1.1. Hardware
- 1.2. Software
-
2. End-user Vertical
- 2.1. Telecommunication
- 2.2. Defense
- 2.3. Other End-user Verticals
Network Emulator Industry Segmentation By Geography
- 1. North America
- 2. Europe
- 3. Asia Pacific
- 4. Rest of the World
Network Emulator Industry REPORT HIGHLIGHTS
| Aspects | Details |
|---|---|
| Study Period | 2019-2033 |
| Base Year | 2024 |
| Estimated Year | 2025 |
| Forecast Period | 2025-2033 |
| Historical Period | 2019-2024 |
| Growth Rate | CAGR of 8.00% from 2019-2033 |
| Segmentation |
|
Table of Contents
- 1. Introduction
- 1.1. Research Scope
- 1.2. Market Segmentation
- 1.3. Research Methodology
- 1.4. Definitions and Assumptions
- 2. Executive Summary
- 2.1. Introduction
- 3. Market Dynamics
- 3.1. Introduction
- 3.2. Market Drivers
- 3.2.1. ; Advancements and Growth in 5G Testing
- 3.3. Market Restrains
- 3.3.1 ; RF Design
- 3.3.2 Flexibility and Size Issues of the Equipment; Evolving RF Standards
- 3.4. Market Trends
- 3.4.1. Telecommunication Vertical is Expected to Show a Significant Growth Over the Forecast period
- 4. Market Factor Analysis
- 4.1. Porters Five Forces
- 4.2. Supply/Value Chain
- 4.3. PESTEL analysis
- 4.4. Market Entropy
- 4.5. Patent/Trademark Analysis
- 5. Global Network Emulator Industry Analysis, Insights and Forecast, 2019-2031
- 5.1. Market Analysis, Insights and Forecast - by Component
- 5.1.1. Hardware
- 5.1.2. Software
- 5.2. Market Analysis, Insights and Forecast - by End-user Vertical
- 5.2.1. Telecommunication
- 5.2.2. Defense
- 5.2.3. Other End-user Verticals
- 5.3. Market Analysis, Insights and Forecast - by Region
- 5.3.1. North America
- 5.3.2. Europe
- 5.3.3. Asia Pacific
- 5.3.4. Rest of the World
- 5.1. Market Analysis, Insights and Forecast - by Component
- 6. North America Network Emulator Industry Analysis, Insights and Forecast, 2019-2031
- 6.1. Market Analysis, Insights and Forecast - by Component
- 6.1.1. Hardware
- 6.1.2. Software
- 6.2. Market Analysis, Insights and Forecast - by End-user Vertical
- 6.2.1. Telecommunication
- 6.2.2. Defense
- 6.2.3. Other End-user Verticals
- 6.1. Market Analysis, Insights and Forecast - by Component
- 7. Europe Network Emulator Industry Analysis, Insights and Forecast, 2019-2031
- 7.1. Market Analysis, Insights and Forecast - by Component
- 7.1.1. Hardware
- 7.1.2. Software
- 7.2. Market Analysis, Insights and Forecast - by End-user Vertical
- 7.2.1. Telecommunication
- 7.2.2. Defense
- 7.2.3. Other End-user Verticals
- 7.1. Market Analysis, Insights and Forecast - by Component
- 8. Asia Pacific Network Emulator Industry Analysis, Insights and Forecast, 2019-2031
- 8.1. Market Analysis, Insights and Forecast - by Component
- 8.1.1. Hardware
- 8.1.2. Software
- 8.2. Market Analysis, Insights and Forecast - by End-user Vertical
- 8.2.1. Telecommunication
- 8.2.2. Defense
- 8.2.3. Other End-user Verticals
- 8.1. Market Analysis, Insights and Forecast - by Component
- 9. Rest of the World Network Emulator Industry Analysis, Insights and Forecast, 2019-2031
- 9.1. Market Analysis, Insights and Forecast - by Component
- 9.1.1. Hardware
- 9.1.2. Software
- 9.2. Market Analysis, Insights and Forecast - by End-user Vertical
- 9.2.1. Telecommunication
- 9.2.2. Defense
- 9.2.3. Other End-user Verticals
- 9.1. Market Analysis, Insights and Forecast - by Component
- 10. North America Network Emulator Industry Analysis, Insights and Forecast, 2019-2031
- 10.1. Market Analysis, Insights and Forecast - By Country/Sub-region
- 10.1.1.
- 11. Europe Network Emulator Industry Analysis, Insights and Forecast, 2019-2031
- 11.1. Market Analysis, Insights and Forecast - By Country/Sub-region
- 11.1.1.
- 12. Asia Pacific Network Emulator Industry Analysis, Insights and Forecast, 2019-2031
- 12.1. Market Analysis, Insights and Forecast - By Country/Sub-region
- 12.1.1.
- 13. Rest of the World Network Emulator Industry Analysis, Insights and Forecast, 2019-2031
- 13.1. Market Analysis, Insights and Forecast - By Country/Sub-region
- 13.1.1.
- 14. Competitive Analysis
- 14.1. Global Market Share Analysis 2024
- 14.2. Company Profiles
- 14.2.1 Polaris Networks
- 14.2.1.1. Overview
- 14.2.1.2. Products
- 14.2.1.3. SWOT Analysis
- 14.2.1.4. Recent Developments
- 14.2.1.5. Financials (Based on Availability)
- 14.2.2 GigaNet Systems*List Not Exhaustive
- 14.2.2.1. Overview
- 14.2.2.2. Products
- 14.2.2.3. SWOT Analysis
- 14.2.2.4. Recent Developments
- 14.2.2.5. Financials (Based on Availability)
- 14.2.3 Apposite Technology Inc
- 14.2.3.1. Overview
- 14.2.3.2. Products
- 14.2.3.3. SWOT Analysis
- 14.2.3.4. Recent Developments
- 14.2.3.5. Financials (Based on Availability)
- 14.2.4 Packetstorm Communications Inc
- 14.2.4.1. Overview
- 14.2.4.2. Products
- 14.2.4.3. SWOT Analysis
- 14.2.4.4. Recent Developments
- 14.2.4.5. Financials (Based on Availability)
- 14.2.5 Viavi Solutions Inc
- 14.2.5.1. Overview
- 14.2.5.2. Products
- 14.2.5.3. SWOT Analysis
- 14.2.5.4. Recent Developments
- 14.2.5.5. Financials (Based on Availability)
- 14.2.6 Spirent Communications Inc
- 14.2.6.1. Overview
- 14.2.6.2. Products
- 14.2.6.3. SWOT Analysis
- 14.2.6.4. Recent Developments
- 14.2.6.5. Financials (Based on Availability)
- 14.2.7 Keysight Technologies Inc
- 14.2.7.1. Overview
- 14.2.7.2. Products
- 14.2.7.3. SWOT Analysis
- 14.2.7.4. Recent Developments
- 14.2.7.5. Financials (Based on Availability)
- 14.2.8 Aukua Systems Inc
- 14.2.8.1. Overview
- 14.2.8.2. Products
- 14.2.8.3. SWOT Analysis
- 14.2.8.4. Recent Developments
- 14.2.8.5. Financials (Based on Availability)
- 14.2.9 iTrinegy
- 14.2.9.1. Overview
- 14.2.9.2. Products
- 14.2.9.3. SWOT Analysis
- 14.2.9.4. Recent Developments
- 14.2.9.5. Financials (Based on Availability)
- 14.2.10 InterWorking Labs
- 14.2.10.1. Overview
- 14.2.10.2. Products
- 14.2.10.3. SWOT Analysis
- 14.2.10.4. Recent Developments
- 14.2.10.5. Financials (Based on Availability)
- 14.2.1 Polaris Networks
List of Figures
- Figure 1: Global Network Emulator Industry Revenue Breakdown (Million, %) by Region 2024 & 2032
- Figure 2: North America Network Emulator Industry Revenue (Million), by Country 2024 & 2032
- Figure 3: North America Network Emulator Industry Revenue Share (%), by Country 2024 & 2032
- Figure 4: Europe Network Emulator Industry Revenue (Million), by Country 2024 & 2032
- Figure 5: Europe Network Emulator Industry Revenue Share (%), by Country 2024 & 2032
- Figure 6: Asia Pacific Network Emulator Industry Revenue (Million), by Country 2024 & 2032
- Figure 7: Asia Pacific Network Emulator Industry Revenue Share (%), by Country 2024 & 2032
- Figure 8: Rest of the World Network Emulator Industry Revenue (Million), by Country 2024 & 2032
- Figure 9: Rest of the World Network Emulator Industry Revenue Share (%), by Country 2024 & 2032
- Figure 10: North America Network Emulator Industry Revenue (Million), by Component 2024 & 2032
- Figure 11: North America Network Emulator Industry Revenue Share (%), by Component 2024 & 2032
- Figure 12: North America Network Emulator Industry Revenue (Million), by End-user Vertical 2024 & 2032
- Figure 13: North America Network Emulator Industry Revenue Share (%), by End-user Vertical 2024 & 2032
- Figure 14: North America Network Emulator Industry Revenue (Million), by Country 2024 & 2032
- Figure 15: North America Network Emulator Industry Revenue Share (%), by Country 2024 & 2032
- Figure 16: Europe Network Emulator Industry Revenue (Million), by Component 2024 & 2032
- Figure 17: Europe Network Emulator Industry Revenue Share (%), by Component 2024 & 2032
- Figure 18: Europe Network Emulator Industry Revenue (Million), by End-user Vertical 2024 & 2032
- Figure 19: Europe Network Emulator Industry Revenue Share (%), by End-user Vertical 2024 & 2032
- Figure 20: Europe Network Emulator Industry Revenue (Million), by Country 2024 & 2032
- Figure 21: Europe Network Emulator Industry Revenue Share (%), by Country 2024 & 2032
- Figure 22: Asia Pacific Network Emulator Industry Revenue (Million), by Component 2024 & 2032
- Figure 23: Asia Pacific Network Emulator Industry Revenue Share (%), by Component 2024 & 2032
- Figure 24: Asia Pacific Network Emulator Industry Revenue (Million), by End-user Vertical 2024 & 2032
- Figure 25: Asia Pacific Network Emulator Industry Revenue Share (%), by End-user Vertical 2024 & 2032
- Figure 26: Asia Pacific Network Emulator Industry Revenue (Million), by Country 2024 & 2032
- Figure 27: Asia Pacific Network Emulator Industry Revenue Share (%), by Country 2024 & 2032
- Figure 28: Rest of the World Network Emulator Industry Revenue (Million), by Component 2024 & 2032
- Figure 29: Rest of the World Network Emulator Industry Revenue Share (%), by Component 2024 & 2032
- Figure 30: Rest of the World Network Emulator Industry Revenue (Million), by End-user Vertical 2024 & 2032
- Figure 31: Rest of the World Network Emulator Industry Revenue Share (%), by End-user Vertical 2024 & 2032
- Figure 32: Rest of the World Network Emulator Industry Revenue (Million), by Country 2024 & 2032
- Figure 33: Rest of the World Network Emulator Industry Revenue Share (%), by Country 2024 & 2032
List of Tables
- Table 1: Global Network Emulator Industry Revenue Million Forecast, by Region 2019 & 2032
- Table 2: Global Network Emulator Industry Revenue Million Forecast, by Component 2019 & 2032
- Table 3: Global Network Emulator Industry Revenue Million Forecast, by End-user Vertical 2019 & 2032
- Table 4: Global Network Emulator Industry Revenue Million Forecast, by Region 2019 & 2032
- Table 5: Global Network Emulator Industry Revenue Million Forecast, by Country 2019 & 2032
- Table 6: Network Emulator Industry Revenue (Million) Forecast, by Application 2019 & 2032
- Table 7: Global Network Emulator Industry Revenue Million Forecast, by Country 2019 & 2032
- Table 8: Network Emulator Industry Revenue (Million) Forecast, by Application 2019 & 2032
- Table 9: Global Network Emulator Industry Revenue Million Forecast, by Country 2019 & 2032
- Table 10: Network Emulator Industry Revenue (Million) Forecast, by Application 2019 & 2032
- Table 11: Global Network Emulator Industry Revenue Million Forecast, by Country 2019 & 2032
- Table 12: Network Emulator Industry Revenue (Million) Forecast, by Application 2019 & 2032
- Table 13: Global Network Emulator Industry Revenue Million Forecast, by Component 2019 & 2032
- Table 14: Global Network Emulator Industry Revenue Million Forecast, by End-user Vertical 2019 & 2032
- Table 15: Global Network Emulator Industry Revenue Million Forecast, by Country 2019 & 2032
- Table 16: Global Network Emulator Industry Revenue Million Forecast, by Component 2019 & 2032
- Table 17: Global Network Emulator Industry Revenue Million Forecast, by End-user Vertical 2019 & 2032
- Table 18: Global Network Emulator Industry Revenue Million Forecast, by Country 2019 & 2032
- Table 19: Global Network Emulator Industry Revenue Million Forecast, by Component 2019 & 2032
- Table 20: Global Network Emulator Industry Revenue Million Forecast, by End-user Vertical 2019 & 2032
- Table 21: Global Network Emulator Industry Revenue Million Forecast, by Country 2019 & 2032
- Table 22: Global Network Emulator Industry Revenue Million Forecast, by Component 2019 & 2032
- Table 23: Global Network Emulator Industry Revenue Million Forecast, by End-user Vertical 2019 & 2032
- Table 24: Global Network Emulator Industry Revenue Million Forecast, by Country 2019 & 2032
Frequently Asked Questions
1. What is the projected Compound Annual Growth Rate (CAGR) of the Network Emulator Industry?
The projected CAGR is approximately 8.00%.
2. Which companies are prominent players in the Network Emulator Industry?
Key companies in the market include Polaris Networks, GigaNet Systems*List Not Exhaustive, Apposite Technology Inc, Packetstorm Communications Inc, Viavi Solutions Inc, Spirent Communications Inc, Keysight Technologies Inc, Aukua Systems Inc, iTrinegy, InterWorking Labs.
3. What are the main segments of the Network Emulator Industry?
The market segments include Component, End-user Vertical.
4. Can you provide details about the market size?
The market size is estimated to be USD XX Million as of 2022.
5. What are some drivers contributing to market growth?
; Advancements and Growth in 5G Testing.
6. What are the notable trends driving market growth?
Telecommunication Vertical is Expected to Show a Significant Growth Over the Forecast period.
7. Are there any restraints impacting market growth?
; RF Design. Flexibility and Size Issues of the Equipment; Evolving RF Standards.
8. Can you provide examples of recent developments in the market?
N/A
9. What pricing options are available for accessing the report?
Pricing options include single-user, multi-user, and enterprise licenses priced at USD 4750, USD 5250, and USD 8750 respectively.
10. Is the market size provided in terms of value or volume?
The market size is provided in terms of value, measured in Million.
11. Are there any specific market keywords associated with the report?
Yes, the market keyword associated with the report is "Network Emulator Industry," which aids in identifying and referencing the specific market segment covered.
12. How do I determine which pricing option suits my needs best?
The pricing options vary based on user requirements and access needs. Individual users may opt for single-user licenses, while businesses requiring broader access may choose multi-user or enterprise licenses for cost-effective access to the report.
13. Are there any additional resources or data provided in the Network Emulator Industry report?
While the report offers comprehensive insights, it's advisable to review the specific contents or supplementary materials provided to ascertain if additional resources or data are available.
14. How can I stay updated on further developments or reports in the Network Emulator Industry?
To stay informed about further developments, trends, and reports in the Network Emulator Industry, consider subscribing to industry newsletters, following relevant companies and organizations, or regularly checking reputable industry news sources and publications.
Methodology
Step 1 - Identification of Relevant Samples Size from Population Database


Step 2 - Approaches for Defining Global Market Size (Value, Volume* & Price*)

Note*: In applicable scenarios
Step 3 - Data Sources
Primary Research
- Web Analytics
- Survey Reports
- Research Institute
- Latest Research Reports
- Opinion Leaders
Secondary Research
- Annual Reports
- White Paper
- Latest Press Release
- Industry Association
- Paid Database
- Investor Presentations

Step 4 - Data Triangulation
Involves using different sources of information in order to increase the validity of a study
These sources are likely to be stakeholders in a program - participants, other researchers, program staff, other community members, and so on.
Then we put all data in single framework & apply various statistical tools to find out the dynamic on the market.
During the analysis stage, feedback from the stakeholder groups would be compared to determine areas of agreement as well as areas of divergence
