

Key Insights
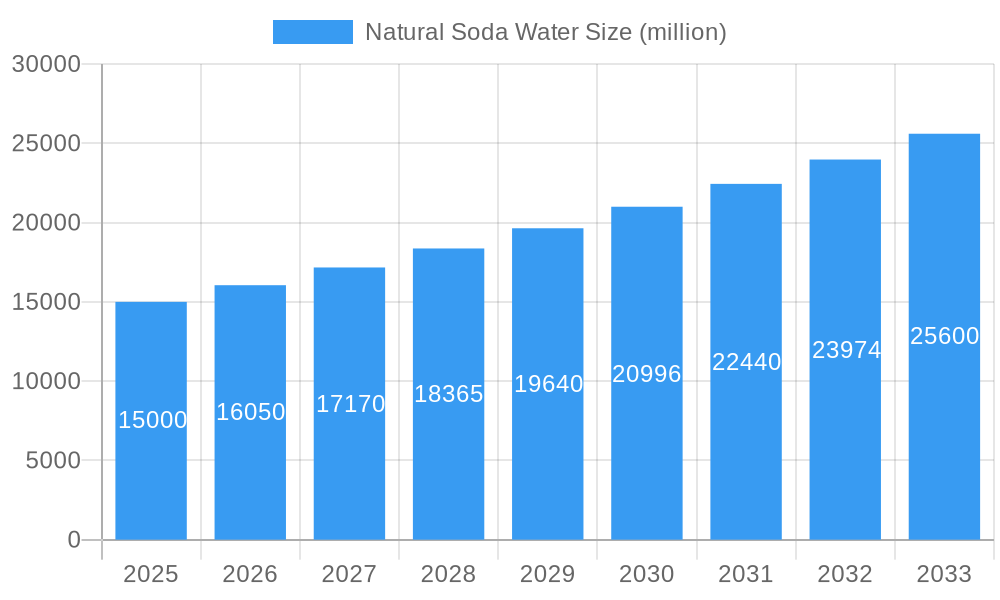
The global natural soda water market is experiencing robust growth, driven by increasing health consciousness among consumers and a shift towards healthier beverage alternatives. The market, estimated at $15 billion in 2025, is projected to maintain a healthy Compound Annual Growth Rate (CAGR) of 7% from 2025 to 2033, reaching approximately $28 billion by 2033. This expansion is fueled by several key factors. The rising prevalence of lifestyle diseases linked to sugary drinks is encouraging consumers to opt for healthier alternatives, with natural soda water emerging as a preferred choice due to its zero-calorie and zero-sugar profile. Furthermore, the growing popularity of sparkling water as a mixer for alcoholic and non-alcoholic beverages is significantly boosting market demand. Innovation in flavors and packaging, such as the introduction of infused natural soda water with fruit extracts and functional ingredients, is also driving market growth. Major players like Shudayuan, Shuiyifang, Lava-spring, N47°, Huiyuan, Alps, Fssoda, and ELECTROX are actively contributing to this growth through strategic marketing, product diversification, and expansion into new markets.
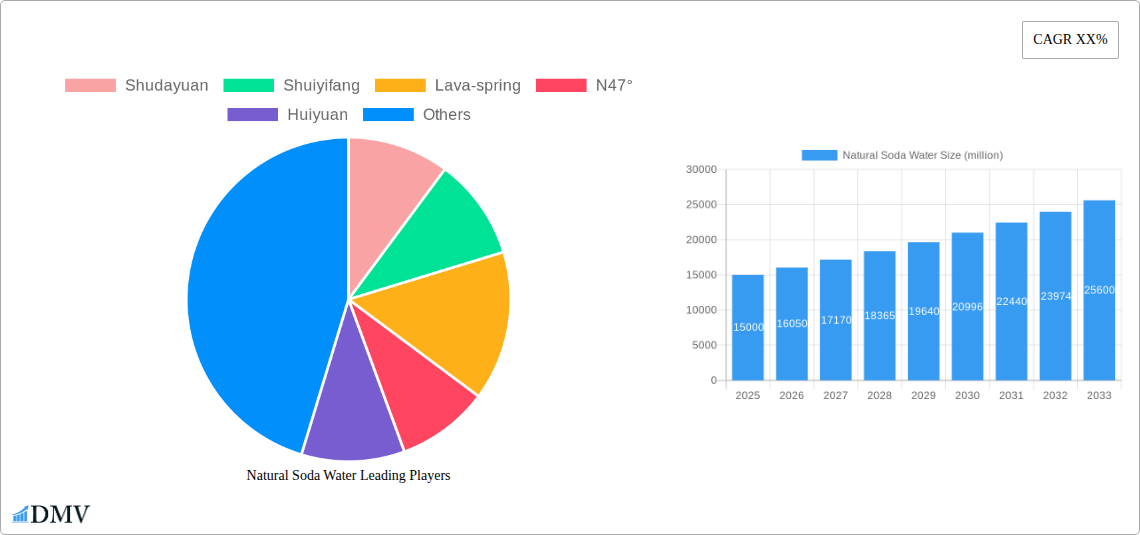
Natural Soda Water Market Size (In Billion)
However, the market faces certain challenges. Fluctuations in raw material prices, particularly for natural flavorings and packaging materials, can impact profitability. Furthermore, intense competition from other healthier beverage options, such as flavored water and herbal teas, presents a significant restraint. Successful companies will need to focus on sustainable sourcing, environmentally friendly packaging, and targeted marketing campaigns to differentiate themselves and capture a larger market share. Regional variations in consumer preferences and regulatory landscapes also require strategic adaptation for optimal market penetration. The forecast period (2025-2033) suggests continued growth, with North America and Europe expected to remain leading markets, although Asia-Pacific is projected to experience significant expansion, driven by rising disposable incomes and changing lifestyle preferences.
Natural Soda Water Company Market Share
Natural Soda Water Market Report: A Comprehensive Analysis (2019-2033)
This insightful report provides a comprehensive analysis of the global natural soda water market, offering a detailed examination of market dynamics, key players, and future growth prospects. With a study period spanning 2019-2033, a base year of 2025, and a forecast period of 2025-2033, this report is an invaluable resource for stakeholders seeking to understand and capitalize on opportunities within this burgeoning market. The market size in 2025 is estimated at $XX million, projected to reach $XX million by 2033.
Natural Soda Water Market Composition & Trends
This section delves into the competitive landscape of the natural soda water market, analyzing market concentration, innovation drivers, regulatory frameworks, substitute products, end-user preferences, and merger & acquisition (M&A) activities. We examine the market share distribution among key players, revealing the dominance of specific brands and their strategic maneuvers. M&A activities within the sector are also scrutinized, with an analysis of deal values and their impact on market consolidation. The report further explores the influence of regulatory changes on market growth, the competitive threat posed by substitute beverages, and evolving consumer preferences driving product innovation.
- Market Concentration: The market is characterized by [describe concentration level - e.g., high/low/moderate] concentration, with the top 5 players holding approximately XX% of the market share in 2024.
- Innovation Catalysts: Growing consumer demand for healthier alternatives and increasing awareness of the negative health effects of sugary drinks are driving innovation in flavor profiles, packaging, and functional ingredients.
- Regulatory Landscape: Stringent regulations regarding labeling and health claims are influencing product formulations and marketing strategies. Variations in regulations across different regions present both opportunities and challenges.
- Substitute Products: Competition comes from other sparkling beverages like flavored sparkling water, carbonated juices, and even traditional sodas.
- End-User Profiles: The target market spans a wide demographic, encompassing health-conscious individuals, millennials, and those seeking healthier alternatives to sugary drinks.
- M&A Activities: During the historical period (2019-2024), approximately XX M&A deals were recorded, with a total value of approximately $XX million, indicating a consolidating market.
Natural Soda Water Industry Evolution
This section traces the evolution of the natural soda water industry, examining market growth trajectories, technological advancements, and shifts in consumer demand. We analyze historical growth rates, projecting future trends based on current market dynamics and anticipated technological breakthroughs. Data points on adoption rates of new technologies and shifts in consumer preferences, like the increasing demand for organic and sustainably sourced products, are presented.
[Insert 600 words detailing market growth trajectories (including specific data points like growth rates and adoption metrics), technological advancements (e.g., improved carbonation techniques, eco-friendly packaging), and shifting consumer demands (e.g., preference for specific flavors, health benefits, sustainability considerations) within the natural soda water industry. Use past data and project future trends.]
Leading Regions, Countries, or Segments in Natural Soda Water
This section identifies the leading regions, countries, or segments within the natural soda water market. It analyzes the factors contributing to their dominance, such as investment trends, regulatory support, and consumer preferences. This includes a detailed assessment of market size and growth potential for each dominant area.
[Insert 600 words analyzing the leading region/country/segment. Use bullet points for key drivers and paragraphs for in-depth analysis. Examples of key drivers could include high per capita income, strong government support, or favorable regulatory environment. The analysis should explain why this region/country/segment is dominant.]
Natural Soda Water Product Innovations
Recent years have witnessed significant product innovations in the natural soda water sector. This involves the introduction of novel flavors, functional ingredients, and sustainable packaging solutions. Companies are focusing on unique selling propositions, emphasizing natural ingredients, health benefits, and eco-friendly practices to differentiate themselves in a competitive market. Advances in carbonation technology contribute to enhanced product quality and shelf life.
[Insert 100-150 words detailing product innovations, applications, and performance metrics. Highlight unique selling propositions and technological advancements.]
Propelling Factors for Natural Soda Water Growth
Several factors contribute to the growth of the natural soda water market. The increasing health consciousness among consumers, coupled with a rising preference for healthier beverage options, fuels market expansion. Technological advancements in production and packaging enhance efficiency and sustainability. Favorable government regulations and subsidies also stimulate market growth.
[Insert 150 words identifying key growth drivers (technological, economic, and regulatory influences) with specific examples.]
Obstacles in the Natural Soda Water Market
Despite its growth potential, the natural soda water market faces various challenges. Regulatory hurdles, particularly concerning labeling and health claims, can hinder market expansion. Fluctuations in raw material costs and supply chain disruptions impact production and pricing. Intense competition from established and emerging players poses a significant challenge.
[Insert 150 words discussing barriers and restraints, including quantifiable impacts.]
Future Opportunities in Natural Soda Water
The natural soda water market presents numerous future opportunities. The untapped potential in emerging markets presents significant growth prospects. Further innovation in flavors, functional ingredients, and packaging opens avenues for product diversification. Growing consumer demand for sustainable and ethical products creates opportunities for companies that prioritize eco-friendly practices.
[Insert 150 words highlighting emerging opportunities.]
Major Players in the Natural Soda Water Ecosystem
- Shudayuan (If a global link exists, replace with that)
- Shuiyifang
- Lava-spring
- N47°
- Huiyuan
- Alps
- Fssoda
- ELECTROX
Key Developments in Natural Soda Water Industry
[Insert bullet points detailing key developments with year/month, emphasizing their impact on market dynamics (e.g., product launches, mergers, regulatory changes).]
Strategic Natural Soda Water Market Forecast
The natural soda water market is poised for robust growth in the coming years. Driven by increasing consumer preference for healthier beverages and ongoing product innovation, the market is expected to witness significant expansion. Emerging market penetration and sustained technological advancements will further contribute to market growth. The forecast period (2025-2033) promises significant opportunities for industry players.
[Insert 150 words summarizing growth catalysts and future market potential.]
Natural Soda Water Segmentation
-
1. Application
- 1.1. Online Sales
- 1.2. Offline Sales
-
2. Types
- 2.1. 380ml
- 2.2. 550ml
- 2.3. Others
Natural Soda Water Segmentation By Geography
-
1. North America
- 1.1. United States
- 1.2. Canada
- 1.3. Mexico
-
2. South America
- 2.1. Brazil
- 2.2. Argentina
- 2.3. Rest of South America
-
3. Europe
- 3.1. United Kingdom
- 3.2. Germany
- 3.3. France
- 3.4. Italy
- 3.5. Spain
- 3.6. Russia
- 3.7. Benelux
- 3.8. Nordics
- 3.9. Rest of Europe
-
4. Middle East & Africa
- 4.1. Turkey
- 4.2. Israel
- 4.3. GCC
- 4.4. North Africa
- 4.5. South Africa
- 4.6. Rest of Middle East & Africa
-
5. Asia Pacific
- 5.1. China
- 5.2. India
- 5.3. Japan
- 5.4. South Korea
- 5.5. ASEAN
- 5.6. Oceania
- 5.7. Rest of Asia Pacific

Natural Soda Water Regional Market Share
Geographic Coverage of Natural Soda Water
Natural Soda Water REPORT HIGHLIGHTS
| Aspects | Details |
|---|---|
| Study Period | 2020-2034 |
| Base Year | 2025 |
| Estimated Year | 2026 |
| Forecast Period | 2026-2034 |
| Historical Period | 2020-2025 |
| Growth Rate | CAGR of XX% from 2020-2034 |
| Segmentation |
|
Table of Contents
- 1. Introduction
- 1.1. Research Scope
- 1.2. Market Segmentation
- 1.3. Research Objective
- 1.4. Definitions and Assumptions
- 2. Executive Summary
- 2.1. Market Snapshot
- 3. Market Dynamics
- 3.1. Market Drivers
- 3.2. Market Restrains
- 3.3. Market Trends
- 3.4. Market Opportunities
- 4. Market Factor Analysis
- 4.1. Porters Five Forces
- 4.1.1. Bargaining Power of Suppliers
- 4.1.2. Bargaining Power of Buyers
- 4.1.3. Threat of New Entrants
- 4.1.4. Threat of Substitutes
- 4.1.5. Competitive Rivalry
- 4.2. PESTEL analysis
- 4.3. BCG Analysis
- 4.3.1. Stars (High Growth, High Market Share)
- 4.3.2. Cash Cows (Low Growth, High Market Share)
- 4.3.3. Question Mark (High Growth, Low Market Share)
- 4.3.4. Dogs (Low Growth, Low Market Share)
- 4.4. Ansoff Matrix Analysis
- 4.5. Supply Chain Analysis
- 4.6. Regulatory Landscape
- 4.7. Current Market Potential and Opportunity Assessment (TAM–SAM–SOM Framework)
- 4.8. DMV Analyst Note
- 4.1. Porters Five Forces
- 5. Market Analysis, Insights and Forecast 2021-2033
- 5.1. Market Analysis, Insights and Forecast - by Application
- 5.1.1. Online Sales
- 5.1.2. Offline Sales
- 5.2. Market Analysis, Insights and Forecast - by Types
- 5.2.1. 380ml
- 5.2.2. 550ml
- 5.2.3. Others
- 5.3. Market Analysis, Insights and Forecast - by Region
- 5.3.1. North America
- 5.3.2. South America
- 5.3.3. Europe
- 5.3.4. Middle East & Africa
- 5.3.5. Asia Pacific
- 5.1. Market Analysis, Insights and Forecast - by Application
- 6. Global Natural Soda Water Analysis, Insights and Forecast, 2021-2033
- 6.1. Market Analysis, Insights and Forecast - by Application
- 6.1.1. Online Sales
- 6.1.2. Offline Sales
- 6.2. Market Analysis, Insights and Forecast - by Types
- 6.2.1. 380ml
- 6.2.2. 550ml
- 6.2.3. Others
- 6.1. Market Analysis, Insights and Forecast - by Application
- 7. North America Natural Soda Water Analysis, Insights and Forecast, 2020-2032
- 7.1. Market Analysis, Insights and Forecast - by Application
- 7.1.1. Online Sales
- 7.1.2. Offline Sales
- 7.2. Market Analysis, Insights and Forecast - by Types
- 7.2.1. 380ml
- 7.2.2. 550ml
- 7.2.3. Others
- 7.1. Market Analysis, Insights and Forecast - by Application
- 8. South America Natural Soda Water Analysis, Insights and Forecast, 2020-2032
- 8.1. Market Analysis, Insights and Forecast - by Application
- 8.1.1. Online Sales
- 8.1.2. Offline Sales
- 8.2. Market Analysis, Insights and Forecast - by Types
- 8.2.1. 380ml
- 8.2.2. 550ml
- 8.2.3. Others
- 8.1. Market Analysis, Insights and Forecast - by Application
- 9. Europe Natural Soda Water Analysis, Insights and Forecast, 2020-2032
- 9.1. Market Analysis, Insights and Forecast - by Application
- 9.1.1. Online Sales
- 9.1.2. Offline Sales
- 9.2. Market Analysis, Insights and Forecast - by Types
- 9.2.1. 380ml
- 9.2.2. 550ml
- 9.2.3. Others
- 9.1. Market Analysis, Insights and Forecast - by Application
- 10. Middle East & Africa Natural Soda Water Analysis, Insights and Forecast, 2020-2032
- 10.1. Market Analysis, Insights and Forecast - by Application
- 10.1.1. Online Sales
- 10.1.2. Offline Sales
- 10.2. Market Analysis, Insights and Forecast - by Types
- 10.2.1. 380ml
- 10.2.2. 550ml
- 10.2.3. Others
- 10.1. Market Analysis, Insights and Forecast - by Application
- 11. Asia Pacific Natural Soda Water Analysis, Insights and Forecast, 2020-2032
- 11.1. Market Analysis, Insights and Forecast - by Application
- 11.1.1. Online Sales
- 11.1.2. Offline Sales
- 11.2. Market Analysis, Insights and Forecast - by Types
- 11.2.1. 380ml
- 11.2.2. 550ml
- 11.2.3. Others
- 11.1. Market Analysis, Insights and Forecast - by Application
- 12. Competitive Analysis
- 12.1. Company Profiles
- 12.1.1 Shudayuan
- 12.1.1.1. Company Overview
- 12.1.1.2. Products
- 12.1.1.3. Company Financials
- 12.1.1.4. SWOT Analysis
- 12.1.2 Shuiyifang
- 12.1.2.1. Company Overview
- 12.1.2.2. Products
- 12.1.2.3. Company Financials
- 12.1.2.4. SWOT Analysis
- 12.1.3 Lava-spring
- 12.1.3.1. Company Overview
- 12.1.3.2. Products
- 12.1.3.3. Company Financials
- 12.1.3.4. SWOT Analysis
- 12.1.4 N47°
- 12.1.4.1. Company Overview
- 12.1.4.2. Products
- 12.1.4.3. Company Financials
- 12.1.4.4. SWOT Analysis
- 12.1.5 Huiyuan
- 12.1.5.1. Company Overview
- 12.1.5.2. Products
- 12.1.5.3. Company Financials
- 12.1.5.4. SWOT Analysis
- 12.1.6 Alps
- 12.1.6.1. Company Overview
- 12.1.6.2. Products
- 12.1.6.3. Company Financials
- 12.1.6.4. SWOT Analysis
- 12.1.7 Fssoda
- 12.1.7.1. Company Overview
- 12.1.7.2. Products
- 12.1.7.3. Company Financials
- 12.1.7.4. SWOT Analysis
- 12.1.8 ELECTROX
- 12.1.8.1. Company Overview
- 12.1.8.2. Products
- 12.1.8.3. Company Financials
- 12.1.8.4. SWOT Analysis
- 12.1.1 Shudayuan
- 12.2. Market Entropy
- 12.2.1 Company's Key Areas Served
- 12.2.2 Recent Developments
- 12.3. Company Market Share Analysis 2025
- 12.3.1 Top 5 Companies Market Share Analysis
- 12.3.2 Top 3 Companies Market Share Analysis
- 12.4. List of Potential Customers
- 13. Research Methodology
List of Figures
- Figure 1: Global Natural Soda Water Revenue Breakdown (million, %) by Region 2025 & 2033
- Figure 2: North America Natural Soda Water Revenue (million), by Application 2025 & 2033
- Figure 3: North America Natural Soda Water Revenue Share (%), by Application 2025 & 2033
- Figure 4: North America Natural Soda Water Revenue (million), by Types 2025 & 2033
- Figure 5: North America Natural Soda Water Revenue Share (%), by Types 2025 & 2033
- Figure 6: North America Natural Soda Water Revenue (million), by Country 2025 & 2033
- Figure 7: North America Natural Soda Water Revenue Share (%), by Country 2025 & 2033
- Figure 8: South America Natural Soda Water Revenue (million), by Application 2025 & 2033
- Figure 9: South America Natural Soda Water Revenue Share (%), by Application 2025 & 2033
- Figure 10: South America Natural Soda Water Revenue (million), by Types 2025 & 2033
- Figure 11: South America Natural Soda Water Revenue Share (%), by Types 2025 & 2033
- Figure 12: South America Natural Soda Water Revenue (million), by Country 2025 & 2033
- Figure 13: South America Natural Soda Water Revenue Share (%), by Country 2025 & 2033
- Figure 14: Europe Natural Soda Water Revenue (million), by Application 2025 & 2033
- Figure 15: Europe Natural Soda Water Revenue Share (%), by Application 2025 & 2033
- Figure 16: Europe Natural Soda Water Revenue (million), by Types 2025 & 2033
- Figure 17: Europe Natural Soda Water Revenue Share (%), by Types 2025 & 2033
- Figure 18: Europe Natural Soda Water Revenue (million), by Country 2025 & 2033
- Figure 19: Europe Natural Soda Water Revenue Share (%), by Country 2025 & 2033
- Figure 20: Middle East & Africa Natural Soda Water Revenue (million), by Application 2025 & 2033
- Figure 21: Middle East & Africa Natural Soda Water Revenue Share (%), by Application 2025 & 2033
- Figure 22: Middle East & Africa Natural Soda Water Revenue (million), by Types 2025 & 2033
- Figure 23: Middle East & Africa Natural Soda Water Revenue Share (%), by Types 2025 & 2033
- Figure 24: Middle East & Africa Natural Soda Water Revenue (million), by Country 2025 & 2033
- Figure 25: Middle East & Africa Natural Soda Water Revenue Share (%), by Country 2025 & 2033
- Figure 26: Asia Pacific Natural Soda Water Revenue (million), by Application 2025 & 2033
- Figure 27: Asia Pacific Natural Soda Water Revenue Share (%), by Application 2025 & 2033
- Figure 28: Asia Pacific Natural Soda Water Revenue (million), by Types 2025 & 2033
- Figure 29: Asia Pacific Natural Soda Water Revenue Share (%), by Types 2025 & 2033
- Figure 30: Asia Pacific Natural Soda Water Revenue (million), by Country 2025 & 2033
- Figure 31: Asia Pacific Natural Soda Water Revenue Share (%), by Country 2025 & 2033
List of Tables
- Table 1: Global Natural Soda Water Revenue million Forecast, by Application 2020 & 2033
- Table 2: Global Natural Soda Water Revenue million Forecast, by Types 2020 & 2033
- Table 3: Global Natural Soda Water Revenue million Forecast, by Region 2020 & 2033
- Table 4: Global Natural Soda Water Revenue million Forecast, by Application 2020 & 2033
- Table 5: Global Natural Soda Water Revenue million Forecast, by Types 2020 & 2033
- Table 6: Global Natural Soda Water Revenue million Forecast, by Country 2020 & 2033
- Table 7: United States Natural Soda Water Revenue (million) Forecast, by Application 2020 & 2033
- Table 8: Canada Natural Soda Water Revenue (million) Forecast, by Application 2020 & 2033
- Table 9: Mexico Natural Soda Water Revenue (million) Forecast, by Application 2020 & 2033
- Table 10: Global Natural Soda Water Revenue million Forecast, by Application 2020 & 2033
- Table 11: Global Natural Soda Water Revenue million Forecast, by Types 2020 & 2033
- Table 12: Global Natural Soda Water Revenue million Forecast, by Country 2020 & 2033
- Table 13: Brazil Natural Soda Water Revenue (million) Forecast, by Application 2020 & 2033
- Table 14: Argentina Natural Soda Water Revenue (million) Forecast, by Application 2020 & 2033
- Table 15: Rest of South America Natural Soda Water Revenue (million) Forecast, by Application 2020 & 2033
- Table 16: Global Natural Soda Water Revenue million Forecast, by Application 2020 & 2033
- Table 17: Global Natural Soda Water Revenue million Forecast, by Types 2020 & 2033
- Table 18: Global Natural Soda Water Revenue million Forecast, by Country 2020 & 2033
- Table 19: United Kingdom Natural Soda Water Revenue (million) Forecast, by Application 2020 & 2033
- Table 20: Germany Natural Soda Water Revenue (million) Forecast, by Application 2020 & 2033
- Table 21: France Natural Soda Water Revenue (million) Forecast, by Application 2020 & 2033
- Table 22: Italy Natural Soda Water Revenue (million) Forecast, by Application 2020 & 2033
- Table 23: Spain Natural Soda Water Revenue (million) Forecast, by Application 2020 & 2033
- Table 24: Russia Natural Soda Water Revenue (million) Forecast, by Application 2020 & 2033
- Table 25: Benelux Natural Soda Water Revenue (million) Forecast, by Application 2020 & 2033
- Table 26: Nordics Natural Soda Water Revenue (million) Forecast, by Application 2020 & 2033
- Table 27: Rest of Europe Natural Soda Water Revenue (million) Forecast, by Application 2020 & 2033
- Table 28: Global Natural Soda Water Revenue million Forecast, by Application 2020 & 2033
- Table 29: Global Natural Soda Water Revenue million Forecast, by Types 2020 & 2033
- Table 30: Global Natural Soda Water Revenue million Forecast, by Country 2020 & 2033
- Table 31: Turkey Natural Soda Water Revenue (million) Forecast, by Application 2020 & 2033
- Table 32: Israel Natural Soda Water Revenue (million) Forecast, by Application 2020 & 2033
- Table 33: GCC Natural Soda Water Revenue (million) Forecast, by Application 2020 & 2033
- Table 34: North Africa Natural Soda Water Revenue (million) Forecast, by Application 2020 & 2033
- Table 35: South Africa Natural Soda Water Revenue (million) Forecast, by Application 2020 & 2033
- Table 36: Rest of Middle East & Africa Natural Soda Water Revenue (million) Forecast, by Application 2020 & 2033
- Table 37: Global Natural Soda Water Revenue million Forecast, by Application 2020 & 2033
- Table 38: Global Natural Soda Water Revenue million Forecast, by Types 2020 & 2033
- Table 39: Global Natural Soda Water Revenue million Forecast, by Country 2020 & 2033
- Table 40: China Natural Soda Water Revenue (million) Forecast, by Application 2020 & 2033
- Table 41: India Natural Soda Water Revenue (million) Forecast, by Application 2020 & 2033
- Table 42: Japan Natural Soda Water Revenue (million) Forecast, by Application 2020 & 2033
- Table 43: South Korea Natural Soda Water Revenue (million) Forecast, by Application 2020 & 2033
- Table 44: ASEAN Natural Soda Water Revenue (million) Forecast, by Application 2020 & 2033
- Table 45: Oceania Natural Soda Water Revenue (million) Forecast, by Application 2020 & 2033
- Table 46: Rest of Asia Pacific Natural Soda Water Revenue (million) Forecast, by Application 2020 & 2033
Frequently Asked Questions
1. What is the projected Compound Annual Growth Rate (CAGR) of the Natural Soda Water?
The projected CAGR is approximately XX%.
2. Which companies are prominent players in the Natural Soda Water?
Key companies in the market include Shudayuan, Shuiyifang, Lava-spring, N47°, Huiyuan, Alps, Fssoda, ELECTROX.
3. What are the main segments of the Natural Soda Water?
The market segments include Application, Types.
4. Can you provide details about the market size?
The market size is estimated to be USD XXX million as of 2022.
5. What are some drivers contributing to market growth?
N/A
6. What are the notable trends driving market growth?
N/A
7. Are there any restraints impacting market growth?
N/A
8. Can you provide examples of recent developments in the market?
N/A
9. What pricing options are available for accessing the report?
Pricing options include single-user, multi-user, and enterprise licenses priced at USD 4900.00, USD 7350.00, and USD 9800.00 respectively.
10. Is the market size provided in terms of value or volume?
The market size is provided in terms of value, measured in million.
11. Are there any specific market keywords associated with the report?
Yes, the market keyword associated with the report is "Natural Soda Water," which aids in identifying and referencing the specific market segment covered.
12. How do I determine which pricing option suits my needs best?
The pricing options vary based on user requirements and access needs. Individual users may opt for single-user licenses, while businesses requiring broader access may choose multi-user or enterprise licenses for cost-effective access to the report.
13. Are there any additional resources or data provided in the Natural Soda Water report?
While the report offers comprehensive insights, it's advisable to review the specific contents or supplementary materials provided to ascertain if additional resources or data are available.
14. How can I stay updated on further developments or reports in the Natural Soda Water?
To stay informed about further developments, trends, and reports in the Natural Soda Water, consider subscribing to industry newsletters, following relevant companies and organizations, or regularly checking reputable industry news sources and publications.
Methodology
Step 1 - Identification of Relevant Samples Size from Population Database


Step 2 - Approaches for Defining Global Market Size (Value, Volume* & Price*)

Note*: In applicable scenarios
Step 3 - Data Sources
Primary Research
- Web Analytics
- Survey Reports
- Research Institute
- Latest Research Reports
- Opinion Leaders
Secondary Research
- Annual Reports
- White Paper
- Latest Press Release
- Industry Association
- Paid Database
- Investor Presentations

Step 4 - Data Triangulation
Involves using different sources of information in order to increase the validity of a study
These sources are likely to be stakeholders in a program - participants, other researchers, program staff, other community members, and so on.
Then we put all data in single framework & apply various statistical tools to find out the dynamic on the market.
During the analysis stage, feedback from the stakeholder groups would be compared to determine areas of agreement as well as areas of divergence