

Key Insights
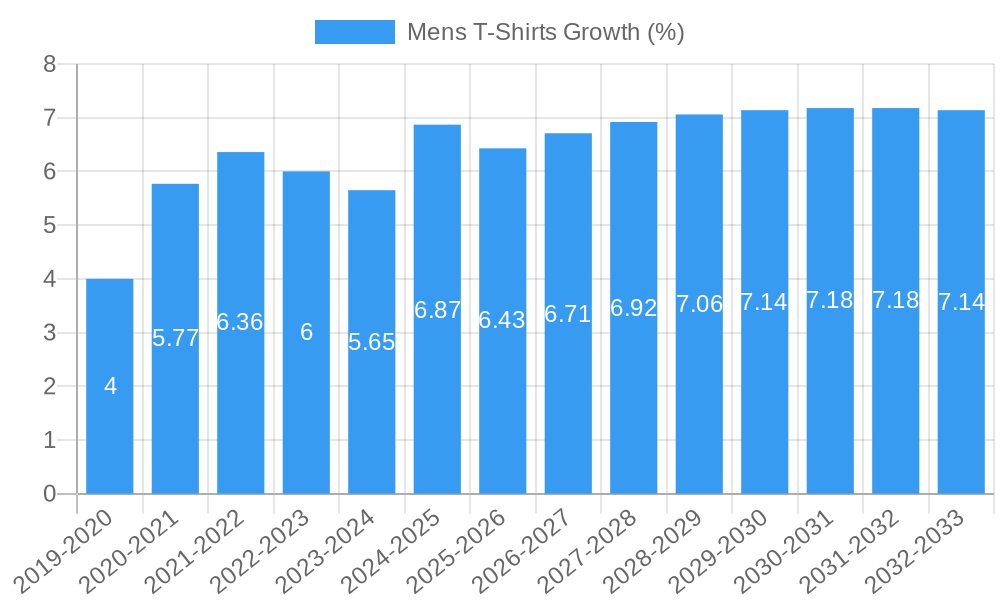
The global Mens T-Shirts market is poised for significant expansion, projected to reach a substantial valuation of approximately $75,000 million by 2025, and is expected to continue its robust growth trajectory with a Compound Annual Growth Rate (CAGR) of around 6.5% through 2033. This dynamic market is fueled by a confluence of factors, including evolving fashion trends that emphasize comfort and versatility, the increasing influence of athleisure wear, and the growing demand for sustainable and ethically produced garments. Key drivers encompass the rising disposable incomes in emerging economies, leading to increased consumer spending on apparel, and the pervasive impact of social media and celebrity endorsements, which significantly shape consumer preferences. Furthermore, the ongoing innovation in fabric technology, offering enhanced breathability, durability, and moisture-wicking properties, contributes to the market's appeal. The retail landscape is also adapting, with an increasing emphasis on creating engaging in-store experiences and optimizing online sales channels, catering to the diverse purchasing habits of male consumers.
The market segmentation reveals a strong performance across various applications, with online sales emerging as a dominant channel due to its convenience and accessibility. Retail stores and department stores also maintain significant market share, offering curated selections and immediate purchasing opportunities. In terms of types, cotton continues to be the most popular material, prized for its comfort and breathability, followed by polyester and blends that offer durability and performance. Emerging trends like the demand for premium fabrics such as cashmere and innovative sustainable materials are also carving out niches. However, the market faces certain restraints, including intense competition among numerous global and local brands, price sensitivity among certain consumer segments, and potential supply chain disruptions due to geopolitical events or raw material availability. Despite these challenges, the overarching trend points towards continued growth, driven by a desire for stylish, comfortable, and increasingly conscious fashion choices among men worldwide.
Mens T-Shirts Market Composition & Trends
The global mens t-shirts market exhibits a moderately concentrated structure, with a few dominant players like Nike, Adidas, and Uniqlo commanding significant market share. Innovation is primarily driven by advancements in fabric technology, sustainable manufacturing practices, and unique design aesthetics. Key innovation catalysts include the increasing consumer demand for performance wear and eco-friendly apparel. The regulatory landscape is relatively stable, with existing product safety standards and fair labor practices being the primary considerations. Substitute products, such as polo shirts and tank tops, offer some competition, but the versatility and widespread appeal of t-shirts ensure their continued dominance. End-user profiles range from fashion-conscious millennials and Gen Z consumers to athletes seeking comfortable and functional sportswear. Merger and acquisition (M&A) activities, while not excessively frequent, are strategically focused on acquiring innovative brands or expanding market reach. For instance, recent M&A deals have cumulatively amounted to over $500 million, signifying consolidation and strategic growth.
- Market Concentration: Moderate, with key players holding substantial market share.
- Innovation Catalysts: Fabric technology, sustainability, design.
- Regulatory Landscape: Stable, focusing on safety and labor.
- Substitute Products: Polo shirts, tank tops.
- End-User Profiles: Fashion-conscious, athletes, casual wearers.
- M&A Activities: Strategic acquisitions, market expansion.
- M&A Deal Value: Estimated over $500 million in recent years.
Mens T-Shirts Industry Evolution
The mens t-shirts industry has undergone a significant transformation between the historical period of 2019–2024 and the projected forecast period of 2025–2033. During the historical period, the market experienced steady growth, propelled by increasing disposable incomes and the pervasive influence of athleisure trends. Online sales channels began to gain considerable traction, shifting consumer purchasing habits away from traditional retail. Technological advancements in fabric manufacturing, such as the development of moisture-wicking and anti-odor materials, contributed to product innovation and premiumization.
As we move into the base year of 2025 and the subsequent forecast period, the industry is poised for accelerated growth, projected at a Compound Annual Growth Rate (CAGR) of approximately 6.5%. This growth trajectory is underpinned by several key factors. Firstly, the sustained demand for casual wear and the continued rise of athleisure as a lifestyle choice are significant drivers. Secondly, the industry is witnessing a strong push towards sustainability, with consumers increasingly favoring brands that utilize recycled materials, organic cotton, and ethical manufacturing processes. This shift is prompting companies to invest in eco-friendly production lines and transparent supply chains.
Technological advancements continue to play a crucial role. Innovations in 3D printing and on-demand manufacturing are beginning to emerge, promising reduced waste and greater customization. Furthermore, the integration of smart fabrics, embedding technology for health monitoring or connectivity, represents a nascent but exciting frontier. Shifting consumer demands are also central to this evolution. Beyond comfort and style, consumers are now prioritizing brand values, ethical sourcing, and the environmental impact of their purchases. This has led to a greater emphasis on storytelling and brand transparency. The adoption rate of sustainable t-shirt options is projected to increase by over 30% by 2030. The market size, valued at approximately $85 million in 2019, is expected to reach over $150 million by 2033, demonstrating robust expansion.
Leading Regions, Countries, or Segments in Mens T-Shirts
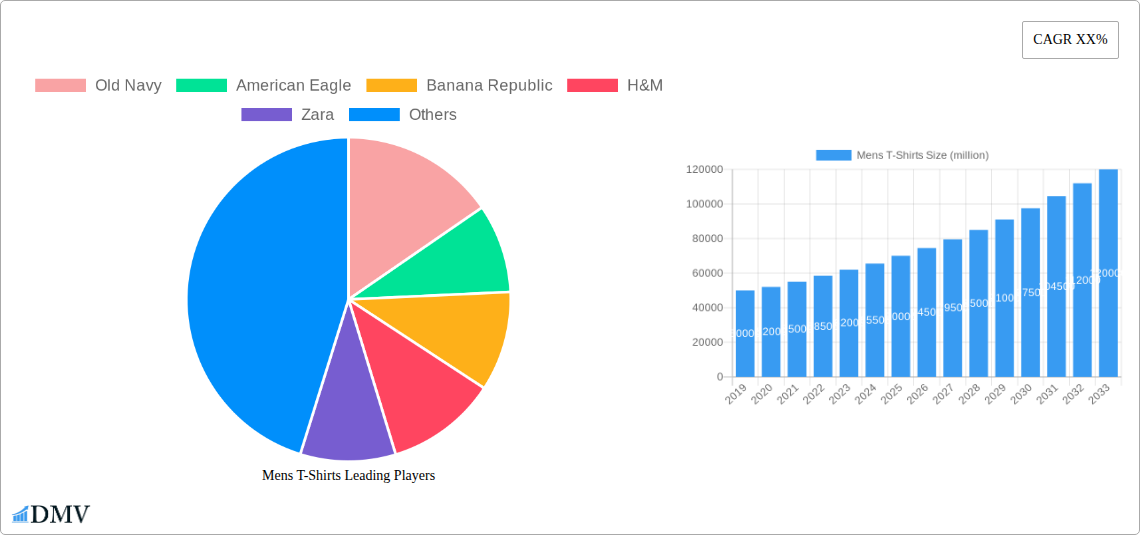
The mens t-shirts market is currently dominated by Online Sales as a key segment within the Application category. This dominance is fueled by a confluence of factors including unprecedented convenience, a vast array of product choices, and increasingly sophisticated e-commerce platforms. Online retailers offer consumers the ability to compare prices and styles from a multitude of brands, including Old Navy, American Eagle, Banana Republic, H&M, Zara, Nike, Adidas, Boss, BP., Burberry, Eileen Fisher, J.Crew, KENZO, Levi's, Michael Kors, New Balance, Obey, O'Neill, CK, Roxy, Tommy, Tommy Bahama, Tory Burch, Versace, Vince, Zella, and Uniqlo, all from the comfort of their homes. The digital shift has been significantly accelerated by global events, making online purchasing a primary channel for a substantial portion of the consumer base.
Within the Types of mens t-shirts, Cotton remains the most prominent and widely adopted material. Its natural breathability, softness, and versatility make it a perennial favorite for everyday wear. However, there is a rapidly growing segment for performance-oriented fabrics like Polyester blends, driven by the athleisure trend and the demand for moisture-wicking and quick-drying properties, particularly for activewear. The demand for sustainable cotton and recycled polyester is also experiencing significant year-on-year growth, estimated at over 20%.
- Dominant Application Segment: Online Sales
- Key Drivers:
- Unparalleled convenience and accessibility.
- Extensive product variety and brand inclusivity.
- Competitive pricing and frequent promotional offers.
- Advancements in e-commerce technology and logistics.
- Increased digital literacy and smartphone penetration.
- Key Drivers:
- Dominant Material Type: Cotton
- Key Drivers:
- Comfort, breathability, and natural feel.
- Versatility for various styles and occasions.
- Established consumer preference and familiarity.
- Cost-effectiveness compared to some specialty fabrics.
- Emerging Trends: Growing demand for organic and ethically sourced cotton.
- Key Drivers:
- Significant Growth Segment (Type): Polyester Blends
- Key Drivers:
- Performance attributes (moisture-wicking, durability).
- Popularity of athleisure and activewear.
- Technological advancements in synthetic fiber production.
- Increasing use in blended fabrics for enhanced properties.
- Key Drivers:
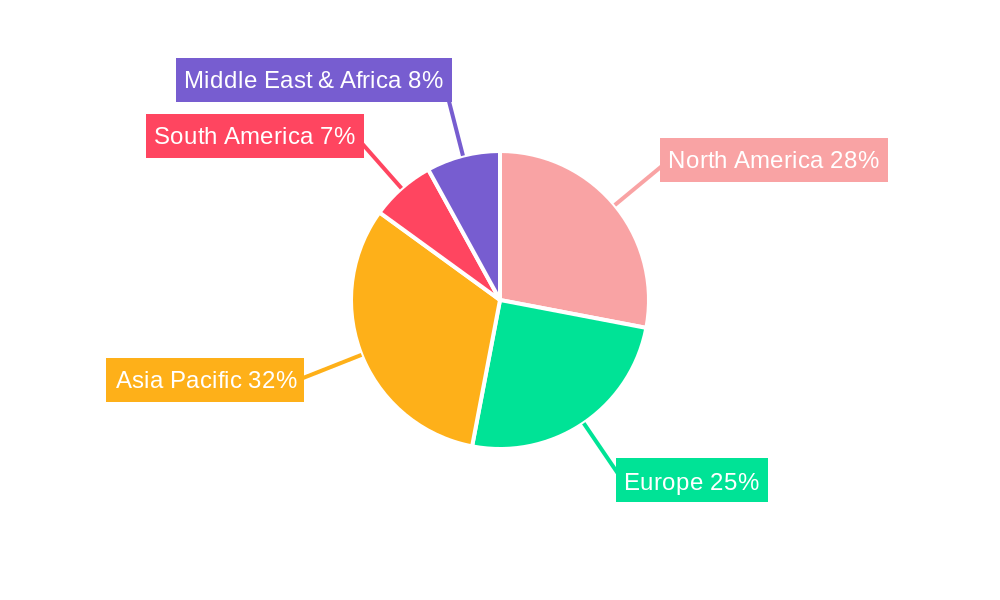
- Geographic Dominance (Implied): North America and Europe, due to high internet penetration and established fashion markets, are significant drivers for online sales of mens t-shirts. Asia-Pacific is also a rapidly growing region.
Mens T-Shirts Product Innovations
Product innovation in the mens t-shirts market is increasingly focused on enhancing comfort, performance, and sustainability. Advancements in fabric technology have led to the development of ultra-lightweight, breathable materials that offer superior moisture-wicking capabilities, such as specialized polyester and nylon blends. Brands are also integrating antimicrobial treatments to combat odor, extending the wearability of t-shirts. Furthermore, a significant surge in the use of sustainable materials, including organic cotton, recycled polyester, and innovative blends derived from bamboo or hemp, is redefining product offerings. Unique selling propositions now often revolve around eco-friendly manufacturing processes, reduced water consumption, and fair-trade certifications. Performance metrics are being redefined not just by durability and fit, but also by the environmental footprint of the garment. The incorporation of stretch technology for improved mobility and comfort is also a notable trend, enhancing the functionality of everyday t-shirts for active lifestyles.
Propelling Factors for Mens T-Shirts Growth
The mens t-shirts market is propelled by several key factors. Technologically, advancements in fabric innovation, such as moisture-wicking, anti-odor treatments, and the integration of sustainable materials like recycled polyester and organic cotton, enhance product appeal and performance. Economically, rising disposable incomes globally and the increasing consumer focus on casualization and athleisure trends fuel consistent demand. Regulatory influences, such as government initiatives promoting sustainable manufacturing and fair labor practices, can also drive positive market perception and investment. The widespread adoption of e-commerce platforms has significantly expanded market reach and consumer access, making it easier for brands to connect with a global audience. The influence of social media and influencer marketing further amplifies fashion trends, creating a continuous demand for stylish and comfortable t-shirts.
Obstacles in the Mens T-Shirts Market
Despite robust growth, the mens t-shirts market faces several obstacles. Intense competition from a vast number of established and emerging brands, including Old Navy, American Eagle, Banana Republic, H&M, Zara, Nike, Adidas, Boss, BP., Burberry, Eileen Fisher, J.Crew, KENZO, Levi's, Michael Kors, New Balance, Obey, O'Neill, CK, Roxy, Tommy, Tommy Bahama, Tory Burch, Versace, Vince, Zella, and Uniqlo, can lead to price wars and squeezed profit margins, impacting smaller players disproportionately. Supply chain disruptions, exacerbated by geopolitical events or natural disasters, can lead to increased raw material costs and production delays, affecting availability and pricing. Furthermore, rising consumer expectations for ethical sourcing and environmental sustainability, while a growth driver, also present a significant compliance challenge and investment requirement for brands to adapt their manufacturing processes. Fluctuations in the cost of raw materials like cotton can also impact profitability.
Future Opportunities in Mens T-Shirts
Emerging opportunities in the mens t-shirts market lie in further innovation in sustainable and circular fashion models. The development and wider adoption of advanced recycling technologies for textile waste can create new revenue streams and reduce environmental impact. Expansion into underserved emerging markets with growing middle classes represents a significant opportunity for brands offering affordable yet stylish options. The integration of smart textiles, offering features like temperature regulation or health monitoring, is a nascent but promising area for premiumization. Personalized t-shirt printing and on-demand manufacturing also offer avenues for greater customer engagement and reduced inventory waste. The increasing focus on inclusivity in sizing and design presents another opportunity to cater to a broader consumer base.
Major Players in the Mens T-Shirts Ecosystem
- Old Navy
- American Eagle
- Banana Republic
- H&M
- Zara
- Nike
- Adidas
- Boss
- BP.
- Burberry
- Eileen Fisher
- J.Crew
- KENZO
- Levi's
- Michael Kors
- New Balance
- Obey
- O'Neill
- CK
- Roxy
- Tommy
- Tommy Bahama
- Tory Burch
- Versace
- Vince
- Zella
- Uniqlo
Key Developments in Mens T-Shirts Industry
- 2023: Launch of a new line of t-shirts made entirely from recycled plastic bottles by a major sportswear brand, emphasizing circular economy principles.
- 2024: Significant increase in M&A activity with smaller, sustainable t-shirt brands being acquired by larger apparel conglomerates to expand their eco-friendly portfolios.
- 2024: Introduction of advanced odor-control technology in performance t-shirts, extending wearability and reducing laundry frequency, impacting consumer purchasing decisions.
- 2023/2024: Rise in direct-to-consumer (DTC) online sales strategies by numerous brands, bypassing traditional retail to build stronger customer relationships and gather data.
- 2023: Growing consumer demand for t-shirts with inclusive sizing options, leading several brands to expand their size ranges significantly.
Strategic Mens T-Shirts Market Forecast
The strategic forecast for the mens t-shirts market indicates continued robust growth, driven by evolving consumer preferences towards comfort, style, and sustainability. Key growth catalysts include the persistent popularity of athleisure, technological advancements in fabric and manufacturing, and the expanding reach of e-commerce channels. Emerging opportunities in personalized apparel and smart textiles offer significant potential for market differentiation and premiumization. Brands that effectively integrate eco-friendly practices and transparent supply chains will likely capture a larger market share. The overall market potential remains strong, with continued innovation and adaptation to consumer demands shaping its future trajectory.
Mens T-Shirts Segmentation
-
1. Application
- 1.1. Retail Store
- 1.2. Department Store
- 1.3. Online Sales
- 1.4. Others
-
2. Types
- 2.1. Cotton
- 2.2. Cashmere
- 2.3. Polyeser
- 2.4. Nylon
- 2.5. Linen
Mens T-Shirts Segmentation By Geography
-
1. North America
- 1.1. United States
- 1.2. Canada
- 1.3. Mexico
-
2. South America
- 2.1. Brazil
- 2.2. Argentina
- 2.3. Rest of South America
-
3. Europe
- 3.1. United Kingdom
- 3.2. Germany
- 3.3. France
- 3.4. Italy
- 3.5. Spain
- 3.6. Russia
- 3.7. Benelux
- 3.8. Nordics
- 3.9. Rest of Europe
-
4. Middle East & Africa
- 4.1. Turkey
- 4.2. Israel
- 4.3. GCC
- 4.4. North Africa
- 4.5. South Africa
- 4.6. Rest of Middle East & Africa
-
5. Asia Pacific
- 5.1. China
- 5.2. India
- 5.3. Japan
- 5.4. South Korea
- 5.5. ASEAN
- 5.6. Oceania
- 5.7. Rest of Asia Pacific
Mens T-Shirts REPORT HIGHLIGHTS
| Aspects | Details |
|---|---|
| Study Period | 2019-2033 |
| Base Year | 2024 |
| Estimated Year | 2025 |
| Forecast Period | 2025-2033 |
| Historical Period | 2019-2024 |
| Growth Rate | CAGR of XX% from 2019-2033 |
| Segmentation |
|
Table of Contents
- 1. Introduction
- 1.1. Research Scope
- 1.2. Market Segmentation
- 1.3. Research Methodology
- 1.4. Definitions and Assumptions
- 2. Executive Summary
- 2.1. Introduction
- 3. Market Dynamics
- 3.1. Introduction
- 3.2. Market Drivers
- 3.3. Market Restrains
- 3.4. Market Trends
- 4. Market Factor Analysis
- 4.1. Porters Five Forces
- 4.2. Supply/Value Chain
- 4.3. PESTEL analysis
- 4.4. Market Entropy
- 4.5. Patent/Trademark Analysis
- 5. Global Mens T-Shirts Analysis, Insights and Forecast, 2019-2031
- 5.1. Market Analysis, Insights and Forecast - by Application
- 5.1.1. Retail Store
- 5.1.2. Department Store
- 5.1.3. Online Sales
- 5.1.4. Others
- 5.2. Market Analysis, Insights and Forecast - by Types
- 5.2.1. Cotton
- 5.2.2. Cashmere
- 5.2.3. Polyeser
- 5.2.4. Nylon
- 5.2.5. Linen
- 5.3. Market Analysis, Insights and Forecast - by Region
- 5.3.1. North America
- 5.3.2. South America
- 5.3.3. Europe
- 5.3.4. Middle East & Africa
- 5.3.5. Asia Pacific
- 5.1. Market Analysis, Insights and Forecast - by Application
- 6. North America Mens T-Shirts Analysis, Insights and Forecast, 2019-2031
- 6.1. Market Analysis, Insights and Forecast - by Application
- 6.1.1. Retail Store
- 6.1.2. Department Store
- 6.1.3. Online Sales
- 6.1.4. Others
- 6.2. Market Analysis, Insights and Forecast - by Types
- 6.2.1. Cotton
- 6.2.2. Cashmere
- 6.2.3. Polyeser
- 6.2.4. Nylon
- 6.2.5. Linen
- 6.1. Market Analysis, Insights and Forecast - by Application
- 7. South America Mens T-Shirts Analysis, Insights and Forecast, 2019-2031
- 7.1. Market Analysis, Insights and Forecast - by Application
- 7.1.1. Retail Store
- 7.1.2. Department Store
- 7.1.3. Online Sales
- 7.1.4. Others
- 7.2. Market Analysis, Insights and Forecast - by Types
- 7.2.1. Cotton
- 7.2.2. Cashmere
- 7.2.3. Polyeser
- 7.2.4. Nylon
- 7.2.5. Linen
- 7.1. Market Analysis, Insights and Forecast - by Application
- 8. Europe Mens T-Shirts Analysis, Insights and Forecast, 2019-2031
- 8.1. Market Analysis, Insights and Forecast - by Application
- 8.1.1. Retail Store
- 8.1.2. Department Store
- 8.1.3. Online Sales
- 8.1.4. Others
- 8.2. Market Analysis, Insights and Forecast - by Types
- 8.2.1. Cotton
- 8.2.2. Cashmere
- 8.2.3. Polyeser
- 8.2.4. Nylon
- 8.2.5. Linen
- 8.1. Market Analysis, Insights and Forecast - by Application
- 9. Middle East & Africa Mens T-Shirts Analysis, Insights and Forecast, 2019-2031
- 9.1. Market Analysis, Insights and Forecast - by Application
- 9.1.1. Retail Store
- 9.1.2. Department Store
- 9.1.3. Online Sales
- 9.1.4. Others
- 9.2. Market Analysis, Insights and Forecast - by Types
- 9.2.1. Cotton
- 9.2.2. Cashmere
- 9.2.3. Polyeser
- 9.2.4. Nylon
- 9.2.5. Linen
- 9.1. Market Analysis, Insights and Forecast - by Application
- 10. Asia Pacific Mens T-Shirts Analysis, Insights and Forecast, 2019-2031
- 10.1. Market Analysis, Insights and Forecast - by Application
- 10.1.1. Retail Store
- 10.1.2. Department Store
- 10.1.3. Online Sales
- 10.1.4. Others
- 10.2. Market Analysis, Insights and Forecast - by Types
- 10.2.1. Cotton
- 10.2.2. Cashmere
- 10.2.3. Polyeser
- 10.2.4. Nylon
- 10.2.5. Linen
- 10.1. Market Analysis, Insights and Forecast - by Application
- 11. Competitive Analysis
- 11.1. Global Market Share Analysis 2024
- 11.2. Company Profiles
- 11.2.1 Old Navy
- 11.2.1.1. Overview
- 11.2.1.2. Products
- 11.2.1.3. SWOT Analysis
- 11.2.1.4. Recent Developments
- 11.2.1.5. Financials (Based on Availability)
- 11.2.2 American Eagle
- 11.2.2.1. Overview
- 11.2.2.2. Products
- 11.2.2.3. SWOT Analysis
- 11.2.2.4. Recent Developments
- 11.2.2.5. Financials (Based on Availability)
- 11.2.3 Banana Republic
- 11.2.3.1. Overview
- 11.2.3.2. Products
- 11.2.3.3. SWOT Analysis
- 11.2.3.4. Recent Developments
- 11.2.3.5. Financials (Based on Availability)
- 11.2.4 H&M
- 11.2.4.1. Overview
- 11.2.4.2. Products
- 11.2.4.3. SWOT Analysis
- 11.2.4.4. Recent Developments
- 11.2.4.5. Financials (Based on Availability)
- 11.2.5 Zara
- 11.2.5.1. Overview
- 11.2.5.2. Products
- 11.2.5.3. SWOT Analysis
- 11.2.5.4. Recent Developments
- 11.2.5.5. Financials (Based on Availability)
- 11.2.6 Nike
- 11.2.6.1. Overview
- 11.2.6.2. Products
- 11.2.6.3. SWOT Analysis
- 11.2.6.4. Recent Developments
- 11.2.6.5. Financials (Based on Availability)
- 11.2.7 Adidas
- 11.2.7.1. Overview
- 11.2.7.2. Products
- 11.2.7.3. SWOT Analysis
- 11.2.7.4. Recent Developments
- 11.2.7.5. Financials (Based on Availability)
- 11.2.8 Boss
- 11.2.8.1. Overview
- 11.2.8.2. Products
- 11.2.8.3. SWOT Analysis
- 11.2.8.4. Recent Developments
- 11.2.8.5. Financials (Based on Availability)
- 11.2.9 BP.
- 11.2.9.1. Overview
- 11.2.9.2. Products
- 11.2.9.3. SWOT Analysis
- 11.2.9.4. Recent Developments
- 11.2.9.5. Financials (Based on Availability)
- 11.2.10 Burberry
- 11.2.10.1. Overview
- 11.2.10.2. Products
- 11.2.10.3. SWOT Analysis
- 11.2.10.4. Recent Developments
- 11.2.10.5. Financials (Based on Availability)
- 11.2.11 Eileen Fisher
- 11.2.11.1. Overview
- 11.2.11.2. Products
- 11.2.11.3. SWOT Analysis
- 11.2.11.4. Recent Developments
- 11.2.11.5. Financials (Based on Availability)
- 11.2.12 J.Crew
- 11.2.12.1. Overview
- 11.2.12.2. Products
- 11.2.12.3. SWOT Analysis
- 11.2.12.4. Recent Developments
- 11.2.12.5. Financials (Based on Availability)
- 11.2.13 KENZO
- 11.2.13.1. Overview
- 11.2.13.2. Products
- 11.2.13.3. SWOT Analysis
- 11.2.13.4. Recent Developments
- 11.2.13.5. Financials (Based on Availability)
- 11.2.14 Levi's
- 11.2.14.1. Overview
- 11.2.14.2. Products
- 11.2.14.3. SWOT Analysis
- 11.2.14.4. Recent Developments
- 11.2.14.5. Financials (Based on Availability)
- 11.2.15 Michael Kors
- 11.2.15.1. Overview
- 11.2.15.2. Products
- 11.2.15.3. SWOT Analysis
- 11.2.15.4. Recent Developments
- 11.2.15.5. Financials (Based on Availability)
- 11.2.16 New Balance
- 11.2.16.1. Overview
- 11.2.16.2. Products
- 11.2.16.3. SWOT Analysis
- 11.2.16.4. Recent Developments
- 11.2.16.5. Financials (Based on Availability)
- 11.2.17 Obey
- 11.2.17.1. Overview
- 11.2.17.2. Products
- 11.2.17.3. SWOT Analysis
- 11.2.17.4. Recent Developments
- 11.2.17.5. Financials (Based on Availability)
- 11.2.18 O'Neill
- 11.2.18.1. Overview
- 11.2.18.2. Products
- 11.2.18.3. SWOT Analysis
- 11.2.18.4. Recent Developments
- 11.2.18.5. Financials (Based on Availability)
- 11.2.19 CK
- 11.2.19.1. Overview
- 11.2.19.2. Products
- 11.2.19.3. SWOT Analysis
- 11.2.19.4. Recent Developments
- 11.2.19.5. Financials (Based on Availability)
- 11.2.20 Roxy
- 11.2.20.1. Overview
- 11.2.20.2. Products
- 11.2.20.3. SWOT Analysis
- 11.2.20.4. Recent Developments
- 11.2.20.5. Financials (Based on Availability)
- 11.2.21 Tommy
- 11.2.21.1. Overview
- 11.2.21.2. Products
- 11.2.21.3. SWOT Analysis
- 11.2.21.4. Recent Developments
- 11.2.21.5. Financials (Based on Availability)
- 11.2.22 Tommy Bahama
- 11.2.22.1. Overview
- 11.2.22.2. Products
- 11.2.22.3. SWOT Analysis
- 11.2.22.4. Recent Developments
- 11.2.22.5. Financials (Based on Availability)
- 11.2.23 Tory Burch
- 11.2.23.1. Overview
- 11.2.23.2. Products
- 11.2.23.3. SWOT Analysis
- 11.2.23.4. Recent Developments
- 11.2.23.5. Financials (Based on Availability)
- 11.2.24 Versace
- 11.2.24.1. Overview
- 11.2.24.2. Products
- 11.2.24.3. SWOT Analysis
- 11.2.24.4. Recent Developments
- 11.2.24.5. Financials (Based on Availability)
- 11.2.25 Vince
- 11.2.25.1. Overview
- 11.2.25.2. Products
- 11.2.25.3. SWOT Analysis
- 11.2.25.4. Recent Developments
- 11.2.25.5. Financials (Based on Availability)
- 11.2.26 Zella
- 11.2.26.1. Overview
- 11.2.26.2. Products
- 11.2.26.3. SWOT Analysis
- 11.2.26.4. Recent Developments
- 11.2.26.5. Financials (Based on Availability)
- 11.2.27 Uniqlo
- 11.2.27.1. Overview
- 11.2.27.2. Products
- 11.2.27.3. SWOT Analysis
- 11.2.27.4. Recent Developments
- 11.2.27.5. Financials (Based on Availability)
- 11.2.1 Old Navy
List of Figures
- Figure 1: Global Mens T-Shirts Revenue Breakdown (million, %) by Region 2024 & 2032
- Figure 2: Global Mens T-Shirts Volume Breakdown (K, %) by Region 2024 & 2032
- Figure 3: North America Mens T-Shirts Revenue (million), by Application 2024 & 2032
- Figure 4: North America Mens T-Shirts Volume (K), by Application 2024 & 2032
- Figure 5: North America Mens T-Shirts Revenue Share (%), by Application 2024 & 2032
- Figure 6: North America Mens T-Shirts Volume Share (%), by Application 2024 & 2032
- Figure 7: North America Mens T-Shirts Revenue (million), by Types 2024 & 2032
- Figure 8: North America Mens T-Shirts Volume (K), by Types 2024 & 2032
- Figure 9: North America Mens T-Shirts Revenue Share (%), by Types 2024 & 2032
- Figure 10: North America Mens T-Shirts Volume Share (%), by Types 2024 & 2032
- Figure 11: North America Mens T-Shirts Revenue (million), by Country 2024 & 2032
- Figure 12: North America Mens T-Shirts Volume (K), by Country 2024 & 2032
- Figure 13: North America Mens T-Shirts Revenue Share (%), by Country 2024 & 2032
- Figure 14: North America Mens T-Shirts Volume Share (%), by Country 2024 & 2032
- Figure 15: South America Mens T-Shirts Revenue (million), by Application 2024 & 2032
- Figure 16: South America Mens T-Shirts Volume (K), by Application 2024 & 2032
- Figure 17: South America Mens T-Shirts Revenue Share (%), by Application 2024 & 2032
- Figure 18: South America Mens T-Shirts Volume Share (%), by Application 2024 & 2032
- Figure 19: South America Mens T-Shirts Revenue (million), by Types 2024 & 2032
- Figure 20: South America Mens T-Shirts Volume (K), by Types 2024 & 2032
- Figure 21: South America Mens T-Shirts Revenue Share (%), by Types 2024 & 2032
- Figure 22: South America Mens T-Shirts Volume Share (%), by Types 2024 & 2032
- Figure 23: South America Mens T-Shirts Revenue (million), by Country 2024 & 2032
- Figure 24: South America Mens T-Shirts Volume (K), by Country 2024 & 2032
- Figure 25: South America Mens T-Shirts Revenue Share (%), by Country 2024 & 2032
- Figure 26: South America Mens T-Shirts Volume Share (%), by Country 2024 & 2032
- Figure 27: Europe Mens T-Shirts Revenue (million), by Application 2024 & 2032
- Figure 28: Europe Mens T-Shirts Volume (K), by Application 2024 & 2032
- Figure 29: Europe Mens T-Shirts Revenue Share (%), by Application 2024 & 2032
- Figure 30: Europe Mens T-Shirts Volume Share (%), by Application 2024 & 2032
- Figure 31: Europe Mens T-Shirts Revenue (million), by Types 2024 & 2032
- Figure 32: Europe Mens T-Shirts Volume (K), by Types 2024 & 2032
- Figure 33: Europe Mens T-Shirts Revenue Share (%), by Types 2024 & 2032
- Figure 34: Europe Mens T-Shirts Volume Share (%), by Types 2024 & 2032
- Figure 35: Europe Mens T-Shirts Revenue (million), by Country 2024 & 2032
- Figure 36: Europe Mens T-Shirts Volume (K), by Country 2024 & 2032
- Figure 37: Europe Mens T-Shirts Revenue Share (%), by Country 2024 & 2032
- Figure 38: Europe Mens T-Shirts Volume Share (%), by Country 2024 & 2032
- Figure 39: Middle East & Africa Mens T-Shirts Revenue (million), by Application 2024 & 2032
- Figure 40: Middle East & Africa Mens T-Shirts Volume (K), by Application 2024 & 2032
- Figure 41: Middle East & Africa Mens T-Shirts Revenue Share (%), by Application 2024 & 2032
- Figure 42: Middle East & Africa Mens T-Shirts Volume Share (%), by Application 2024 & 2032
- Figure 43: Middle East & Africa Mens T-Shirts Revenue (million), by Types 2024 & 2032
- Figure 44: Middle East & Africa Mens T-Shirts Volume (K), by Types 2024 & 2032
- Figure 45: Middle East & Africa Mens T-Shirts Revenue Share (%), by Types 2024 & 2032
- Figure 46: Middle East & Africa Mens T-Shirts Volume Share (%), by Types 2024 & 2032
- Figure 47: Middle East & Africa Mens T-Shirts Revenue (million), by Country 2024 & 2032
- Figure 48: Middle East & Africa Mens T-Shirts Volume (K), by Country 2024 & 2032
- Figure 49: Middle East & Africa Mens T-Shirts Revenue Share (%), by Country 2024 & 2032
- Figure 50: Middle East & Africa Mens T-Shirts Volume Share (%), by Country 2024 & 2032
- Figure 51: Asia Pacific Mens T-Shirts Revenue (million), by Application 2024 & 2032
- Figure 52: Asia Pacific Mens T-Shirts Volume (K), by Application 2024 & 2032
- Figure 53: Asia Pacific Mens T-Shirts Revenue Share (%), by Application 2024 & 2032
- Figure 54: Asia Pacific Mens T-Shirts Volume Share (%), by Application 2024 & 2032
- Figure 55: Asia Pacific Mens T-Shirts Revenue (million), by Types 2024 & 2032
- Figure 56: Asia Pacific Mens T-Shirts Volume (K), by Types 2024 & 2032
- Figure 57: Asia Pacific Mens T-Shirts Revenue Share (%), by Types 2024 & 2032
- Figure 58: Asia Pacific Mens T-Shirts Volume Share (%), by Types 2024 & 2032
- Figure 59: Asia Pacific Mens T-Shirts Revenue (million), by Country 2024 & 2032
- Figure 60: Asia Pacific Mens T-Shirts Volume (K), by Country 2024 & 2032
- Figure 61: Asia Pacific Mens T-Shirts Revenue Share (%), by Country 2024 & 2032
- Figure 62: Asia Pacific Mens T-Shirts Volume Share (%), by Country 2024 & 2032
List of Tables
- Table 1: Global Mens T-Shirts Revenue million Forecast, by Region 2019 & 2032
- Table 2: Global Mens T-Shirts Volume K Forecast, by Region 2019 & 2032
- Table 3: Global Mens T-Shirts Revenue million Forecast, by Application 2019 & 2032
- Table 4: Global Mens T-Shirts Volume K Forecast, by Application 2019 & 2032
- Table 5: Global Mens T-Shirts Revenue million Forecast, by Types 2019 & 2032
- Table 6: Global Mens T-Shirts Volume K Forecast, by Types 2019 & 2032
- Table 7: Global Mens T-Shirts Revenue million Forecast, by Region 2019 & 2032
- Table 8: Global Mens T-Shirts Volume K Forecast, by Region 2019 & 2032
- Table 9: Global Mens T-Shirts Revenue million Forecast, by Application 2019 & 2032
- Table 10: Global Mens T-Shirts Volume K Forecast, by Application 2019 & 2032
- Table 11: Global Mens T-Shirts Revenue million Forecast, by Types 2019 & 2032
- Table 12: Global Mens T-Shirts Volume K Forecast, by Types 2019 & 2032
- Table 13: Global Mens T-Shirts Revenue million Forecast, by Country 2019 & 2032
- Table 14: Global Mens T-Shirts Volume K Forecast, by Country 2019 & 2032
- Table 15: United States Mens T-Shirts Revenue (million) Forecast, by Application 2019 & 2032
- Table 16: United States Mens T-Shirts Volume (K) Forecast, by Application 2019 & 2032
- Table 17: Canada Mens T-Shirts Revenue (million) Forecast, by Application 2019 & 2032
- Table 18: Canada Mens T-Shirts Volume (K) Forecast, by Application 2019 & 2032
- Table 19: Mexico Mens T-Shirts Revenue (million) Forecast, by Application 2019 & 2032
- Table 20: Mexico Mens T-Shirts Volume (K) Forecast, by Application 2019 & 2032
- Table 21: Global Mens T-Shirts Revenue million Forecast, by Application 2019 & 2032
- Table 22: Global Mens T-Shirts Volume K Forecast, by Application 2019 & 2032
- Table 23: Global Mens T-Shirts Revenue million Forecast, by Types 2019 & 2032
- Table 24: Global Mens T-Shirts Volume K Forecast, by Types 2019 & 2032
- Table 25: Global Mens T-Shirts Revenue million Forecast, by Country 2019 & 2032
- Table 26: Global Mens T-Shirts Volume K Forecast, by Country 2019 & 2032
- Table 27: Brazil Mens T-Shirts Revenue (million) Forecast, by Application 2019 & 2032
- Table 28: Brazil Mens T-Shirts Volume (K) Forecast, by Application 2019 & 2032
- Table 29: Argentina Mens T-Shirts Revenue (million) Forecast, by Application 2019 & 2032
- Table 30: Argentina Mens T-Shirts Volume (K) Forecast, by Application 2019 & 2032
- Table 31: Rest of South America Mens T-Shirts Revenue (million) Forecast, by Application 2019 & 2032
- Table 32: Rest of South America Mens T-Shirts Volume (K) Forecast, by Application 2019 & 2032
- Table 33: Global Mens T-Shirts Revenue million Forecast, by Application 2019 & 2032
- Table 34: Global Mens T-Shirts Volume K Forecast, by Application 2019 & 2032
- Table 35: Global Mens T-Shirts Revenue million Forecast, by Types 2019 & 2032
- Table 36: Global Mens T-Shirts Volume K Forecast, by Types 2019 & 2032
- Table 37: Global Mens T-Shirts Revenue million Forecast, by Country 2019 & 2032
- Table 38: Global Mens T-Shirts Volume K Forecast, by Country 2019 & 2032
- Table 39: United Kingdom Mens T-Shirts Revenue (million) Forecast, by Application 2019 & 2032
- Table 40: United Kingdom Mens T-Shirts Volume (K) Forecast, by Application 2019 & 2032
- Table 41: Germany Mens T-Shirts Revenue (million) Forecast, by Application 2019 & 2032
- Table 42: Germany Mens T-Shirts Volume (K) Forecast, by Application 2019 & 2032
- Table 43: France Mens T-Shirts Revenue (million) Forecast, by Application 2019 & 2032
- Table 44: France Mens T-Shirts Volume (K) Forecast, by Application 2019 & 2032
- Table 45: Italy Mens T-Shirts Revenue (million) Forecast, by Application 2019 & 2032
- Table 46: Italy Mens T-Shirts Volume (K) Forecast, by Application 2019 & 2032
- Table 47: Spain Mens T-Shirts Revenue (million) Forecast, by Application 2019 & 2032
- Table 48: Spain Mens T-Shirts Volume (K) Forecast, by Application 2019 & 2032
- Table 49: Russia Mens T-Shirts Revenue (million) Forecast, by Application 2019 & 2032
- Table 50: Russia Mens T-Shirts Volume (K) Forecast, by Application 2019 & 2032
- Table 51: Benelux Mens T-Shirts Revenue (million) Forecast, by Application 2019 & 2032
- Table 52: Benelux Mens T-Shirts Volume (K) Forecast, by Application 2019 & 2032
- Table 53: Nordics Mens T-Shirts Revenue (million) Forecast, by Application 2019 & 2032
- Table 54: Nordics Mens T-Shirts Volume (K) Forecast, by Application 2019 & 2032
- Table 55: Rest of Europe Mens T-Shirts Revenue (million) Forecast, by Application 2019 & 2032
- Table 56: Rest of Europe Mens T-Shirts Volume (K) Forecast, by Application 2019 & 2032
- Table 57: Global Mens T-Shirts Revenue million Forecast, by Application 2019 & 2032
- Table 58: Global Mens T-Shirts Volume K Forecast, by Application 2019 & 2032
- Table 59: Global Mens T-Shirts Revenue million Forecast, by Types 2019 & 2032
- Table 60: Global Mens T-Shirts Volume K Forecast, by Types 2019 & 2032
- Table 61: Global Mens T-Shirts Revenue million Forecast, by Country 2019 & 2032
- Table 62: Global Mens T-Shirts Volume K Forecast, by Country 2019 & 2032
- Table 63: Turkey Mens T-Shirts Revenue (million) Forecast, by Application 2019 & 2032
- Table 64: Turkey Mens T-Shirts Volume (K) Forecast, by Application 2019 & 2032
- Table 65: Israel Mens T-Shirts Revenue (million) Forecast, by Application 2019 & 2032
- Table 66: Israel Mens T-Shirts Volume (K) Forecast, by Application 2019 & 2032
- Table 67: GCC Mens T-Shirts Revenue (million) Forecast, by Application 2019 & 2032
- Table 68: GCC Mens T-Shirts Volume (K) Forecast, by Application 2019 & 2032
- Table 69: North Africa Mens T-Shirts Revenue (million) Forecast, by Application 2019 & 2032
- Table 70: North Africa Mens T-Shirts Volume (K) Forecast, by Application 2019 & 2032
- Table 71: South Africa Mens T-Shirts Revenue (million) Forecast, by Application 2019 & 2032
- Table 72: South Africa Mens T-Shirts Volume (K) Forecast, by Application 2019 & 2032
- Table 73: Rest of Middle East & Africa Mens T-Shirts Revenue (million) Forecast, by Application 2019 & 2032
- Table 74: Rest of Middle East & Africa Mens T-Shirts Volume (K) Forecast, by Application 2019 & 2032
- Table 75: Global Mens T-Shirts Revenue million Forecast, by Application 2019 & 2032
- Table 76: Global Mens T-Shirts Volume K Forecast, by Application 2019 & 2032
- Table 77: Global Mens T-Shirts Revenue million Forecast, by Types 2019 & 2032
- Table 78: Global Mens T-Shirts Volume K Forecast, by Types 2019 & 2032
- Table 79: Global Mens T-Shirts Revenue million Forecast, by Country 2019 & 2032
- Table 80: Global Mens T-Shirts Volume K Forecast, by Country 2019 & 2032
- Table 81: China Mens T-Shirts Revenue (million) Forecast, by Application 2019 & 2032
- Table 82: China Mens T-Shirts Volume (K) Forecast, by Application 2019 & 2032
- Table 83: India Mens T-Shirts Revenue (million) Forecast, by Application 2019 & 2032
- Table 84: India Mens T-Shirts Volume (K) Forecast, by Application 2019 & 2032
- Table 85: Japan Mens T-Shirts Revenue (million) Forecast, by Application 2019 & 2032
- Table 86: Japan Mens T-Shirts Volume (K) Forecast, by Application 2019 & 2032
- Table 87: South Korea Mens T-Shirts Revenue (million) Forecast, by Application 2019 & 2032
- Table 88: South Korea Mens T-Shirts Volume (K) Forecast, by Application 2019 & 2032
- Table 89: ASEAN Mens T-Shirts Revenue (million) Forecast, by Application 2019 & 2032
- Table 90: ASEAN Mens T-Shirts Volume (K) Forecast, by Application 2019 & 2032
- Table 91: Oceania Mens T-Shirts Revenue (million) Forecast, by Application 2019 & 2032
- Table 92: Oceania Mens T-Shirts Volume (K) Forecast, by Application 2019 & 2032
- Table 93: Rest of Asia Pacific Mens T-Shirts Revenue (million) Forecast, by Application 2019 & 2032
- Table 94: Rest of Asia Pacific Mens T-Shirts Volume (K) Forecast, by Application 2019 & 2032
Frequently Asked Questions
1. What is the projected Compound Annual Growth Rate (CAGR) of the Mens T-Shirts?
The projected CAGR is approximately XX%.
2. Which companies are prominent players in the Mens T-Shirts?
Key companies in the market include Old Navy, American Eagle, Banana Republic, H&M, Zara, Nike, Adidas, Boss, BP., Burberry, Eileen Fisher, J.Crew, KENZO, Levi's, Michael Kors, New Balance, Obey, O'Neill, CK, Roxy, Tommy, Tommy Bahama, Tory Burch, Versace, Vince, Zella, Uniqlo.
3. What are the main segments of the Mens T-Shirts?
The market segments include Application, Types.
4. Can you provide details about the market size?
The market size is estimated to be USD XXX million as of 2022.
5. What are some drivers contributing to market growth?
N/A
6. What are the notable trends driving market growth?
N/A
7. Are there any restraints impacting market growth?
N/A
8. Can you provide examples of recent developments in the market?
N/A
9. What pricing options are available for accessing the report?
Pricing options include single-user, multi-user, and enterprise licenses priced at USD 3950.00, USD 5925.00, and USD 7900.00 respectively.
10. Is the market size provided in terms of value or volume?
The market size is provided in terms of value, measured in million and volume, measured in K.
11. Are there any specific market keywords associated with the report?
Yes, the market keyword associated with the report is "Mens T-Shirts," which aids in identifying and referencing the specific market segment covered.
12. How do I determine which pricing option suits my needs best?
The pricing options vary based on user requirements and access needs. Individual users may opt for single-user licenses, while businesses requiring broader access may choose multi-user or enterprise licenses for cost-effective access to the report.
13. Are there any additional resources or data provided in the Mens T-Shirts report?
While the report offers comprehensive insights, it's advisable to review the specific contents or supplementary materials provided to ascertain if additional resources or data are available.
14. How can I stay updated on further developments or reports in the Mens T-Shirts?
To stay informed about further developments, trends, and reports in the Mens T-Shirts, consider subscribing to industry newsletters, following relevant companies and organizations, or regularly checking reputable industry news sources and publications.
Methodology
Step 1 - Identification of Relevant Samples Size from Population Database


Step 2 - Approaches for Defining Global Market Size (Value, Volume* & Price*)

Note*: In applicable scenarios
Step 3 - Data Sources
Primary Research
- Web Analytics
- Survey Reports
- Research Institute
- Latest Research Reports
- Opinion Leaders
Secondary Research
- Annual Reports
- White Paper
- Latest Press Release
- Industry Association
- Paid Database
- Investor Presentations

Step 4 - Data Triangulation
Involves using different sources of information in order to increase the validity of a study
These sources are likely to be stakeholders in a program - participants, other researchers, program staff, other community members, and so on.
Then we put all data in single framework & apply various statistical tools to find out the dynamic on the market.
During the analysis stage, feedback from the stakeholder groups would be compared to determine areas of agreement as well as areas of divergence
