

Key Insights
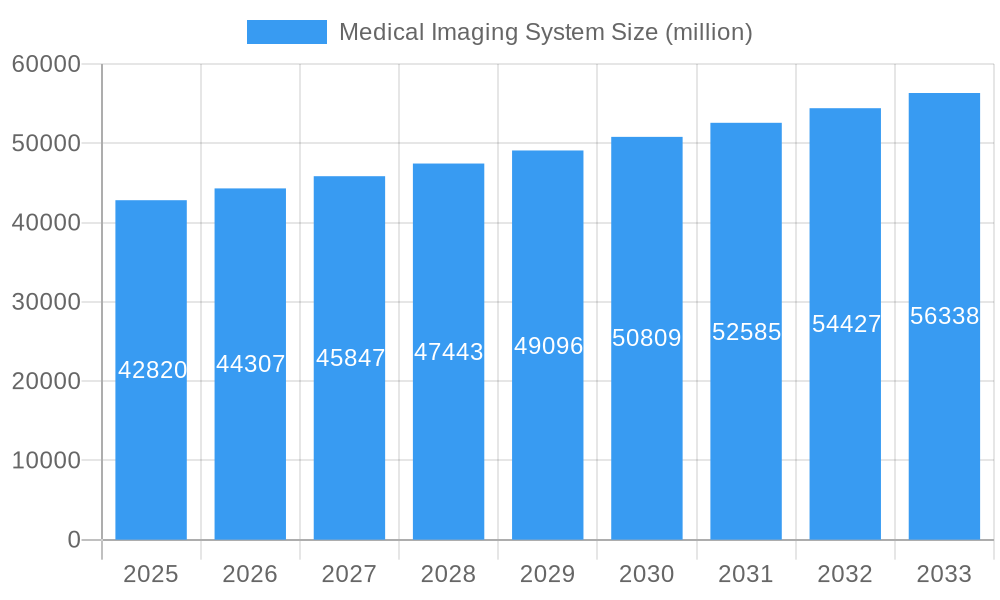
The global medical imaging systems market, valued at approximately $42.82 billion in 2025, is projected to experience steady growth, with a compound annual growth rate (CAGR) of 3.5% from 2025 to 2033. This expansion is driven by several key factors. Technological advancements, such as the development of AI-powered image analysis and improved resolution imaging modalities (e.g., higher-resolution MRI and CT scanners), are enhancing diagnostic accuracy and efficiency. The increasing prevalence of chronic diseases, particularly cardiovascular disease and cancer, necessitates more frequent and sophisticated imaging procedures, fueling market demand. Furthermore, the growing geriatric population requires more extensive diagnostic imaging, contributing to market growth. A rising focus on preventive healthcare and early disease detection further strengthens this trend. Key players like GE Healthcare, Siemens Healthineers, and Philips Healthcare are continuously investing in research and development, introducing innovative products and expanding their global reach.
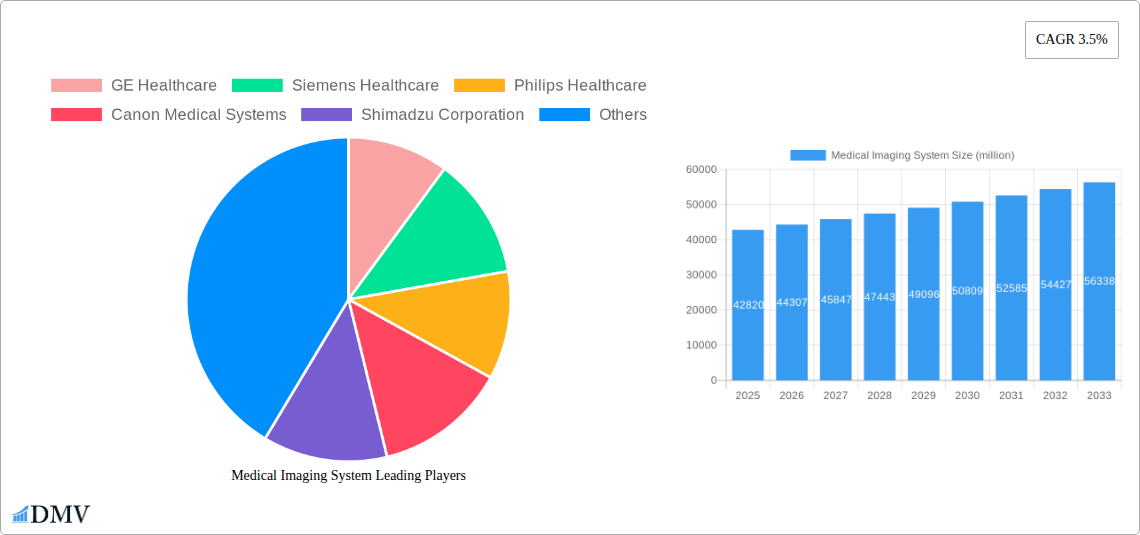
Medical Imaging System Market Size (In Billion)
However, the market faces certain restraints. High costs associated with acquiring and maintaining advanced imaging equipment can be a significant barrier for smaller healthcare facilities, particularly in developing economies. Stringent regulatory requirements for medical devices and the need for skilled professionals to operate and interpret images also pose challenges. The market is segmented based on modality (X-ray, CT, MRI, Ultrasound, etc.), application (cardiology, oncology, neurology, etc.), and end-user (hospitals, diagnostic centers, etc.). While precise regional breakdowns are unavailable, it’s reasonable to assume significant market penetration across North America and Europe, with emerging markets in Asia-Pacific and Latin America experiencing notable growth due to rising healthcare infrastructure development. The competitive landscape is characterized by established players and innovative startups, with mergers and acquisitions expected to shape the market dynamics in the coming years.
Medical Imaging System Company Market Share
Medical Imaging System Market Report: A Comprehensive Analysis (2019-2033)
This insightful report provides a comprehensive analysis of the global medical imaging system market, projecting a market value exceeding $XX million by 2033. It offers a detailed examination of market trends, technological advancements, leading players, and future growth opportunities. The report covers the historical period from 2019-2024, with 2025 as the base and estimated year, and forecasts extending to 2033. This in-depth study is crucial for stakeholders seeking to understand the dynamics of this rapidly evolving sector and make informed strategic decisions.
Medical Imaging System Market Composition & Trends
The global medical imaging system market, valued at $XX million in 2024, is characterized by a moderately concentrated landscape with key players holding significant market share. GE Healthcare, Siemens Healthcare, and Philips Healthcare collectively command a substantial portion (approximately XX%) of the market, reflecting their extensive product portfolios and global reach. However, smaller players are increasingly challenging the established players through technological innovation and niche market penetration.
Market Dynamics:
- Innovation Catalysts: The relentless pursuit of improved image quality, faster acquisition speeds, and reduced radiation exposure fuels continuous innovation in areas like AI-powered image analysis and advanced imaging modalities.
- Regulatory Landscape: Stringent regulatory approvals and safety standards influence market entry and product development, favoring companies with robust compliance strategies.
- Substitute Products: While medical imaging remains indispensable, alternative diagnostic techniques and telehealth solutions exert some competitive pressure.
- End-User Profiles: Hospitals, diagnostic imaging centers, and outpatient clinics are the major end-users, with demand patterns influenced by factors like healthcare infrastructure and disease prevalence.
- M&A Activities: The market has witnessed several significant mergers and acquisitions (M&As) in recent years, with total deal values exceeding $XX million. These activities often aim to expand product portfolios, enhance technological capabilities, and consolidate market share. Examples include [mention specific M&A deals with values if available, otherwise, state "Specific deal values are confidential"].
Market Share Distribution (2024):
- GE Healthcare: XX%
- Siemens Healthcare: XX%
- Philips Healthcare: XX%
- Others: XX%
Medical Imaging System Industry Evolution
The medical imaging system industry has experienced significant growth over the past decade, driven primarily by technological advancements, rising prevalence of chronic diseases, and increasing healthcare expenditure globally. From 2019 to 2024, the market exhibited a Compound Annual Growth Rate (CAGR) of approximately XX%, reaching $XX million in 2024. This growth trajectory is projected to continue, albeit at a slightly moderated pace, throughout the forecast period (2025-2033), reaching an estimated $XX million by 2033.
Technological advancements have been instrumental in shaping market evolution. The integration of artificial intelligence (AI) in image analysis is transforming diagnostic workflows, improving accuracy, and accelerating diagnosis times. The adoption of advanced imaging modalities such as molecular imaging and advanced ultrasound has broadened diagnostic capabilities. Furthermore, increasing demand for portable and point-of-care imaging solutions fuels the development of compact and user-friendly systems. The shift towards value-based care and the increasing focus on preventative healthcare are also influencing market dynamics, driving demand for efficient and cost-effective imaging solutions. Consumer demand has also shifted toward higher image quality, faster scan times and reduced exposure to ionizing radiation, prompting manufacturers to prioritize these aspects in their product development.
Leading Regions, Countries, or Segments in Medical Imaging System
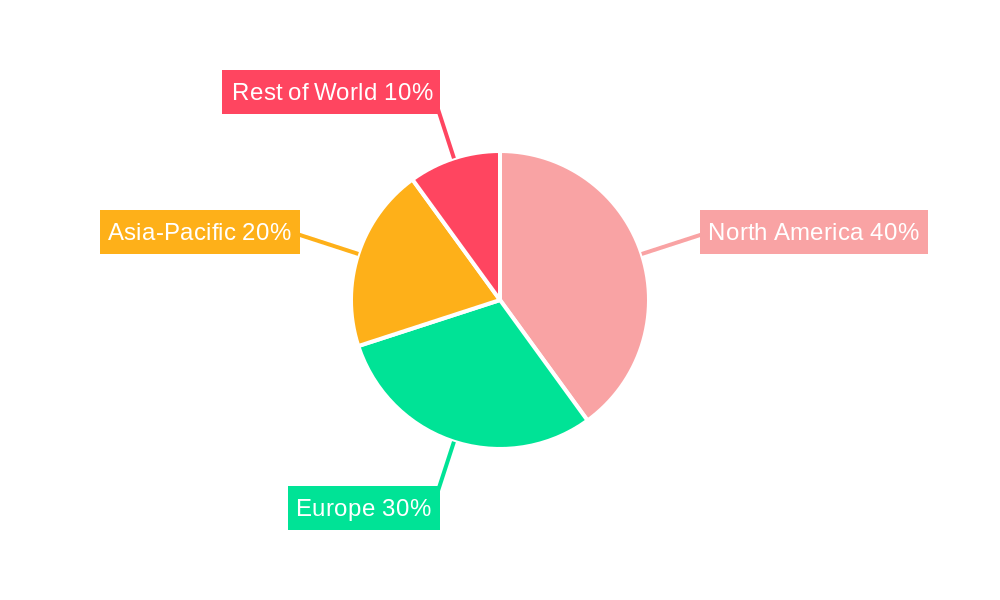
North America currently dominates the medical imaging system market, driven by factors like high healthcare expenditure, advanced healthcare infrastructure, and strong adoption rates of advanced imaging technologies.
Key Drivers of North American Dominance:
- High Healthcare Expenditure: Significant investments in healthcare infrastructure and technology support the market's growth.
- Technological Advancements: North America serves as a hub for medical technology innovation, with companies driving the development of advanced imaging modalities.
- Strong Regulatory Support: Favorable regulatory frameworks facilitate faster adoption of new technologies.
- High Prevalence of Chronic Diseases: The increasing incidence of chronic diseases fuels the demand for diagnostic imaging services.
While North America leads, Europe and Asia-Pacific are also experiencing significant growth, albeit at varying rates. The European market is characterized by a strong regulatory environment and a focus on value-based healthcare, whereas the Asia-Pacific region demonstrates high growth potential due to increasing healthcare investments and rising awareness of preventive healthcare. Within segments, computed tomography (CT) and magnetic resonance imaging (MRI) dominate, reflecting their established utility and continuous technological advancements.
Medical Imaging System Product Innovations
Recent product innovations focus on enhancing image quality, reducing scan times, and improving workflow efficiency. AI-powered image analysis tools are increasingly incorporated into medical imaging systems, providing automated image interpretation and diagnostic support. Miniaturization and portability are also key trends, with the development of smaller and more mobile systems catering to the needs of remote healthcare settings and point-of-care diagnostics. The emergence of hybrid imaging systems, combining different modalities to provide comprehensive diagnostic information, further enhances the versatility and clinical utility of medical imaging technology. Specific examples include advancements in spectral CT, dual-energy X-ray absorptiometry (DEXA), and high-field MRI systems.
Propelling Factors for Medical Imaging System Growth
Several factors are driving the growth of the medical imaging system market. Technological advancements, including AI integration and the development of novel imaging modalities, are significantly improving diagnostic capabilities and workflow efficiency. Rising prevalence of chronic diseases like cancer and cardiovascular diseases is increasing the demand for diagnostic imaging services. Furthermore, expanding healthcare infrastructure, especially in emerging economies, and increasing healthcare expenditure are boosting market growth. Favorable government initiatives and regulatory support for advanced medical technologies also contribute to the market’s expansion.
Obstacles in the Medical Imaging System Market
Despite the substantial growth potential, several challenges hinder market expansion. Stringent regulatory requirements and lengthy approval processes can delay the market entry of new technologies. High costs associated with purchasing and maintaining advanced imaging systems, particularly in resource-constrained settings, can limit accessibility. Supply chain disruptions, particularly evident during recent global events, can affect the availability and pricing of imaging equipment and components. Intense competition among established players and the emergence of new entrants also poses challenges. These factors collectively contribute to a complex and dynamic market environment.
Future Opportunities in Medical Imaging System
Emerging opportunities in the medical imaging system market include the expansion of AI-powered diagnostic tools, the development of personalized medicine applications leveraging advanced imaging data, and the growing integration of medical imaging with telehealth platforms. New markets, particularly in developing economies experiencing increasing healthcare investments, offer substantial growth potential. Furthermore, the development of novel imaging modalities such as molecular imaging and theranostics holds promise for improved disease diagnosis and treatment.
Major Players in the Medical Imaging System Ecosystem
- GE Healthcare
- Siemens Healthcare
- Philips Healthcare
- Canon Medical Systems
- Shimadzu Corporation
- Hitachi Medical Corporation
- Fujifilm Holdings Corporation
- Carestream Health
- Samsung Medison
- Hologic, Inc.
- Fonar Corporation
- Medtronic
- HOYA Group
- Konica Minolta
- Varian
Key Developments in Medical Imaging System Industry
- 2022 Q4: GE Healthcare launched a new AI-powered image analysis software for improved diagnostic accuracy.
- 2023 Q1: Siemens Healthineers acquired a smaller medical imaging company, expanding its portfolio of advanced imaging modalities. (Specific details and values are confidential)
- 2023 Q2: Philips Healthcare introduced a new portable ultrasound system designed for point-of-care applications.
- 2024 Q3: Canon Medical Systems announced a significant investment in research and development for next-generation CT technology.
Strategic Medical Imaging System Market Forecast
The future of the medical imaging system market is bright, propelled by continuous technological innovation, increasing healthcare investments, and the rising prevalence of chronic diseases. The integration of AI and the development of novel imaging modalities are poised to further enhance diagnostic capabilities and improve patient outcomes. Emerging markets offer significant growth potential, while existing markets will benefit from continuous technological advancements. The market is expected to continue its robust growth trajectory, reaching substantial value by 2033, driven by these factors and the ongoing demand for efficient and accurate diagnostic tools.
Medical Imaging System Segmentation
-
1. Application
- 1.1. Hospitals
- 1.2. Clinics
- 1.3. Others
-
2. Types
- 2.1. X-ray Devices
- 2.2. Computed Tomography
- 2.3. Ultrasound Systems
- 2.4. Magnetic Resonance Imaging
- 2.5. Nuclear Imaging
- 2.6. Other
Medical Imaging System Segmentation By Geography
-
1. North America
- 1.1. United States
- 1.2. Canada
- 1.3. Mexico
-
2. South America
- 2.1. Brazil
- 2.2. Argentina
- 2.3. Rest of South America
-
3. Europe
- 3.1. United Kingdom
- 3.2. Germany
- 3.3. France
- 3.4. Italy
- 3.5. Spain
- 3.6. Russia
- 3.7. Benelux
- 3.8. Nordics
- 3.9. Rest of Europe
-
4. Middle East & Africa
- 4.1. Turkey
- 4.2. Israel
- 4.3. GCC
- 4.4. North Africa
- 4.5. South Africa
- 4.6. Rest of Middle East & Africa
-
5. Asia Pacific
- 5.1. China
- 5.2. India
- 5.3. Japan
- 5.4. South Korea
- 5.5. ASEAN
- 5.6. Oceania
- 5.7. Rest of Asia Pacific
Medical Imaging System Regional Market Share
Geographic Coverage of Medical Imaging System
Medical Imaging System REPORT HIGHLIGHTS
| Aspects | Details |
|---|---|
| Study Period | 2020-2034 |
| Base Year | 2025 |
| Estimated Year | 2026 |
| Forecast Period | 2026-2034 |
| Historical Period | 2020-2025 |
| Growth Rate | CAGR of 3.5% from 2020-2034 |
| Segmentation |
|
Table of Contents
- 1. Introduction
- 1.1. Research Scope
- 1.2. Market Segmentation
- 1.3. Research Methodology
- 1.4. Definitions and Assumptions
- 2. Executive Summary
- 2.1. Introduction
- 3. Market Dynamics
- 3.1. Introduction
- 3.2. Market Drivers
- 3.3. Market Restrains
- 3.4. Market Trends
- 4. Market Factor Analysis
- 4.1. Porters Five Forces
- 4.2. Supply/Value Chain
- 4.3. PESTEL analysis
- 4.4. Market Entropy
- 4.5. Patent/Trademark Analysis
- 5. Global Medical Imaging System Analysis, Insights and Forecast, 2020-2032
- 5.1. Market Analysis, Insights and Forecast - by Application
- 5.1.1. Hospitals
- 5.1.2. Clinics
- 5.1.3. Others
- 5.2. Market Analysis, Insights and Forecast - by Types
- 5.2.1. X-ray Devices
- 5.2.2. Computed Tomography
- 5.2.3. Ultrasound Systems
- 5.2.4. Magnetic Resonance Imaging
- 5.2.5. Nuclear Imaging
- 5.2.6. Other
- 5.3. Market Analysis, Insights and Forecast - by Region
- 5.3.1. North America
- 5.3.2. South America
- 5.3.3. Europe
- 5.3.4. Middle East & Africa
- 5.3.5. Asia Pacific
- 5.1. Market Analysis, Insights and Forecast - by Application
- 6. North America Medical Imaging System Analysis, Insights and Forecast, 2020-2032
- 6.1. Market Analysis, Insights and Forecast - by Application
- 6.1.1. Hospitals
- 6.1.2. Clinics
- 6.1.3. Others
- 6.2. Market Analysis, Insights and Forecast - by Types
- 6.2.1. X-ray Devices
- 6.2.2. Computed Tomography
- 6.2.3. Ultrasound Systems
- 6.2.4. Magnetic Resonance Imaging
- 6.2.5. Nuclear Imaging
- 6.2.6. Other
- 6.1. Market Analysis, Insights and Forecast - by Application
- 7. South America Medical Imaging System Analysis, Insights and Forecast, 2020-2032
- 7.1. Market Analysis, Insights and Forecast - by Application
- 7.1.1. Hospitals
- 7.1.2. Clinics
- 7.1.3. Others
- 7.2. Market Analysis, Insights and Forecast - by Types
- 7.2.1. X-ray Devices
- 7.2.2. Computed Tomography
- 7.2.3. Ultrasound Systems
- 7.2.4. Magnetic Resonance Imaging
- 7.2.5. Nuclear Imaging
- 7.2.6. Other
- 7.1. Market Analysis, Insights and Forecast - by Application
- 8. Europe Medical Imaging System Analysis, Insights and Forecast, 2020-2032
- 8.1. Market Analysis, Insights and Forecast - by Application
- 8.1.1. Hospitals
- 8.1.2. Clinics
- 8.1.3. Others
- 8.2. Market Analysis, Insights and Forecast - by Types
- 8.2.1. X-ray Devices
- 8.2.2. Computed Tomography
- 8.2.3. Ultrasound Systems
- 8.2.4. Magnetic Resonance Imaging
- 8.2.5. Nuclear Imaging
- 8.2.6. Other
- 8.1. Market Analysis, Insights and Forecast - by Application
- 9. Middle East & Africa Medical Imaging System Analysis, Insights and Forecast, 2020-2032
- 9.1. Market Analysis, Insights and Forecast - by Application
- 9.1.1. Hospitals
- 9.1.2. Clinics
- 9.1.3. Others
- 9.2. Market Analysis, Insights and Forecast - by Types
- 9.2.1. X-ray Devices
- 9.2.2. Computed Tomography
- 9.2.3. Ultrasound Systems
- 9.2.4. Magnetic Resonance Imaging
- 9.2.5. Nuclear Imaging
- 9.2.6. Other
- 9.1. Market Analysis, Insights and Forecast - by Application
- 10. Asia Pacific Medical Imaging System Analysis, Insights and Forecast, 2020-2032
- 10.1. Market Analysis, Insights and Forecast - by Application
- 10.1.1. Hospitals
- 10.1.2. Clinics
- 10.1.3. Others
- 10.2. Market Analysis, Insights and Forecast - by Types
- 10.2.1. X-ray Devices
- 10.2.2. Computed Tomography
- 10.2.3. Ultrasound Systems
- 10.2.4. Magnetic Resonance Imaging
- 10.2.5. Nuclear Imaging
- 10.2.6. Other
- 10.1. Market Analysis, Insights and Forecast - by Application
- 11. Competitive Analysis
- 11.1. Global Market Share Analysis 2025
- 11.2. Company Profiles
- 11.2.1 GE Healthcare
- 11.2.1.1. Overview
- 11.2.1.2. Products
- 11.2.1.3. SWOT Analysis
- 11.2.1.4. Recent Developments
- 11.2.1.5. Financials (Based on Availability)
- 11.2.2 Siemens Healthcare
- 11.2.2.1. Overview
- 11.2.2.2. Products
- 11.2.2.3. SWOT Analysis
- 11.2.2.4. Recent Developments
- 11.2.2.5. Financials (Based on Availability)
- 11.2.3 Philips Healthcare
- 11.2.3.1. Overview
- 11.2.3.2. Products
- 11.2.3.3. SWOT Analysis
- 11.2.3.4. Recent Developments
- 11.2.3.5. Financials (Based on Availability)
- 11.2.4 Canon Medical Systems
- 11.2.4.1. Overview
- 11.2.4.2. Products
- 11.2.4.3. SWOT Analysis
- 11.2.4.4. Recent Developments
- 11.2.4.5. Financials (Based on Availability)
- 11.2.5 Shimadzu Corporation
- 11.2.5.1. Overview
- 11.2.5.2. Products
- 11.2.5.3. SWOT Analysis
- 11.2.5.4. Recent Developments
- 11.2.5.5. Financials (Based on Availability)
- 11.2.6 Hitachi Medical Corporation
- 11.2.6.1. Overview
- 11.2.6.2. Products
- 11.2.6.3. SWOT Analysis
- 11.2.6.4. Recent Developments
- 11.2.6.5. Financials (Based on Availability)
- 11.2.7 Fujifilm Holdings Corporation
- 11.2.7.1. Overview
- 11.2.7.2. Products
- 11.2.7.3. SWOT Analysis
- 11.2.7.4. Recent Developments
- 11.2.7.5. Financials (Based on Availability)
- 11.2.8 Carestream Health
- 11.2.8.1. Overview
- 11.2.8.2. Products
- 11.2.8.3. SWOT Analysis
- 11.2.8.4. Recent Developments
- 11.2.8.5. Financials (Based on Availability)
- 11.2.9 Samsung Medison
- 11.2.9.1. Overview
- 11.2.9.2. Products
- 11.2.9.3. SWOT Analysis
- 11.2.9.4. Recent Developments
- 11.2.9.5. Financials (Based on Availability)
- 11.2.10 Hologic
- 11.2.10.1. Overview
- 11.2.10.2. Products
- 11.2.10.3. SWOT Analysis
- 11.2.10.4. Recent Developments
- 11.2.10.5. Financials (Based on Availability)
- 11.2.11 Inc.
- 11.2.11.1. Overview
- 11.2.11.2. Products
- 11.2.11.3. SWOT Analysis
- 11.2.11.4. Recent Developments
- 11.2.11.5. Financials (Based on Availability)
- 11.2.12 Fonar Corporation
- 11.2.12.1. Overview
- 11.2.12.2. Products
- 11.2.12.3. SWOT Analysis
- 11.2.12.4. Recent Developments
- 11.2.12.5. Financials (Based on Availability)
- 11.2.13 Medtronic
- 11.2.13.1. Overview
- 11.2.13.2. Products
- 11.2.13.3. SWOT Analysis
- 11.2.13.4. Recent Developments
- 11.2.13.5. Financials (Based on Availability)
- 11.2.14 HOYA Group
- 11.2.14.1. Overview
- 11.2.14.2. Products
- 11.2.14.3. SWOT Analysis
- 11.2.14.4. Recent Developments
- 11.2.14.5. Financials (Based on Availability)
- 11.2.15 Konica Minolta
- 11.2.15.1. Overview
- 11.2.15.2. Products
- 11.2.15.3. SWOT Analysis
- 11.2.15.4. Recent Developments
- 11.2.15.5. Financials (Based on Availability)
- 11.2.16 Varian
- 11.2.16.1. Overview
- 11.2.16.2. Products
- 11.2.16.3. SWOT Analysis
- 11.2.16.4. Recent Developments
- 11.2.16.5. Financials (Based on Availability)
- 11.2.1 GE Healthcare
List of Figures
- Figure 1: Global Medical Imaging System Revenue Breakdown (million, %) by Region 2025 & 2033
- Figure 2: North America Medical Imaging System Revenue (million), by Application 2025 & 2033
- Figure 3: North America Medical Imaging System Revenue Share (%), by Application 2025 & 2033
- Figure 4: North America Medical Imaging System Revenue (million), by Types 2025 & 2033
- Figure 5: North America Medical Imaging System Revenue Share (%), by Types 2025 & 2033
- Figure 6: North America Medical Imaging System Revenue (million), by Country 2025 & 2033
- Figure 7: North America Medical Imaging System Revenue Share (%), by Country 2025 & 2033
- Figure 8: South America Medical Imaging System Revenue (million), by Application 2025 & 2033
- Figure 9: South America Medical Imaging System Revenue Share (%), by Application 2025 & 2033
- Figure 10: South America Medical Imaging System Revenue (million), by Types 2025 & 2033
- Figure 11: South America Medical Imaging System Revenue Share (%), by Types 2025 & 2033
- Figure 12: South America Medical Imaging System Revenue (million), by Country 2025 & 2033
- Figure 13: South America Medical Imaging System Revenue Share (%), by Country 2025 & 2033
- Figure 14: Europe Medical Imaging System Revenue (million), by Application 2025 & 2033
- Figure 15: Europe Medical Imaging System Revenue Share (%), by Application 2025 & 2033
- Figure 16: Europe Medical Imaging System Revenue (million), by Types 2025 & 2033
- Figure 17: Europe Medical Imaging System Revenue Share (%), by Types 2025 & 2033
- Figure 18: Europe Medical Imaging System Revenue (million), by Country 2025 & 2033
- Figure 19: Europe Medical Imaging System Revenue Share (%), by Country 2025 & 2033
- Figure 20: Middle East & Africa Medical Imaging System Revenue (million), by Application 2025 & 2033
- Figure 21: Middle East & Africa Medical Imaging System Revenue Share (%), by Application 2025 & 2033
- Figure 22: Middle East & Africa Medical Imaging System Revenue (million), by Types 2025 & 2033
- Figure 23: Middle East & Africa Medical Imaging System Revenue Share (%), by Types 2025 & 2033
- Figure 24: Middle East & Africa Medical Imaging System Revenue (million), by Country 2025 & 2033
- Figure 25: Middle East & Africa Medical Imaging System Revenue Share (%), by Country 2025 & 2033
- Figure 26: Asia Pacific Medical Imaging System Revenue (million), by Application 2025 & 2033
- Figure 27: Asia Pacific Medical Imaging System Revenue Share (%), by Application 2025 & 2033
- Figure 28: Asia Pacific Medical Imaging System Revenue (million), by Types 2025 & 2033
- Figure 29: Asia Pacific Medical Imaging System Revenue Share (%), by Types 2025 & 2033
- Figure 30: Asia Pacific Medical Imaging System Revenue (million), by Country 2025 & 2033
- Figure 31: Asia Pacific Medical Imaging System Revenue Share (%), by Country 2025 & 2033
List of Tables
- Table 1: Global Medical Imaging System Revenue million Forecast, by Application 2020 & 2033
- Table 2: Global Medical Imaging System Revenue million Forecast, by Types 2020 & 2033
- Table 3: Global Medical Imaging System Revenue million Forecast, by Region 2020 & 2033
- Table 4: Global Medical Imaging System Revenue million Forecast, by Application 2020 & 2033
- Table 5: Global Medical Imaging System Revenue million Forecast, by Types 2020 & 2033
- Table 6: Global Medical Imaging System Revenue million Forecast, by Country 2020 & 2033
- Table 7: United States Medical Imaging System Revenue (million) Forecast, by Application 2020 & 2033
- Table 8: Canada Medical Imaging System Revenue (million) Forecast, by Application 2020 & 2033
- Table 9: Mexico Medical Imaging System Revenue (million) Forecast, by Application 2020 & 2033
- Table 10: Global Medical Imaging System Revenue million Forecast, by Application 2020 & 2033
- Table 11: Global Medical Imaging System Revenue million Forecast, by Types 2020 & 2033
- Table 12: Global Medical Imaging System Revenue million Forecast, by Country 2020 & 2033
- Table 13: Brazil Medical Imaging System Revenue (million) Forecast, by Application 2020 & 2033
- Table 14: Argentina Medical Imaging System Revenue (million) Forecast, by Application 2020 & 2033
- Table 15: Rest of South America Medical Imaging System Revenue (million) Forecast, by Application 2020 & 2033
- Table 16: Global Medical Imaging System Revenue million Forecast, by Application 2020 & 2033
- Table 17: Global Medical Imaging System Revenue million Forecast, by Types 2020 & 2033
- Table 18: Global Medical Imaging System Revenue million Forecast, by Country 2020 & 2033
- Table 19: United Kingdom Medical Imaging System Revenue (million) Forecast, by Application 2020 & 2033
- Table 20: Germany Medical Imaging System Revenue (million) Forecast, by Application 2020 & 2033
- Table 21: France Medical Imaging System Revenue (million) Forecast, by Application 2020 & 2033
- Table 22: Italy Medical Imaging System Revenue (million) Forecast, by Application 2020 & 2033
- Table 23: Spain Medical Imaging System Revenue (million) Forecast, by Application 2020 & 2033
- Table 24: Russia Medical Imaging System Revenue (million) Forecast, by Application 2020 & 2033
- Table 25: Benelux Medical Imaging System Revenue (million) Forecast, by Application 2020 & 2033
- Table 26: Nordics Medical Imaging System Revenue (million) Forecast, by Application 2020 & 2033
- Table 27: Rest of Europe Medical Imaging System Revenue (million) Forecast, by Application 2020 & 2033
- Table 28: Global Medical Imaging System Revenue million Forecast, by Application 2020 & 2033
- Table 29: Global Medical Imaging System Revenue million Forecast, by Types 2020 & 2033
- Table 30: Global Medical Imaging System Revenue million Forecast, by Country 2020 & 2033
- Table 31: Turkey Medical Imaging System Revenue (million) Forecast, by Application 2020 & 2033
- Table 32: Israel Medical Imaging System Revenue (million) Forecast, by Application 2020 & 2033
- Table 33: GCC Medical Imaging System Revenue (million) Forecast, by Application 2020 & 2033
- Table 34: North Africa Medical Imaging System Revenue (million) Forecast, by Application 2020 & 2033
- Table 35: South Africa Medical Imaging System Revenue (million) Forecast, by Application 2020 & 2033
- Table 36: Rest of Middle East & Africa Medical Imaging System Revenue (million) Forecast, by Application 2020 & 2033
- Table 37: Global Medical Imaging System Revenue million Forecast, by Application 2020 & 2033
- Table 38: Global Medical Imaging System Revenue million Forecast, by Types 2020 & 2033
- Table 39: Global Medical Imaging System Revenue million Forecast, by Country 2020 & 2033
- Table 40: China Medical Imaging System Revenue (million) Forecast, by Application 2020 & 2033
- Table 41: India Medical Imaging System Revenue (million) Forecast, by Application 2020 & 2033
- Table 42: Japan Medical Imaging System Revenue (million) Forecast, by Application 2020 & 2033
- Table 43: South Korea Medical Imaging System Revenue (million) Forecast, by Application 2020 & 2033
- Table 44: ASEAN Medical Imaging System Revenue (million) Forecast, by Application 2020 & 2033
- Table 45: Oceania Medical Imaging System Revenue (million) Forecast, by Application 2020 & 2033
- Table 46: Rest of Asia Pacific Medical Imaging System Revenue (million) Forecast, by Application 2020 & 2033
Frequently Asked Questions
1. What is the projected Compound Annual Growth Rate (CAGR) of the Medical Imaging System?
The projected CAGR is approximately 3.5%.
2. Which companies are prominent players in the Medical Imaging System?
Key companies in the market include GE Healthcare, Siemens Healthcare, Philips Healthcare, Canon Medical Systems, Shimadzu Corporation, Hitachi Medical Corporation, Fujifilm Holdings Corporation, Carestream Health, Samsung Medison, Hologic, Inc., Fonar Corporation, Medtronic, HOYA Group, Konica Minolta, Varian.
3. What are the main segments of the Medical Imaging System?
The market segments include Application, Types.
4. Can you provide details about the market size?
The market size is estimated to be USD 42820 million as of 2022.
5. What are some drivers contributing to market growth?
N/A
6. What are the notable trends driving market growth?
N/A
7. Are there any restraints impacting market growth?
N/A
8. Can you provide examples of recent developments in the market?
N/A
9. What pricing options are available for accessing the report?
Pricing options include single-user, multi-user, and enterprise licenses priced at USD 4900.00, USD 7350.00, and USD 9800.00 respectively.
10. Is the market size provided in terms of value or volume?
The market size is provided in terms of value, measured in million.
11. Are there any specific market keywords associated with the report?
Yes, the market keyword associated with the report is "Medical Imaging System," which aids in identifying and referencing the specific market segment covered.
12. How do I determine which pricing option suits my needs best?
The pricing options vary based on user requirements and access needs. Individual users may opt for single-user licenses, while businesses requiring broader access may choose multi-user or enterprise licenses for cost-effective access to the report.
13. Are there any additional resources or data provided in the Medical Imaging System report?
While the report offers comprehensive insights, it's advisable to review the specific contents or supplementary materials provided to ascertain if additional resources or data are available.
14. How can I stay updated on further developments or reports in the Medical Imaging System?
To stay informed about further developments, trends, and reports in the Medical Imaging System, consider subscribing to industry newsletters, following relevant companies and organizations, or regularly checking reputable industry news sources and publications.
Methodology
Step 1 - Identification of Relevant Samples Size from Population Database


Step 2 - Approaches for Defining Global Market Size (Value, Volume* & Price*)

Note*: In applicable scenarios
Step 3 - Data Sources
Primary Research
- Web Analytics
- Survey Reports
- Research Institute
- Latest Research Reports
- Opinion Leaders
Secondary Research
- Annual Reports
- White Paper
- Latest Press Release
- Industry Association
- Paid Database
- Investor Presentations

Step 4 - Data Triangulation
Involves using different sources of information in order to increase the validity of a study
These sources are likely to be stakeholders in a program - participants, other researchers, program staff, other community members, and so on.
Then we put all data in single framework & apply various statistical tools to find out the dynamic on the market.
During the analysis stage, feedback from the stakeholder groups would be compared to determine areas of agreement as well as areas of divergence