

Key Insights
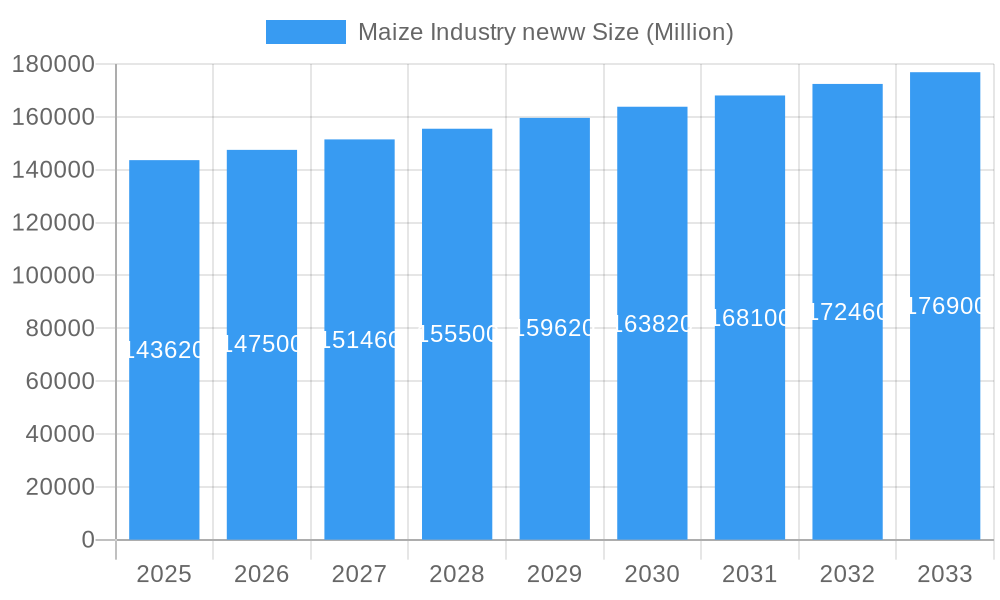
The global maize market, valued at $143.62 billion in 2025, is projected to experience steady growth, driven by increasing demand from the food and beverage, feed, and biofuel sectors. A compound annual growth rate (CAGR) of 3.01% from 2025 to 2033 indicates a significant expansion over the forecast period. Key drivers include rising global populations necessitating increased food production, the growing use of maize in animal feed, and the expanding biofuel industry's reliance on maize as a sustainable feedstock. Market segmentation reveals hybrid seeds as a dominant product type, with strong demand across diverse regions. North America, particularly the United States and Canada, and Asia-Pacific, led by China and India, are expected to represent significant market shares due to large-scale maize production and consumption. While the market faces challenges such as fluctuating weather patterns impacting yields and price volatility, ongoing research and development in hybrid seed technologies and improved agricultural practices are mitigating these risks. The competitive landscape is marked by the presence of major players like ADM, Syngenta, Bayer, Bunge, Cargill, and Corteva, all engaged in enhancing productivity and exploring innovative applications of maize. This competitive dynamic fuels innovation and ensures consistent product development to meet evolving consumer and industrial demands.
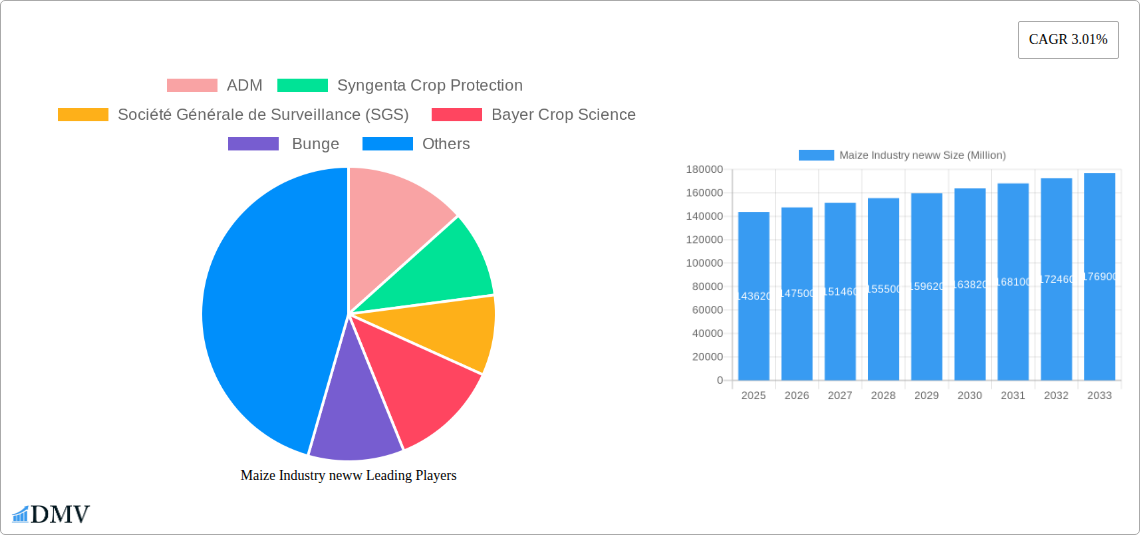
Maize Industry neww Market Size (In Billion)
The consistent growth trajectory of the maize market is expected to continue, fueled by factors such as increasing investments in agricultural technologies aimed at improving crop yields and disease resistance. Furthermore, governmental support for sustainable agricultural practices and the growing focus on food security are bolstering market expansion. Regional variations in growth rates are anticipated, with developing economies in Asia-Pacific and parts of South America potentially exhibiting faster growth than mature markets in North America and Europe. This regional disparity is largely attributed to the expanding middle class and changing dietary habits within these regions. The diversification of maize applications, including the exploration of its use in novel food products and industrial materials, will contribute to long-term growth and resilience in the maize market. The market's ongoing evolution necessitates the adaptation of industry players towards sustainability and innovation, focusing on environmentally friendly practices and advanced technologies to remain competitive and meet evolving consumer demands.
Maize Industry neww Company Market Share
Maize Industry: A Comprehensive Market Report (2019-2033)
This in-depth report provides a comprehensive analysis of the global maize industry, offering invaluable insights for stakeholders across the value chain. From seed production to end-use applications, we examine market dynamics, competitive landscapes, and future growth projections, covering the period 2019-2033, with a focus on 2025. The report unveils key trends, challenges, and opportunities, empowering businesses to make strategic decisions in this vital agricultural sector. With a market valued at over XX Million USD, the maize industry presents significant potential for growth and investment.
Maize Industry Market Composition & Trends
This section delves into the intricate structure of the maize market, examining market concentration, innovation, regulatory factors, and competitive activities. We analyze the market share distribution amongst key players like ADM, Cargill, Incorporated, Bunge Limited, and Corteva Agriscience, revealing the competitive intensity and potential for future consolidation. The report also explores the impact of substitute products and the evolving regulatory landscape on market dynamics.
- Market Concentration: Analysis of market share held by top 10 players, revealing concentration levels and competitive dynamics. We estimate the top 5 players hold approximately XX Million USD in combined revenue.
- Innovation Catalysts: Examination of R&D investments in hybrid seed technologies, improved crop protection solutions (Syngenta Crop Protection, Bayer Crop Science), and enhanced processing techniques.
- Regulatory Landscape: Assessment of government policies influencing maize production, trade, and processing, with a regional focus.
- Substitute Products: Analysis of alternative feedstocks and their impact on maize demand in various end-use segments.
- End-User Profiles: Detailed analysis of consumption patterns across Food & Beverage, Feed, and Biofuels sectors, quantifying demand by segment.
- M&A Activities: Review of significant mergers and acquisitions (M&A) in the industry during the historical period (2019-2024), including deal values (e.g., XX Million USD deals in 2022). The report will identify trends and implications for future consolidation.
Maize Industry Industry Evolution
This section analyzes the evolutionary trajectory of the maize industry, encompassing market growth patterns, technological advancements, and shifts in consumer preferences. We examine the growth rate for different maize types (Yellow Maize, White Maize, etc.) and across various segments during the study period. This includes in-depth discussions on technological breakthroughs and how they're impacting efficiency and production volume. We discuss the influence of consumer demand for sustainably produced maize and the impact on the industry's response to these shifting preferences. Data points will include precise growth rates (e.g., a projected XX% CAGR in the feed segment from 2025 to 2033) and adoption rates for new technologies.
Leading Regions, Countries, or Segments in Maize Industry
This section pinpoints the leading regions, countries, and segments within the maize industry. We identify the dominant product type (e.g., Yellow Maize, representing XX Million USD in revenue) and end-use sector (e.g., Feed, accounting for XX% of total consumption) based on quantitative data and analysis.
- Key Drivers (Bullet Points):
- Investment trends in specific regions or segments.
- Government support and regulatory frameworks.
- Technological advancements driving production efficiency and yield.
- Favorable climatic conditions in key production areas.
- Dominance Factors (Paragraphs): Detailed analysis explaining the reasons for the dominance of specific regions, countries, or segments, including factors such as production efficiency, access to markets, and favorable government policies.
Maize Industry Product Innovations
This section highlights recent advancements in maize products, including improved hybrid seed varieties offering higher yields and pest resistance, and the development of specialized maize varieties for specific end-uses, such as those optimized for biofuel production. The unique selling propositions of these innovations and their performance metrics will be highlighted. Furthermore, we will showcase how technological advancements are increasing efficiency and profitability across the value chain.
Propelling Factors for Maize Industry Growth
Several factors are driving the growth of the maize industry. Technological advancements in agricultural practices (e.g., precision farming techniques) have increased yields and efficiency. Favorable economic conditions in certain regions and strong demand from the food and beverage sector contribute significantly. Moreover, government initiatives supporting agricultural development and biofuel production further boost market expansion.
Obstacles in the Maize Industry Market
Despite the growth potential, the maize industry faces challenges including unpredictable weather patterns leading to harvest variations and impacting overall production. Supply chain disruptions caused by geopolitical events and logistics issues, and heightened competition from alternative crops and substitute products influence market stability.
Future Opportunities in Maize Industry
Future opportunities abound, such as increased demand for biofuels, potentially driving significant growth in that segment. Expansion into new markets and the development of innovative maize products suited for specific applications (e.g., functional foods) hold promise. Advances in biotechnology and genetic engineering open doors for further improvements in yield and nutritional value.
Major Players in the Maize Industry Ecosystem
- ADM
- Syngenta Crop Protection
- Société Générale de Surveillance (SGS)
- Bayer Crop Science
- Bunge
- Bunge Limited
- Cargill, Incorporated
- Corteva Agriscience
- ADM
- Olam Group
Key Developments in Maize Industry Industry
- November 2021: Fufeng Group's plans to build a USD 700 Million corn wet milling plant in China signifies a major investment and expansion in the maize processing sector.
- May 2022: The Indian government's initiatives to boost maize production, including MSP announcements, highlight a national-level commitment to increase domestic supply.
- October 2022: The inauguration of a modern maize processing factory in Ghana underscores the increasing focus on value addition and local processing within the African maize industry.
Strategic Maize Industry Market Forecast
The maize industry is poised for continued growth, driven by rising global demand, technological advancements enhancing productivity and efficiency, and supportive government policies promoting agricultural development. The forecast period (2025-2033) shows significant market expansion across various segments, with particular growth expected in biofuel and specialized maize products. Continued innovation and strategic investments will shape the industry's future, creating opportunities for both established players and new entrants.
Maize Industry neww Segmentation
- 1. Production Analysis
- 2. Consumption Analysis
- 3. Import Market Analysis (Value & Volume)
- 4. Export Market Analysis (Value & Volume)
- 5. Price Trend Analysis
Maize Industry neww Segmentation By Geography
-
1. North America
- 1.1. United States
- 1.2. Canada
- 1.3. Mexico
-
2. Europe
- 2.1. Spain
- 2.2. Italy
- 2.3. France
- 2.4. Germany
- 2.5. Russia
-
3. Asia Pacific
- 3.1. India
- 3.2. China
- 3.3. Vietnam
-
4. South America
- 4.1. Brazil
- 4.2. Argentina
-
5. Africa
- 5.1. South Africa
- 5.2. Nigeria
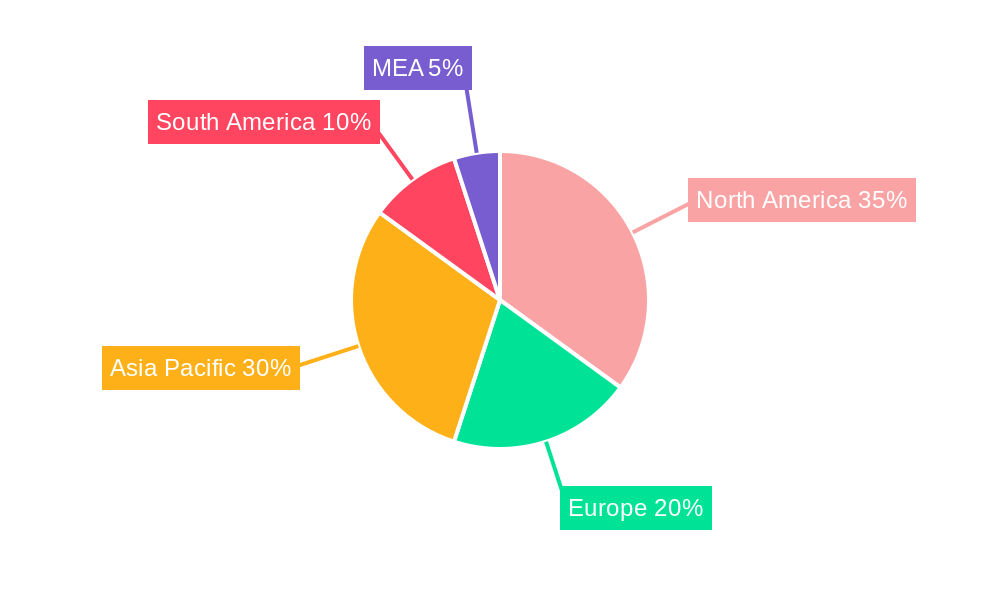
Maize Industry neww Regional Market Share
Geographic Coverage of Maize Industry neww
Maize Industry neww REPORT HIGHLIGHTS
| Aspects | Details |
|---|---|
| Study Period | 2020-2034 |
| Base Year | 2025 |
| Estimated Year | 2026 |
| Forecast Period | 2026-2034 |
| Historical Period | 2020-2025 |
| Growth Rate | CAGR of 3.01% from 2020-2034 |
| Segmentation |
|
Table of Contents
- 1. Introduction
- 1.1. Research Scope
- 1.2. Market Segmentation
- 1.3. Research Methodology
- 1.4. Definitions and Assumptions
- 2. Executive Summary
- 2.1. Introduction
- 3. Market Dynamics
- 3.1. Introduction
- 3.2. Market Drivers
- 3.3. Market Restrains
- 3.4. Market Trends
- 3.4.1. Increase in Demand for Animal-based Protein Sources
- 4. Market Factor Analysis
- 4.1. Porters Five Forces
- 4.2. Supply/Value Chain
- 4.3. PESTEL analysis
- 4.4. Market Entropy
- 4.5. Patent/Trademark Analysis
- 5. Global Maize Industry neww Analysis, Insights and Forecast, 2020-2032
- 5.1. Market Analysis, Insights and Forecast - by Production Analysis
- 5.2. Market Analysis, Insights and Forecast - by Consumption Analysis
- 5.3. Market Analysis, Insights and Forecast - by Import Market Analysis (Value & Volume)
- 5.4. Market Analysis, Insights and Forecast - by Export Market Analysis (Value & Volume)
- 5.5. Market Analysis, Insights and Forecast - by Price Trend Analysis
- 5.6. Market Analysis, Insights and Forecast - by Region
- 5.6.1. North America
- 5.6.2. Europe
- 5.6.3. Asia Pacific
- 5.6.4. South America
- 5.6.5. Africa
- 5.1. Market Analysis, Insights and Forecast - by Production Analysis
- 6. North America Maize Industry neww Analysis, Insights and Forecast, 2020-2032
- 6.1. Market Analysis, Insights and Forecast - by Production Analysis
- 6.2. Market Analysis, Insights and Forecast - by Consumption Analysis
- 6.3. Market Analysis, Insights and Forecast - by Import Market Analysis (Value & Volume)
- 6.4. Market Analysis, Insights and Forecast - by Export Market Analysis (Value & Volume)
- 6.5. Market Analysis, Insights and Forecast - by Price Trend Analysis
- 6.1. Market Analysis, Insights and Forecast - by Production Analysis
- 7. Europe Maize Industry neww Analysis, Insights and Forecast, 2020-2032
- 7.1. Market Analysis, Insights and Forecast - by Production Analysis
- 7.2. Market Analysis, Insights and Forecast - by Consumption Analysis
- 7.3. Market Analysis, Insights and Forecast - by Import Market Analysis (Value & Volume)
- 7.4. Market Analysis, Insights and Forecast - by Export Market Analysis (Value & Volume)
- 7.5. Market Analysis, Insights and Forecast - by Price Trend Analysis
- 7.1. Market Analysis, Insights and Forecast - by Production Analysis
- 8. Asia Pacific Maize Industry neww Analysis, Insights and Forecast, 2020-2032
- 8.1. Market Analysis, Insights and Forecast - by Production Analysis
- 8.2. Market Analysis, Insights and Forecast - by Consumption Analysis
- 8.3. Market Analysis, Insights and Forecast - by Import Market Analysis (Value & Volume)
- 8.4. Market Analysis, Insights and Forecast - by Export Market Analysis (Value & Volume)
- 8.5. Market Analysis, Insights and Forecast - by Price Trend Analysis
- 8.1. Market Analysis, Insights and Forecast - by Production Analysis
- 9. South America Maize Industry neww Analysis, Insights and Forecast, 2020-2032
- 9.1. Market Analysis, Insights and Forecast - by Production Analysis
- 9.2. Market Analysis, Insights and Forecast - by Consumption Analysis
- 9.3. Market Analysis, Insights and Forecast - by Import Market Analysis (Value & Volume)
- 9.4. Market Analysis, Insights and Forecast - by Export Market Analysis (Value & Volume)
- 9.5. Market Analysis, Insights and Forecast - by Price Trend Analysis
- 9.1. Market Analysis, Insights and Forecast - by Production Analysis
- 10. Africa Maize Industry neww Analysis, Insights and Forecast, 2020-2032
- 10.1. Market Analysis, Insights and Forecast - by Production Analysis
- 10.2. Market Analysis, Insights and Forecast - by Consumption Analysis
- 10.3. Market Analysis, Insights and Forecast - by Import Market Analysis (Value & Volume)
- 10.4. Market Analysis, Insights and Forecast - by Export Market Analysis (Value & Volume)
- 10.5. Market Analysis, Insights and Forecast - by Price Trend Analysis
- 10.1. Market Analysis, Insights and Forecast - by Production Analysis
- 11. Competitive Analysis
- 11.1. Global Market Share Analysis 2025
- 11.2. Company Profiles
- 11.2.1 ADM
- 11.2.1.1. Overview
- 11.2.1.2. Products
- 11.2.1.3. SWOT Analysis
- 11.2.1.4. Recent Developments
- 11.2.1.5. Financials (Based on Availability)
- 11.2.2 Syngenta Crop Protection
- 11.2.2.1. Overview
- 11.2.2.2. Products
- 11.2.2.3. SWOT Analysis
- 11.2.2.4. Recent Developments
- 11.2.2.5. Financials (Based on Availability)
- 11.2.3 Société Générale de Surveillance (SGS)
- 11.2.3.1. Overview
- 11.2.3.2. Products
- 11.2.3.3. SWOT Analysis
- 11.2.3.4. Recent Developments
- 11.2.3.5. Financials (Based on Availability)
- 11.2.4 Bayer Crop Science
- 11.2.4.1. Overview
- 11.2.4.2. Products
- 11.2.4.3. SWOT Analysis
- 11.2.4.4. Recent Developments
- 11.2.4.5. Financials (Based on Availability)
- 11.2.5 Bunge
- 11.2.5.1. Overview
- 11.2.5.2. Products
- 11.2.5.3. SWOT Analysis
- 11.2.5.4. Recent Developments
- 11.2.5.5. Financials (Based on Availability)
- 11.2.6 Bunge Limited
- 11.2.6.1. Overview
- 11.2.6.2. Products
- 11.2.6.3. SWOT Analysis
- 11.2.6.4. Recent Developments
- 11.2.6.5. Financials (Based on Availability)
- 11.2.7 Cargill Incorporated
- 11.2.7.1. Overview
- 11.2.7.2. Products
- 11.2.7.3. SWOT Analysis
- 11.2.7.4. Recent Developments
- 11.2.7.5. Financials (Based on Availability)
- 11.2.8 Corteva Agriscience
- 11.2.8.1. Overview
- 11.2.8.2. Products
- 11.2.8.3. SWOT Analysis
- 11.2.8.4. Recent Developments
- 11.2.8.5. Financials (Based on Availability)
- 11.2.9 ADM
- 11.2.9.1. Overview
- 11.2.9.2. Products
- 11.2.9.3. SWOT Analysis
- 11.2.9.4. Recent Developments
- 11.2.9.5. Financials (Based on Availability)
- 11.2.10 Olam Group
- 11.2.10.1. Overview
- 11.2.10.2. Products
- 11.2.10.3. SWOT Analysis
- 11.2.10.4. Recent Developments
- 11.2.10.5. Financials (Based on Availability)
- 11.2.1 ADM
List of Figures
- Figure 1: Global Maize Industry neww Revenue Breakdown (Million, %) by Region 2025 & 2033
- Figure 2: Global Maize Industry neww Volume Breakdown (Kiloton, %) by Region 2025 & 2033
- Figure 3: North America Maize Industry neww Revenue (Million), by Production Analysis 2025 & 2033
- Figure 4: North America Maize Industry neww Volume (Kiloton), by Production Analysis 2025 & 2033
- Figure 5: North America Maize Industry neww Revenue Share (%), by Production Analysis 2025 & 2033
- Figure 6: North America Maize Industry neww Volume Share (%), by Production Analysis 2025 & 2033
- Figure 7: North America Maize Industry neww Revenue (Million), by Consumption Analysis 2025 & 2033
- Figure 8: North America Maize Industry neww Volume (Kiloton), by Consumption Analysis 2025 & 2033
- Figure 9: North America Maize Industry neww Revenue Share (%), by Consumption Analysis 2025 & 2033
- Figure 10: North America Maize Industry neww Volume Share (%), by Consumption Analysis 2025 & 2033
- Figure 11: North America Maize Industry neww Revenue (Million), by Import Market Analysis (Value & Volume) 2025 & 2033
- Figure 12: North America Maize Industry neww Volume (Kiloton), by Import Market Analysis (Value & Volume) 2025 & 2033
- Figure 13: North America Maize Industry neww Revenue Share (%), by Import Market Analysis (Value & Volume) 2025 & 2033
- Figure 14: North America Maize Industry neww Volume Share (%), by Import Market Analysis (Value & Volume) 2025 & 2033
- Figure 15: North America Maize Industry neww Revenue (Million), by Export Market Analysis (Value & Volume) 2025 & 2033
- Figure 16: North America Maize Industry neww Volume (Kiloton), by Export Market Analysis (Value & Volume) 2025 & 2033
- Figure 17: North America Maize Industry neww Revenue Share (%), by Export Market Analysis (Value & Volume) 2025 & 2033
- Figure 18: North America Maize Industry neww Volume Share (%), by Export Market Analysis (Value & Volume) 2025 & 2033
- Figure 19: North America Maize Industry neww Revenue (Million), by Price Trend Analysis 2025 & 2033
- Figure 20: North America Maize Industry neww Volume (Kiloton), by Price Trend Analysis 2025 & 2033
- Figure 21: North America Maize Industry neww Revenue Share (%), by Price Trend Analysis 2025 & 2033
- Figure 22: North America Maize Industry neww Volume Share (%), by Price Trend Analysis 2025 & 2033
- Figure 23: North America Maize Industry neww Revenue (Million), by Country 2025 & 2033
- Figure 24: North America Maize Industry neww Volume (Kiloton), by Country 2025 & 2033
- Figure 25: North America Maize Industry neww Revenue Share (%), by Country 2025 & 2033
- Figure 26: North America Maize Industry neww Volume Share (%), by Country 2025 & 2033
- Figure 27: Europe Maize Industry neww Revenue (Million), by Production Analysis 2025 & 2033
- Figure 28: Europe Maize Industry neww Volume (Kiloton), by Production Analysis 2025 & 2033
- Figure 29: Europe Maize Industry neww Revenue Share (%), by Production Analysis 2025 & 2033
- Figure 30: Europe Maize Industry neww Volume Share (%), by Production Analysis 2025 & 2033
- Figure 31: Europe Maize Industry neww Revenue (Million), by Consumption Analysis 2025 & 2033
- Figure 32: Europe Maize Industry neww Volume (Kiloton), by Consumption Analysis 2025 & 2033
- Figure 33: Europe Maize Industry neww Revenue Share (%), by Consumption Analysis 2025 & 2033
- Figure 34: Europe Maize Industry neww Volume Share (%), by Consumption Analysis 2025 & 2033
- Figure 35: Europe Maize Industry neww Revenue (Million), by Import Market Analysis (Value & Volume) 2025 & 2033
- Figure 36: Europe Maize Industry neww Volume (Kiloton), by Import Market Analysis (Value & Volume) 2025 & 2033
- Figure 37: Europe Maize Industry neww Revenue Share (%), by Import Market Analysis (Value & Volume) 2025 & 2033
- Figure 38: Europe Maize Industry neww Volume Share (%), by Import Market Analysis (Value & Volume) 2025 & 2033
- Figure 39: Europe Maize Industry neww Revenue (Million), by Export Market Analysis (Value & Volume) 2025 & 2033
- Figure 40: Europe Maize Industry neww Volume (Kiloton), by Export Market Analysis (Value & Volume) 2025 & 2033
- Figure 41: Europe Maize Industry neww Revenue Share (%), by Export Market Analysis (Value & Volume) 2025 & 2033
- Figure 42: Europe Maize Industry neww Volume Share (%), by Export Market Analysis (Value & Volume) 2025 & 2033
- Figure 43: Europe Maize Industry neww Revenue (Million), by Price Trend Analysis 2025 & 2033
- Figure 44: Europe Maize Industry neww Volume (Kiloton), by Price Trend Analysis 2025 & 2033
- Figure 45: Europe Maize Industry neww Revenue Share (%), by Price Trend Analysis 2025 & 2033
- Figure 46: Europe Maize Industry neww Volume Share (%), by Price Trend Analysis 2025 & 2033
- Figure 47: Europe Maize Industry neww Revenue (Million), by Country 2025 & 2033
- Figure 48: Europe Maize Industry neww Volume (Kiloton), by Country 2025 & 2033
- Figure 49: Europe Maize Industry neww Revenue Share (%), by Country 2025 & 2033
- Figure 50: Europe Maize Industry neww Volume Share (%), by Country 2025 & 2033
- Figure 51: Asia Pacific Maize Industry neww Revenue (Million), by Production Analysis 2025 & 2033
- Figure 52: Asia Pacific Maize Industry neww Volume (Kiloton), by Production Analysis 2025 & 2033
- Figure 53: Asia Pacific Maize Industry neww Revenue Share (%), by Production Analysis 2025 & 2033
- Figure 54: Asia Pacific Maize Industry neww Volume Share (%), by Production Analysis 2025 & 2033
- Figure 55: Asia Pacific Maize Industry neww Revenue (Million), by Consumption Analysis 2025 & 2033
- Figure 56: Asia Pacific Maize Industry neww Volume (Kiloton), by Consumption Analysis 2025 & 2033
- Figure 57: Asia Pacific Maize Industry neww Revenue Share (%), by Consumption Analysis 2025 & 2033
- Figure 58: Asia Pacific Maize Industry neww Volume Share (%), by Consumption Analysis 2025 & 2033
- Figure 59: Asia Pacific Maize Industry neww Revenue (Million), by Import Market Analysis (Value & Volume) 2025 & 2033
- Figure 60: Asia Pacific Maize Industry neww Volume (Kiloton), by Import Market Analysis (Value & Volume) 2025 & 2033
- Figure 61: Asia Pacific Maize Industry neww Revenue Share (%), by Import Market Analysis (Value & Volume) 2025 & 2033
- Figure 62: Asia Pacific Maize Industry neww Volume Share (%), by Import Market Analysis (Value & Volume) 2025 & 2033
- Figure 63: Asia Pacific Maize Industry neww Revenue (Million), by Export Market Analysis (Value & Volume) 2025 & 2033
- Figure 64: Asia Pacific Maize Industry neww Volume (Kiloton), by Export Market Analysis (Value & Volume) 2025 & 2033
- Figure 65: Asia Pacific Maize Industry neww Revenue Share (%), by Export Market Analysis (Value & Volume) 2025 & 2033
- Figure 66: Asia Pacific Maize Industry neww Volume Share (%), by Export Market Analysis (Value & Volume) 2025 & 2033
- Figure 67: Asia Pacific Maize Industry neww Revenue (Million), by Price Trend Analysis 2025 & 2033
- Figure 68: Asia Pacific Maize Industry neww Volume (Kiloton), by Price Trend Analysis 2025 & 2033
- Figure 69: Asia Pacific Maize Industry neww Revenue Share (%), by Price Trend Analysis 2025 & 2033
- Figure 70: Asia Pacific Maize Industry neww Volume Share (%), by Price Trend Analysis 2025 & 2033
- Figure 71: Asia Pacific Maize Industry neww Revenue (Million), by Country 2025 & 2033
- Figure 72: Asia Pacific Maize Industry neww Volume (Kiloton), by Country 2025 & 2033
- Figure 73: Asia Pacific Maize Industry neww Revenue Share (%), by Country 2025 & 2033
- Figure 74: Asia Pacific Maize Industry neww Volume Share (%), by Country 2025 & 2033
- Figure 75: South America Maize Industry neww Revenue (Million), by Production Analysis 2025 & 2033
- Figure 76: South America Maize Industry neww Volume (Kiloton), by Production Analysis 2025 & 2033
- Figure 77: South America Maize Industry neww Revenue Share (%), by Production Analysis 2025 & 2033
- Figure 78: South America Maize Industry neww Volume Share (%), by Production Analysis 2025 & 2033
- Figure 79: South America Maize Industry neww Revenue (Million), by Consumption Analysis 2025 & 2033
- Figure 80: South America Maize Industry neww Volume (Kiloton), by Consumption Analysis 2025 & 2033
- Figure 81: South America Maize Industry neww Revenue Share (%), by Consumption Analysis 2025 & 2033
- Figure 82: South America Maize Industry neww Volume Share (%), by Consumption Analysis 2025 & 2033
- Figure 83: South America Maize Industry neww Revenue (Million), by Import Market Analysis (Value & Volume) 2025 & 2033
- Figure 84: South America Maize Industry neww Volume (Kiloton), by Import Market Analysis (Value & Volume) 2025 & 2033
- Figure 85: South America Maize Industry neww Revenue Share (%), by Import Market Analysis (Value & Volume) 2025 & 2033
- Figure 86: South America Maize Industry neww Volume Share (%), by Import Market Analysis (Value & Volume) 2025 & 2033
- Figure 87: South America Maize Industry neww Revenue (Million), by Export Market Analysis (Value & Volume) 2025 & 2033
- Figure 88: South America Maize Industry neww Volume (Kiloton), by Export Market Analysis (Value & Volume) 2025 & 2033
- Figure 89: South America Maize Industry neww Revenue Share (%), by Export Market Analysis (Value & Volume) 2025 & 2033
- Figure 90: South America Maize Industry neww Volume Share (%), by Export Market Analysis (Value & Volume) 2025 & 2033
- Figure 91: South America Maize Industry neww Revenue (Million), by Price Trend Analysis 2025 & 2033
- Figure 92: South America Maize Industry neww Volume (Kiloton), by Price Trend Analysis 2025 & 2033
- Figure 93: South America Maize Industry neww Revenue Share (%), by Price Trend Analysis 2025 & 2033
- Figure 94: South America Maize Industry neww Volume Share (%), by Price Trend Analysis 2025 & 2033
- Figure 95: South America Maize Industry neww Revenue (Million), by Country 2025 & 2033
- Figure 96: South America Maize Industry neww Volume (Kiloton), by Country 2025 & 2033
- Figure 97: South America Maize Industry neww Revenue Share (%), by Country 2025 & 2033
- Figure 98: South America Maize Industry neww Volume Share (%), by Country 2025 & 2033
- Figure 99: Africa Maize Industry neww Revenue (Million), by Production Analysis 2025 & 2033
- Figure 100: Africa Maize Industry neww Volume (Kiloton), by Production Analysis 2025 & 2033
- Figure 101: Africa Maize Industry neww Revenue Share (%), by Production Analysis 2025 & 2033
- Figure 102: Africa Maize Industry neww Volume Share (%), by Production Analysis 2025 & 2033
- Figure 103: Africa Maize Industry neww Revenue (Million), by Consumption Analysis 2025 & 2033
- Figure 104: Africa Maize Industry neww Volume (Kiloton), by Consumption Analysis 2025 & 2033
- Figure 105: Africa Maize Industry neww Revenue Share (%), by Consumption Analysis 2025 & 2033
- Figure 106: Africa Maize Industry neww Volume Share (%), by Consumption Analysis 2025 & 2033
- Figure 107: Africa Maize Industry neww Revenue (Million), by Import Market Analysis (Value & Volume) 2025 & 2033
- Figure 108: Africa Maize Industry neww Volume (Kiloton), by Import Market Analysis (Value & Volume) 2025 & 2033
- Figure 109: Africa Maize Industry neww Revenue Share (%), by Import Market Analysis (Value & Volume) 2025 & 2033
- Figure 110: Africa Maize Industry neww Volume Share (%), by Import Market Analysis (Value & Volume) 2025 & 2033
- Figure 111: Africa Maize Industry neww Revenue (Million), by Export Market Analysis (Value & Volume) 2025 & 2033
- Figure 112: Africa Maize Industry neww Volume (Kiloton), by Export Market Analysis (Value & Volume) 2025 & 2033
- Figure 113: Africa Maize Industry neww Revenue Share (%), by Export Market Analysis (Value & Volume) 2025 & 2033
- Figure 114: Africa Maize Industry neww Volume Share (%), by Export Market Analysis (Value & Volume) 2025 & 2033
- Figure 115: Africa Maize Industry neww Revenue (Million), by Price Trend Analysis 2025 & 2033
- Figure 116: Africa Maize Industry neww Volume (Kiloton), by Price Trend Analysis 2025 & 2033
- Figure 117: Africa Maize Industry neww Revenue Share (%), by Price Trend Analysis 2025 & 2033
- Figure 118: Africa Maize Industry neww Volume Share (%), by Price Trend Analysis 2025 & 2033
- Figure 119: Africa Maize Industry neww Revenue (Million), by Country 2025 & 2033
- Figure 120: Africa Maize Industry neww Volume (Kiloton), by Country 2025 & 2033
- Figure 121: Africa Maize Industry neww Revenue Share (%), by Country 2025 & 2033
- Figure 122: Africa Maize Industry neww Volume Share (%), by Country 2025 & 2033
List of Tables
- Table 1: Global Maize Industry neww Revenue Million Forecast, by Production Analysis 2020 & 2033
- Table 2: Global Maize Industry neww Volume Kiloton Forecast, by Production Analysis 2020 & 2033
- Table 3: Global Maize Industry neww Revenue Million Forecast, by Consumption Analysis 2020 & 2033
- Table 4: Global Maize Industry neww Volume Kiloton Forecast, by Consumption Analysis 2020 & 2033
- Table 5: Global Maize Industry neww Revenue Million Forecast, by Import Market Analysis (Value & Volume) 2020 & 2033
- Table 6: Global Maize Industry neww Volume Kiloton Forecast, by Import Market Analysis (Value & Volume) 2020 & 2033
- Table 7: Global Maize Industry neww Revenue Million Forecast, by Export Market Analysis (Value & Volume) 2020 & 2033
- Table 8: Global Maize Industry neww Volume Kiloton Forecast, by Export Market Analysis (Value & Volume) 2020 & 2033
- Table 9: Global Maize Industry neww Revenue Million Forecast, by Price Trend Analysis 2020 & 2033
- Table 10: Global Maize Industry neww Volume Kiloton Forecast, by Price Trend Analysis 2020 & 2033
- Table 11: Global Maize Industry neww Revenue Million Forecast, by Region 2020 & 2033
- Table 12: Global Maize Industry neww Volume Kiloton Forecast, by Region 2020 & 2033
- Table 13: Global Maize Industry neww Revenue Million Forecast, by Production Analysis 2020 & 2033
- Table 14: Global Maize Industry neww Volume Kiloton Forecast, by Production Analysis 2020 & 2033
- Table 15: Global Maize Industry neww Revenue Million Forecast, by Consumption Analysis 2020 & 2033
- Table 16: Global Maize Industry neww Volume Kiloton Forecast, by Consumption Analysis 2020 & 2033
- Table 17: Global Maize Industry neww Revenue Million Forecast, by Import Market Analysis (Value & Volume) 2020 & 2033
- Table 18: Global Maize Industry neww Volume Kiloton Forecast, by Import Market Analysis (Value & Volume) 2020 & 2033
- Table 19: Global Maize Industry neww Revenue Million Forecast, by Export Market Analysis (Value & Volume) 2020 & 2033
- Table 20: Global Maize Industry neww Volume Kiloton Forecast, by Export Market Analysis (Value & Volume) 2020 & 2033
- Table 21: Global Maize Industry neww Revenue Million Forecast, by Price Trend Analysis 2020 & 2033
- Table 22: Global Maize Industry neww Volume Kiloton Forecast, by Price Trend Analysis 2020 & 2033
- Table 23: Global Maize Industry neww Revenue Million Forecast, by Country 2020 & 2033
- Table 24: Global Maize Industry neww Volume Kiloton Forecast, by Country 2020 & 2033
- Table 25: United States Maize Industry neww Revenue (Million) Forecast, by Application 2020 & 2033
- Table 26: United States Maize Industry neww Volume (Kiloton) Forecast, by Application 2020 & 2033
- Table 27: Canada Maize Industry neww Revenue (Million) Forecast, by Application 2020 & 2033
- Table 28: Canada Maize Industry neww Volume (Kiloton) Forecast, by Application 2020 & 2033
- Table 29: Mexico Maize Industry neww Revenue (Million) Forecast, by Application 2020 & 2033
- Table 30: Mexico Maize Industry neww Volume (Kiloton) Forecast, by Application 2020 & 2033
- Table 31: Global Maize Industry neww Revenue Million Forecast, by Production Analysis 2020 & 2033
- Table 32: Global Maize Industry neww Volume Kiloton Forecast, by Production Analysis 2020 & 2033
- Table 33: Global Maize Industry neww Revenue Million Forecast, by Consumption Analysis 2020 & 2033
- Table 34: Global Maize Industry neww Volume Kiloton Forecast, by Consumption Analysis 2020 & 2033
- Table 35: Global Maize Industry neww Revenue Million Forecast, by Import Market Analysis (Value & Volume) 2020 & 2033
- Table 36: Global Maize Industry neww Volume Kiloton Forecast, by Import Market Analysis (Value & Volume) 2020 & 2033
- Table 37: Global Maize Industry neww Revenue Million Forecast, by Export Market Analysis (Value & Volume) 2020 & 2033
- Table 38: Global Maize Industry neww Volume Kiloton Forecast, by Export Market Analysis (Value & Volume) 2020 & 2033
- Table 39: Global Maize Industry neww Revenue Million Forecast, by Price Trend Analysis 2020 & 2033
- Table 40: Global Maize Industry neww Volume Kiloton Forecast, by Price Trend Analysis 2020 & 2033
- Table 41: Global Maize Industry neww Revenue Million Forecast, by Country 2020 & 2033
- Table 42: Global Maize Industry neww Volume Kiloton Forecast, by Country 2020 & 2033
- Table 43: Spain Maize Industry neww Revenue (Million) Forecast, by Application 2020 & 2033
- Table 44: Spain Maize Industry neww Volume (Kiloton) Forecast, by Application 2020 & 2033
- Table 45: Italy Maize Industry neww Revenue (Million) Forecast, by Application 2020 & 2033
- Table 46: Italy Maize Industry neww Volume (Kiloton) Forecast, by Application 2020 & 2033
- Table 47: France Maize Industry neww Revenue (Million) Forecast, by Application 2020 & 2033
- Table 48: France Maize Industry neww Volume (Kiloton) Forecast, by Application 2020 & 2033
- Table 49: Germany Maize Industry neww Revenue (Million) Forecast, by Application 2020 & 2033
- Table 50: Germany Maize Industry neww Volume (Kiloton) Forecast, by Application 2020 & 2033
- Table 51: Russia Maize Industry neww Revenue (Million) Forecast, by Application 2020 & 2033
- Table 52: Russia Maize Industry neww Volume (Kiloton) Forecast, by Application 2020 & 2033
- Table 53: Global Maize Industry neww Revenue Million Forecast, by Production Analysis 2020 & 2033
- Table 54: Global Maize Industry neww Volume Kiloton Forecast, by Production Analysis 2020 & 2033
- Table 55: Global Maize Industry neww Revenue Million Forecast, by Consumption Analysis 2020 & 2033
- Table 56: Global Maize Industry neww Volume Kiloton Forecast, by Consumption Analysis 2020 & 2033
- Table 57: Global Maize Industry neww Revenue Million Forecast, by Import Market Analysis (Value & Volume) 2020 & 2033
- Table 58: Global Maize Industry neww Volume Kiloton Forecast, by Import Market Analysis (Value & Volume) 2020 & 2033
- Table 59: Global Maize Industry neww Revenue Million Forecast, by Export Market Analysis (Value & Volume) 2020 & 2033
- Table 60: Global Maize Industry neww Volume Kiloton Forecast, by Export Market Analysis (Value & Volume) 2020 & 2033
- Table 61: Global Maize Industry neww Revenue Million Forecast, by Price Trend Analysis 2020 & 2033
- Table 62: Global Maize Industry neww Volume Kiloton Forecast, by Price Trend Analysis 2020 & 2033
- Table 63: Global Maize Industry neww Revenue Million Forecast, by Country 2020 & 2033
- Table 64: Global Maize Industry neww Volume Kiloton Forecast, by Country 2020 & 2033
- Table 65: India Maize Industry neww Revenue (Million) Forecast, by Application 2020 & 2033
- Table 66: India Maize Industry neww Volume (Kiloton) Forecast, by Application 2020 & 2033
- Table 67: China Maize Industry neww Revenue (Million) Forecast, by Application 2020 & 2033
- Table 68: China Maize Industry neww Volume (Kiloton) Forecast, by Application 2020 & 2033
- Table 69: Vietnam Maize Industry neww Revenue (Million) Forecast, by Application 2020 & 2033
- Table 70: Vietnam Maize Industry neww Volume (Kiloton) Forecast, by Application 2020 & 2033
- Table 71: Global Maize Industry neww Revenue Million Forecast, by Production Analysis 2020 & 2033
- Table 72: Global Maize Industry neww Volume Kiloton Forecast, by Production Analysis 2020 & 2033
- Table 73: Global Maize Industry neww Revenue Million Forecast, by Consumption Analysis 2020 & 2033
- Table 74: Global Maize Industry neww Volume Kiloton Forecast, by Consumption Analysis 2020 & 2033
- Table 75: Global Maize Industry neww Revenue Million Forecast, by Import Market Analysis (Value & Volume) 2020 & 2033
- Table 76: Global Maize Industry neww Volume Kiloton Forecast, by Import Market Analysis (Value & Volume) 2020 & 2033
- Table 77: Global Maize Industry neww Revenue Million Forecast, by Export Market Analysis (Value & Volume) 2020 & 2033
- Table 78: Global Maize Industry neww Volume Kiloton Forecast, by Export Market Analysis (Value & Volume) 2020 & 2033
- Table 79: Global Maize Industry neww Revenue Million Forecast, by Price Trend Analysis 2020 & 2033
- Table 80: Global Maize Industry neww Volume Kiloton Forecast, by Price Trend Analysis 2020 & 2033
- Table 81: Global Maize Industry neww Revenue Million Forecast, by Country 2020 & 2033
- Table 82: Global Maize Industry neww Volume Kiloton Forecast, by Country 2020 & 2033
- Table 83: Brazil Maize Industry neww Revenue (Million) Forecast, by Application 2020 & 2033
- Table 84: Brazil Maize Industry neww Volume (Kiloton) Forecast, by Application 2020 & 2033
- Table 85: Argentina Maize Industry neww Revenue (Million) Forecast, by Application 2020 & 2033
- Table 86: Argentina Maize Industry neww Volume (Kiloton) Forecast, by Application 2020 & 2033
- Table 87: Global Maize Industry neww Revenue Million Forecast, by Production Analysis 2020 & 2033
- Table 88: Global Maize Industry neww Volume Kiloton Forecast, by Production Analysis 2020 & 2033
- Table 89: Global Maize Industry neww Revenue Million Forecast, by Consumption Analysis 2020 & 2033
- Table 90: Global Maize Industry neww Volume Kiloton Forecast, by Consumption Analysis 2020 & 2033
- Table 91: Global Maize Industry neww Revenue Million Forecast, by Import Market Analysis (Value & Volume) 2020 & 2033
- Table 92: Global Maize Industry neww Volume Kiloton Forecast, by Import Market Analysis (Value & Volume) 2020 & 2033
- Table 93: Global Maize Industry neww Revenue Million Forecast, by Export Market Analysis (Value & Volume) 2020 & 2033
- Table 94: Global Maize Industry neww Volume Kiloton Forecast, by Export Market Analysis (Value & Volume) 2020 & 2033
- Table 95: Global Maize Industry neww Revenue Million Forecast, by Price Trend Analysis 2020 & 2033
- Table 96: Global Maize Industry neww Volume Kiloton Forecast, by Price Trend Analysis 2020 & 2033
- Table 97: Global Maize Industry neww Revenue Million Forecast, by Country 2020 & 2033
- Table 98: Global Maize Industry neww Volume Kiloton Forecast, by Country 2020 & 2033
- Table 99: South Africa Maize Industry neww Revenue (Million) Forecast, by Application 2020 & 2033
- Table 100: South Africa Maize Industry neww Volume (Kiloton) Forecast, by Application 2020 & 2033
- Table 101: Nigeria Maize Industry neww Revenue (Million) Forecast, by Application 2020 & 2033
- Table 102: Nigeria Maize Industry neww Volume (Kiloton) Forecast, by Application 2020 & 2033
Frequently Asked Questions
1. What is the projected Compound Annual Growth Rate (CAGR) of the Maize Industry neww?
The projected CAGR is approximately 3.01%.
2. Which companies are prominent players in the Maize Industry neww?
Key companies in the market include ADM, Syngenta Crop Protection , Société Générale de Surveillance (SGS) , Bayer Crop Science , Bunge , Bunge Limited , Cargill, Incorporated , Corteva Agriscience , ADM , Olam Group .
3. What are the main segments of the Maize Industry neww?
The market segments include Production Analysis, Consumption Analysis, Import Market Analysis (Value & Volume), Export Market Analysis (Value & Volume), Price Trend Analysis.
4. Can you provide details about the market size?
The market size is estimated to be USD 143.62 Million as of 2022.
5. What are some drivers contributing to market growth?
N/A
6. What are the notable trends driving market growth?
Increase in Demand for Animal-based Protein Sources.
7. Are there any restraints impacting market growth?
N/A
8. Can you provide examples of recent developments in the market?
October 2022: Ghana's President, Nana Addo Dankwa Akufo-Addo, inaugurated an ultramodern maize processing factory at Nsuta-Kwagye in the Sekyere-Central District of the Ashanti Region, as part of the "One District, One Factory" initiative. The facility is equipped with cutting-edge processing equipment, such as a maize drying plant, a grit milling machine, and many more.
9. What pricing options are available for accessing the report?
Pricing options include single-user, multi-user, and enterprise licenses priced at USD 4750, USD 5250, and USD 8750 respectively.
10. Is the market size provided in terms of value or volume?
The market size is provided in terms of value, measured in Million and volume, measured in Kiloton.
11. Are there any specific market keywords associated with the report?
Yes, the market keyword associated with the report is "Maize Industry neww," which aids in identifying and referencing the specific market segment covered.
12. How do I determine which pricing option suits my needs best?
The pricing options vary based on user requirements and access needs. Individual users may opt for single-user licenses, while businesses requiring broader access may choose multi-user or enterprise licenses for cost-effective access to the report.
13. Are there any additional resources or data provided in the Maize Industry neww report?
While the report offers comprehensive insights, it's advisable to review the specific contents or supplementary materials provided to ascertain if additional resources or data are available.
14. How can I stay updated on further developments or reports in the Maize Industry neww?
To stay informed about further developments, trends, and reports in the Maize Industry neww, consider subscribing to industry newsletters, following relevant companies and organizations, or regularly checking reputable industry news sources and publications.
Methodology
Step 1 - Identification of Relevant Samples Size from Population Database


Step 2 - Approaches for Defining Global Market Size (Value, Volume* & Price*)

Note*: In applicable scenarios
Step 3 - Data Sources
Primary Research
- Web Analytics
- Survey Reports
- Research Institute
- Latest Research Reports
- Opinion Leaders
Secondary Research
- Annual Reports
- White Paper
- Latest Press Release
- Industry Association
- Paid Database
- Investor Presentations

Step 4 - Data Triangulation
Involves using different sources of information in order to increase the validity of a study
These sources are likely to be stakeholders in a program - participants, other researchers, program staff, other community members, and so on.
Then we put all data in single framework & apply various statistical tools to find out the dynamic on the market.
During the analysis stage, feedback from the stakeholder groups would be compared to determine areas of agreement as well as areas of divergence