

Key Insights
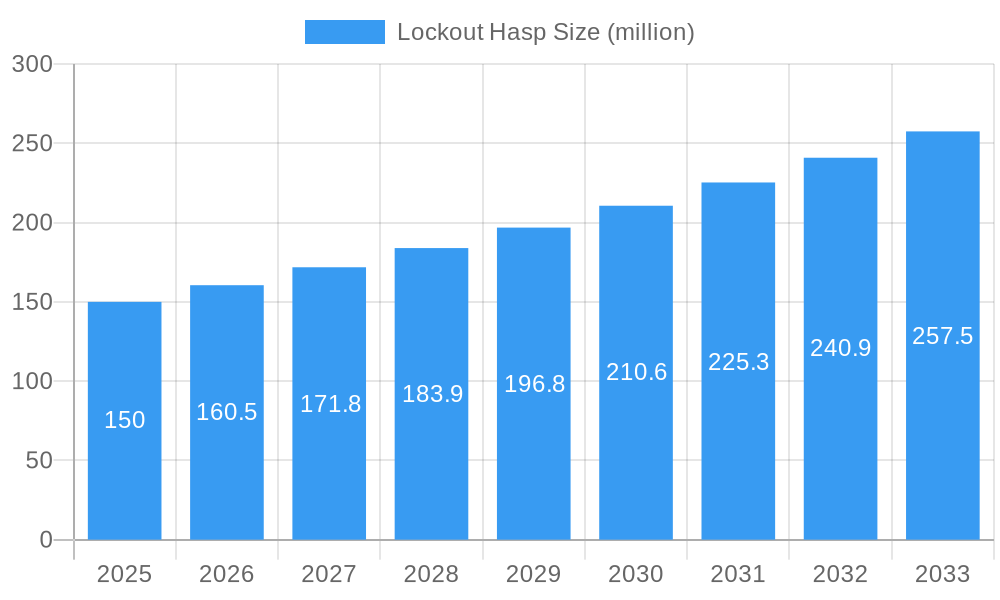
The lockout/tagout (LOTO) devices market, specifically focusing on lockout hasps, is experiencing robust growth driven by increasing workplace safety regulations and a heightened awareness of industrial accident prevention. The market, estimated at $150 million in 2025, is projected to grow at a Compound Annual Growth Rate (CAGR) of 7% from 2025 to 2033. This growth is fueled by several key factors: the rising adoption of LOTO procedures across various industries (manufacturing, construction, energy), a global emphasis on worker safety training programs, and the increasing demand for durable, high-quality hasps capable of securing multiple padlocks. Emerging trends such as the adoption of smart lockout devices and improved supply chain management within the industry will further shape market expansion. However, restraints like the presence of counterfeit products and fluctuating raw material costs pose challenges to consistent growth. The market is segmented by product type (material, size, capacity), end-user industry (manufacturing, oil & gas, construction), and geographic region. Key players such as Reece Safety, Brady, and Master Lock are actively engaged in product innovation and strategic partnerships to consolidate their market positions. Increased competition and varying price points will continue to create diverse options for consumers.
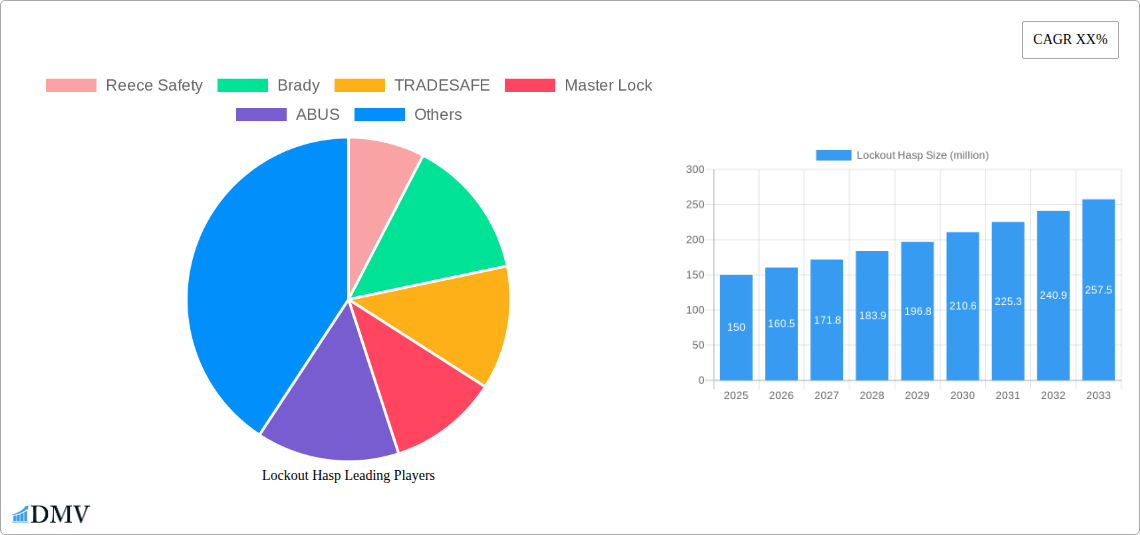
Lockout Hasp Market Size (In Million)
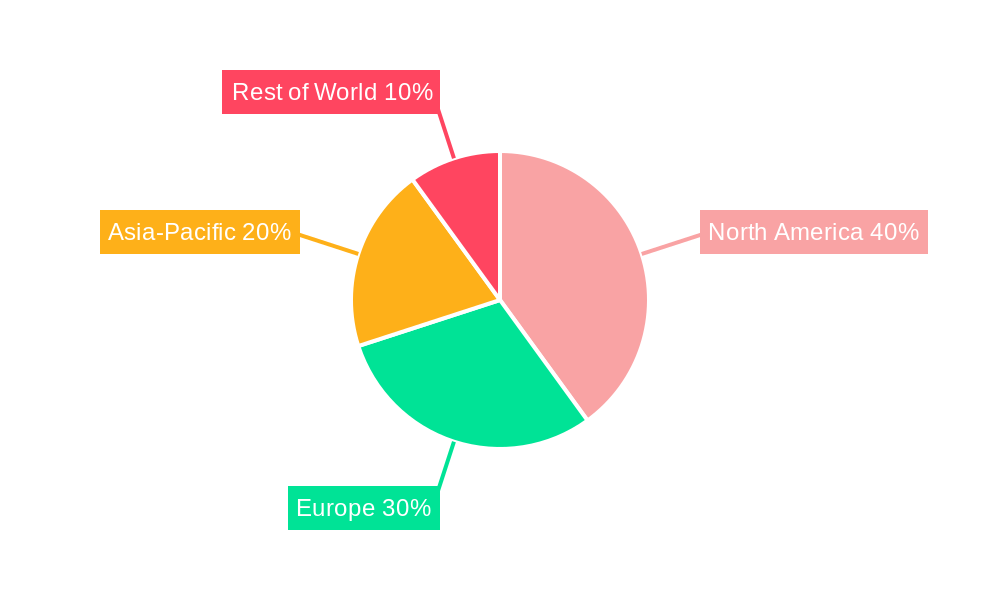
The North American region currently dominates the lockout hasp market, owing to stringent safety regulations and strong industrial activity. However, the Asia-Pacific region is anticipated to demonstrate the most significant growth during the forecast period due to rapid industrialization and increasing investments in infrastructure projects. Europe and other regions will also witness consistent growth, although at a slightly slower pace. Competitive dynamics involve a mix of established players and emerging regional brands. Established players are focusing on enhancing their product portfolios through innovation and strategic acquisitions, while regional players compete primarily on pricing and localized distribution networks. Future market growth will significantly depend on successful implementation of new safety regulations across various countries and the increasing adoption of digital and smart LOTO solutions for enhanced workplace safety.
Lockout Hasp Company Market Share
Lockout Hasp Market Report: A Comprehensive Analysis of a $XX Million Industry (2019-2033)
This insightful report provides a comprehensive analysis of the global lockout hasp market, projecting a value of $XX million by 2033. The study covers the period 2019-2033, with 2025 serving as the base and estimated year. This detailed examination delves into market composition, competitive dynamics, technological advancements, and future growth potential, equipping stakeholders with crucial data-driven insights for informed decision-making. The report features in-depth analysis from leading industry experts and meticulously compiled data to paint a vivid picture of this dynamic market.
Lockout Hasp Market Composition & Trends
This section analyzes the competitive landscape, innovation drivers, regulatory influences, and market dynamics within the lockout hasp industry. The market exhibits a moderately concentrated structure, with key players like Reece Safety, Brady, TRADESAFE, Master Lock, ABUS, SKILCRAFT, Securikey, TUFFA Products, BOZZYS, Lockey Safety Products, Safetyware Group, Globalite Safety Solutions, and MRS security technology holding a significant collective market share estimated at approximately 70% in 2025. Mergers and acquisitions (M&A) activity has been moderate, with a total estimated deal value of $XX million in the historical period (2019-2024). Innovation is driven by increasing demand for enhanced safety features, improved durability, and ergonomic designs. Stringent safety regulations across various industries are significant growth catalysts. Substitute products, while limited, include alternative lockout/tagout devices, but the unique functionality and established safety standards of lockout hasps maintain their market dominance. End-users span diverse industries including manufacturing, oil & gas, construction, and food processing.
- Market Share Distribution (2025): Reece Safety (15%), Brady (12%), Master Lock (10%), ABUS (8%), Others (45%).
- M&A Deal Value (2019-2024): Approximately $XX million.
- Key End-User Industries: Manufacturing, Oil & Gas, Construction, Food Processing.
Lockout Hasp Industry Evolution
The lockout hasp market has witnessed consistent growth throughout the historical period (2019-2024), with a Compound Annual Growth Rate (CAGR) of approximately XX%. This growth is primarily attributable to heightened awareness of workplace safety regulations and the increasing adoption of lockout/tagout (LOTO) procedures across industries. Technological advancements such as the incorporation of durable materials, improved locking mechanisms, and innovative designs have further fueled market expansion. Shifting consumer demands towards enhanced user-friendliness, cost-effectiveness, and versatility have also played a crucial role. The forecast period (2025-2033) is projected to see continued growth, driven by factors like expanding industrial automation, increasing stringency of safety standards, and rising demand from emerging economies. Adoption rates are expected to increase significantly, particularly in developing nations, as safety regulations become more stringent. The market is expected to experience a CAGR of XX% during the forecast period, reaching an estimated value of $XX million by 2033.
Leading Regions, Countries, or Segments in Lockout Hasp
North America currently holds the leading position in the global lockout hasp market, driven by stringent safety regulations, a robust industrial base, and high awareness of workplace safety. Europe follows closely, while the Asia-Pacific region exhibits significant growth potential due to rapid industrialization and increasing adoption of LOTO procedures.
- Key Drivers in North America: Stringent OSHA regulations, established industrial base, high safety awareness.
- Key Drivers in Europe: Stringent EU safety directives, robust industrial sector, focus on worker safety.
- Key Drivers in Asia-Pacific: Rapid industrialization, increasing awareness of workplace safety, rising disposable incomes.
Lockout Hasp Product Innovations
Recent innovations in lockout hasps include the integration of advanced materials for enhanced durability and resistance to harsh environments. Improved locking mechanisms provide increased security and tamper resistance. Ergonomic designs enhance ease of use and reduce the risk of workplace injuries. Many manufacturers now offer customizable options to cater to specific industry needs. These innovations contribute to improved safety protocols and efficiency in various industrial settings.
Propelling Factors for Lockout Hasp Growth
Several factors are driving the growth of the lockout hasp market. Stringent government regulations mandating LOTO procedures in various industries are a major catalyst. The increasing focus on workplace safety and the reduction of industrial accidents is also a significant factor. The expansion of manufacturing and industrial activities globally, especially in developing economies, further fuels market demand. Technological advancements leading to more durable, user-friendly, and secure lockout hasps also contribute to the growth.
Obstacles in the Lockout Hasp Market
The lockout hasp market faces challenges including supply chain disruptions that can lead to price volatility and material shortages. Fluctuations in raw material prices, such as steel, can impact production costs. Intense competition from established and emerging players can create price pressures. Additionally, variations in regulatory frameworks across different regions can create complexity for manufacturers operating internationally. These factors can potentially constrain market growth.
Future Opportunities in Lockout Hasp
Emerging opportunities lie in the development of smart lockout hasps with integrated technologies such as RFID or Bluetooth for improved tracking and management. Expansion into new markets, especially in developing economies with growing industrial sectors, presents significant potential. The development of specialized lockout hasps for specific industries with unique safety requirements will also drive growth.
Major Players in the Lockout Hasp Ecosystem
- Reece Safety
- Brady
- TRADESAFE
- Master Lock
- ABUS
- SKILCRAFT
- Securikey
- TUFFA Products
- BOZZYS
- Lockey Safety Products
- Safetyware Group
- Globalite Safety Solutions
- MRS security technology
Key Developments in Lockout Hasp Industry
- 2022 Q3: Master Lock launched a new line of high-security lockout hasps.
- 2023 Q1: Brady Corporation acquired a smaller competitor, expanding its market share.
- 2024 Q2: New safety regulations were implemented in several European countries, boosting demand.
Strategic Lockout Hasp Market Forecast
The lockout hasp market is poised for substantial growth over the forecast period (2025-2033), driven by stringent safety regulations, technological advancements, and increasing industrialization. Emerging markets and the adoption of innovative products will further fuel market expansion. The market is expected to reach a value of $XX million by 2033, presenting lucrative opportunities for established and new players.
Lockout Hasp Segmentation
-
1. Application
- 1.1. Construction Site
- 1.2. Oil & Gas
- 1.3. Electrical Industry
- 1.4. Mining Industry
- 1.5. Others
-
2. Types
- 2.1. Single-Lever
- 2.2. Double-Lever
Lockout Hasp Segmentation By Geography
-
1. North America
- 1.1. United States
- 1.2. Canada
- 1.3. Mexico
-
2. South America
- 2.1. Brazil
- 2.2. Argentina
- 2.3. Rest of South America
-
3. Europe
- 3.1. United Kingdom
- 3.2. Germany
- 3.3. France
- 3.4. Italy
- 3.5. Spain
- 3.6. Russia
- 3.7. Benelux
- 3.8. Nordics
- 3.9. Rest of Europe
-
4. Middle East & Africa
- 4.1. Turkey
- 4.2. Israel
- 4.3. GCC
- 4.4. North Africa
- 4.5. South Africa
- 4.6. Rest of Middle East & Africa
-
5. Asia Pacific
- 5.1. China
- 5.2. India
- 5.3. Japan
- 5.4. South Korea
- 5.5. ASEAN
- 5.6. Oceania
- 5.7. Rest of Asia Pacific
Lockout Hasp Regional Market Share
Geographic Coverage of Lockout Hasp
Lockout Hasp REPORT HIGHLIGHTS
| Aspects | Details |
|---|---|
| Study Period | 2020-2034 |
| Base Year | 2025 |
| Estimated Year | 2026 |
| Forecast Period | 2026-2034 |
| Historical Period | 2020-2025 |
| Growth Rate | CAGR of 5.3% from 2020-2034 |
| Segmentation |
|
Table of Contents
- 1. Introduction
- 1.1. Research Scope
- 1.2. Market Segmentation
- 1.3. Research Objective
- 1.4. Definitions and Assumptions
- 2. Executive Summary
- 2.1. Market Snapshot
- 3. Market Dynamics
- 3.1. Market Drivers
- 3.2. Market Restrains
- 3.3. Market Trends
- 3.4. Market Opportunities
- 4. Market Factor Analysis
- 4.1. Porters Five Forces
- 4.1.1. Bargaining Power of Suppliers
- 4.1.2. Bargaining Power of Buyers
- 4.1.3. Threat of New Entrants
- 4.1.4. Threat of Substitutes
- 4.1.5. Competitive Rivalry
- 4.2. PESTEL analysis
- 4.3. BCG Analysis
- 4.3.1. Stars (High Growth, High Market Share)
- 4.3.2. Cash Cows (Low Growth, High Market Share)
- 4.3.3. Question Mark (High Growth, Low Market Share)
- 4.3.4. Dogs (Low Growth, Low Market Share)
- 4.4. Ansoff Matrix Analysis
- 4.5. Supply Chain Analysis
- 4.6. Regulatory Landscape
- 4.7. Current Market Potential and Opportunity Assessment (TAM–SAM–SOM Framework)
- 4.8. DMV Analyst Note
- 4.1. Porters Five Forces
- 5. Market Analysis, Insights and Forecast 2021-2033
- 5.1. Market Analysis, Insights and Forecast - by Application
- 5.1.1. Construction Site
- 5.1.2. Oil & Gas
- 5.1.3. Electrical Industry
- 5.1.4. Mining Industry
- 5.1.5. Others
- 5.2. Market Analysis, Insights and Forecast - by Types
- 5.2.1. Single-Lever
- 5.2.2. Double-Lever
- 5.3. Market Analysis, Insights and Forecast - by Region
- 5.3.1. North America
- 5.3.2. South America
- 5.3.3. Europe
- 5.3.4. Middle East & Africa
- 5.3.5. Asia Pacific
- 5.1. Market Analysis, Insights and Forecast - by Application
- 6. Global Lockout Hasp Analysis, Insights and Forecast, 2021-2033
- 6.1. Market Analysis, Insights and Forecast - by Application
- 6.1.1. Construction Site
- 6.1.2. Oil & Gas
- 6.1.3. Electrical Industry
- 6.1.4. Mining Industry
- 6.1.5. Others
- 6.2. Market Analysis, Insights and Forecast - by Types
- 6.2.1. Single-Lever
- 6.2.2. Double-Lever
- 6.1. Market Analysis, Insights and Forecast - by Application
- 7. North America Lockout Hasp Analysis, Insights and Forecast, 2020-2032
- 7.1. Market Analysis, Insights and Forecast - by Application
- 7.1.1. Construction Site
- 7.1.2. Oil & Gas
- 7.1.3. Electrical Industry
- 7.1.4. Mining Industry
- 7.1.5. Others
- 7.2. Market Analysis, Insights and Forecast - by Types
- 7.2.1. Single-Lever
- 7.2.2. Double-Lever
- 7.1. Market Analysis, Insights and Forecast - by Application
- 8. South America Lockout Hasp Analysis, Insights and Forecast, 2020-2032
- 8.1. Market Analysis, Insights and Forecast - by Application
- 8.1.1. Construction Site
- 8.1.2. Oil & Gas
- 8.1.3. Electrical Industry
- 8.1.4. Mining Industry
- 8.1.5. Others
- 8.2. Market Analysis, Insights and Forecast - by Types
- 8.2.1. Single-Lever
- 8.2.2. Double-Lever
- 8.1. Market Analysis, Insights and Forecast - by Application
- 9. Europe Lockout Hasp Analysis, Insights and Forecast, 2020-2032
- 9.1. Market Analysis, Insights and Forecast - by Application
- 9.1.1. Construction Site
- 9.1.2. Oil & Gas
- 9.1.3. Electrical Industry
- 9.1.4. Mining Industry
- 9.1.5. Others
- 9.2. Market Analysis, Insights and Forecast - by Types
- 9.2.1. Single-Lever
- 9.2.2. Double-Lever
- 9.1. Market Analysis, Insights and Forecast - by Application
- 10. Middle East & Africa Lockout Hasp Analysis, Insights and Forecast, 2020-2032
- 10.1. Market Analysis, Insights and Forecast - by Application
- 10.1.1. Construction Site
- 10.1.2. Oil & Gas
- 10.1.3. Electrical Industry
- 10.1.4. Mining Industry
- 10.1.5. Others
- 10.2. Market Analysis, Insights and Forecast - by Types
- 10.2.1. Single-Lever
- 10.2.2. Double-Lever
- 10.1. Market Analysis, Insights and Forecast - by Application
- 11. Asia Pacific Lockout Hasp Analysis, Insights and Forecast, 2020-2032
- 11.1. Market Analysis, Insights and Forecast - by Application
- 11.1.1. Construction Site
- 11.1.2. Oil & Gas
- 11.1.3. Electrical Industry
- 11.1.4. Mining Industry
- 11.1.5. Others
- 11.2. Market Analysis, Insights and Forecast - by Types
- 11.2.1. Single-Lever
- 11.2.2. Double-Lever
- 11.1. Market Analysis, Insights and Forecast - by Application
- 12. Competitive Analysis
- 12.1. Company Profiles
- 12.1.1 Reece Safety
- 12.1.1.1. Company Overview
- 12.1.1.2. Products
- 12.1.1.3. Company Financials
- 12.1.1.4. SWOT Analysis
- 12.1.2 Brady
- 12.1.2.1. Company Overview
- 12.1.2.2. Products
- 12.1.2.3. Company Financials
- 12.1.2.4. SWOT Analysis
- 12.1.3 TRADESAFE
- 12.1.3.1. Company Overview
- 12.1.3.2. Products
- 12.1.3.3. Company Financials
- 12.1.3.4. SWOT Analysis
- 12.1.4 Master Lock
- 12.1.4.1. Company Overview
- 12.1.4.2. Products
- 12.1.4.3. Company Financials
- 12.1.4.4. SWOT Analysis
- 12.1.5 ABUS
- 12.1.5.1. Company Overview
- 12.1.5.2. Products
- 12.1.5.3. Company Financials
- 12.1.5.4. SWOT Analysis
- 12.1.6 SKILCRAFT
- 12.1.6.1. Company Overview
- 12.1.6.2. Products
- 12.1.6.3. Company Financials
- 12.1.6.4. SWOT Analysis
- 12.1.7 Securikey
- 12.1.7.1. Company Overview
- 12.1.7.2. Products
- 12.1.7.3. Company Financials
- 12.1.7.4. SWOT Analysis
- 12.1.8 TUFFA Products
- 12.1.8.1. Company Overview
- 12.1.8.2. Products
- 12.1.8.3. Company Financials
- 12.1.8.4. SWOT Analysis
- 12.1.9 BOZZYS
- 12.1.9.1. Company Overview
- 12.1.9.2. Products
- 12.1.9.3. Company Financials
- 12.1.9.4. SWOT Analysis
- 12.1.10 Lockey Safety Products
- 12.1.10.1. Company Overview
- 12.1.10.2. Products
- 12.1.10.3. Company Financials
- 12.1.10.4. SWOT Analysis
- 12.1.11 Safetyware Group
- 12.1.11.1. Company Overview
- 12.1.11.2. Products
- 12.1.11.3. Company Financials
- 12.1.11.4. SWOT Analysis
- 12.1.12 Globalite Safety Solutions
- 12.1.12.1. Company Overview
- 12.1.12.2. Products
- 12.1.12.3. Company Financials
- 12.1.12.4. SWOT Analysis
- 12.1.13 MRS security technology
- 12.1.13.1. Company Overview
- 12.1.13.2. Products
- 12.1.13.3. Company Financials
- 12.1.13.4. SWOT Analysis
- 12.1.1 Reece Safety
- 12.2. Market Entropy
- 12.2.1 Company's Key Areas Served
- 12.2.2 Recent Developments
- 12.3. Company Market Share Analysis 2025
- 12.3.1 Top 5 Companies Market Share Analysis
- 12.3.2 Top 3 Companies Market Share Analysis
- 12.4. List of Potential Customers
- 13. Research Methodology
List of Figures
- Figure 1: Global Lockout Hasp Revenue Breakdown (undefined, %) by Region 2025 & 2033
- Figure 2: Global Lockout Hasp Volume Breakdown (K, %) by Region 2025 & 2033
- Figure 3: North America Lockout Hasp Revenue (undefined), by Application 2025 & 2033
- Figure 4: North America Lockout Hasp Volume (K), by Application 2025 & 2033
- Figure 5: North America Lockout Hasp Revenue Share (%), by Application 2025 & 2033
- Figure 6: North America Lockout Hasp Volume Share (%), by Application 2025 & 2033
- Figure 7: North America Lockout Hasp Revenue (undefined), by Types 2025 & 2033
- Figure 8: North America Lockout Hasp Volume (K), by Types 2025 & 2033
- Figure 9: North America Lockout Hasp Revenue Share (%), by Types 2025 & 2033
- Figure 10: North America Lockout Hasp Volume Share (%), by Types 2025 & 2033
- Figure 11: North America Lockout Hasp Revenue (undefined), by Country 2025 & 2033
- Figure 12: North America Lockout Hasp Volume (K), by Country 2025 & 2033
- Figure 13: North America Lockout Hasp Revenue Share (%), by Country 2025 & 2033
- Figure 14: North America Lockout Hasp Volume Share (%), by Country 2025 & 2033
- Figure 15: South America Lockout Hasp Revenue (undefined), by Application 2025 & 2033
- Figure 16: South America Lockout Hasp Volume (K), by Application 2025 & 2033
- Figure 17: South America Lockout Hasp Revenue Share (%), by Application 2025 & 2033
- Figure 18: South America Lockout Hasp Volume Share (%), by Application 2025 & 2033
- Figure 19: South America Lockout Hasp Revenue (undefined), by Types 2025 & 2033
- Figure 20: South America Lockout Hasp Volume (K), by Types 2025 & 2033
- Figure 21: South America Lockout Hasp Revenue Share (%), by Types 2025 & 2033
- Figure 22: South America Lockout Hasp Volume Share (%), by Types 2025 & 2033
- Figure 23: South America Lockout Hasp Revenue (undefined), by Country 2025 & 2033
- Figure 24: South America Lockout Hasp Volume (K), by Country 2025 & 2033
- Figure 25: South America Lockout Hasp Revenue Share (%), by Country 2025 & 2033
- Figure 26: South America Lockout Hasp Volume Share (%), by Country 2025 & 2033
- Figure 27: Europe Lockout Hasp Revenue (undefined), by Application 2025 & 2033
- Figure 28: Europe Lockout Hasp Volume (K), by Application 2025 & 2033
- Figure 29: Europe Lockout Hasp Revenue Share (%), by Application 2025 & 2033
- Figure 30: Europe Lockout Hasp Volume Share (%), by Application 2025 & 2033
- Figure 31: Europe Lockout Hasp Revenue (undefined), by Types 2025 & 2033
- Figure 32: Europe Lockout Hasp Volume (K), by Types 2025 & 2033
- Figure 33: Europe Lockout Hasp Revenue Share (%), by Types 2025 & 2033
- Figure 34: Europe Lockout Hasp Volume Share (%), by Types 2025 & 2033
- Figure 35: Europe Lockout Hasp Revenue (undefined), by Country 2025 & 2033
- Figure 36: Europe Lockout Hasp Volume (K), by Country 2025 & 2033
- Figure 37: Europe Lockout Hasp Revenue Share (%), by Country 2025 & 2033
- Figure 38: Europe Lockout Hasp Volume Share (%), by Country 2025 & 2033
- Figure 39: Middle East & Africa Lockout Hasp Revenue (undefined), by Application 2025 & 2033
- Figure 40: Middle East & Africa Lockout Hasp Volume (K), by Application 2025 & 2033
- Figure 41: Middle East & Africa Lockout Hasp Revenue Share (%), by Application 2025 & 2033
- Figure 42: Middle East & Africa Lockout Hasp Volume Share (%), by Application 2025 & 2033
- Figure 43: Middle East & Africa Lockout Hasp Revenue (undefined), by Types 2025 & 2033
- Figure 44: Middle East & Africa Lockout Hasp Volume (K), by Types 2025 & 2033
- Figure 45: Middle East & Africa Lockout Hasp Revenue Share (%), by Types 2025 & 2033
- Figure 46: Middle East & Africa Lockout Hasp Volume Share (%), by Types 2025 & 2033
- Figure 47: Middle East & Africa Lockout Hasp Revenue (undefined), by Country 2025 & 2033
- Figure 48: Middle East & Africa Lockout Hasp Volume (K), by Country 2025 & 2033
- Figure 49: Middle East & Africa Lockout Hasp Revenue Share (%), by Country 2025 & 2033
- Figure 50: Middle East & Africa Lockout Hasp Volume Share (%), by Country 2025 & 2033
- Figure 51: Asia Pacific Lockout Hasp Revenue (undefined), by Application 2025 & 2033
- Figure 52: Asia Pacific Lockout Hasp Volume (K), by Application 2025 & 2033
- Figure 53: Asia Pacific Lockout Hasp Revenue Share (%), by Application 2025 & 2033
- Figure 54: Asia Pacific Lockout Hasp Volume Share (%), by Application 2025 & 2033
- Figure 55: Asia Pacific Lockout Hasp Revenue (undefined), by Types 2025 & 2033
- Figure 56: Asia Pacific Lockout Hasp Volume (K), by Types 2025 & 2033
- Figure 57: Asia Pacific Lockout Hasp Revenue Share (%), by Types 2025 & 2033
- Figure 58: Asia Pacific Lockout Hasp Volume Share (%), by Types 2025 & 2033
- Figure 59: Asia Pacific Lockout Hasp Revenue (undefined), by Country 2025 & 2033
- Figure 60: Asia Pacific Lockout Hasp Volume (K), by Country 2025 & 2033
- Figure 61: Asia Pacific Lockout Hasp Revenue Share (%), by Country 2025 & 2033
- Figure 62: Asia Pacific Lockout Hasp Volume Share (%), by Country 2025 & 2033
List of Tables
- Table 1: Global Lockout Hasp Revenue undefined Forecast, by Application 2020 & 2033
- Table 2: Global Lockout Hasp Volume K Forecast, by Application 2020 & 2033
- Table 3: Global Lockout Hasp Revenue undefined Forecast, by Types 2020 & 2033
- Table 4: Global Lockout Hasp Volume K Forecast, by Types 2020 & 2033
- Table 5: Global Lockout Hasp Revenue undefined Forecast, by Region 2020 & 2033
- Table 6: Global Lockout Hasp Volume K Forecast, by Region 2020 & 2033
- Table 7: Global Lockout Hasp Revenue undefined Forecast, by Application 2020 & 2033
- Table 8: Global Lockout Hasp Volume K Forecast, by Application 2020 & 2033
- Table 9: Global Lockout Hasp Revenue undefined Forecast, by Types 2020 & 2033
- Table 10: Global Lockout Hasp Volume K Forecast, by Types 2020 & 2033
- Table 11: Global Lockout Hasp Revenue undefined Forecast, by Country 2020 & 2033
- Table 12: Global Lockout Hasp Volume K Forecast, by Country 2020 & 2033
- Table 13: United States Lockout Hasp Revenue (undefined) Forecast, by Application 2020 & 2033
- Table 14: United States Lockout Hasp Volume (K) Forecast, by Application 2020 & 2033
- Table 15: Canada Lockout Hasp Revenue (undefined) Forecast, by Application 2020 & 2033
- Table 16: Canada Lockout Hasp Volume (K) Forecast, by Application 2020 & 2033
- Table 17: Mexico Lockout Hasp Revenue (undefined) Forecast, by Application 2020 & 2033
- Table 18: Mexico Lockout Hasp Volume (K) Forecast, by Application 2020 & 2033
- Table 19: Global Lockout Hasp Revenue undefined Forecast, by Application 2020 & 2033
- Table 20: Global Lockout Hasp Volume K Forecast, by Application 2020 & 2033
- Table 21: Global Lockout Hasp Revenue undefined Forecast, by Types 2020 & 2033
- Table 22: Global Lockout Hasp Volume K Forecast, by Types 2020 & 2033
- Table 23: Global Lockout Hasp Revenue undefined Forecast, by Country 2020 & 2033
- Table 24: Global Lockout Hasp Volume K Forecast, by Country 2020 & 2033
- Table 25: Brazil Lockout Hasp Revenue (undefined) Forecast, by Application 2020 & 2033
- Table 26: Brazil Lockout Hasp Volume (K) Forecast, by Application 2020 & 2033
- Table 27: Argentina Lockout Hasp Revenue (undefined) Forecast, by Application 2020 & 2033
- Table 28: Argentina Lockout Hasp Volume (K) Forecast, by Application 2020 & 2033
- Table 29: Rest of South America Lockout Hasp Revenue (undefined) Forecast, by Application 2020 & 2033
- Table 30: Rest of South America Lockout Hasp Volume (K) Forecast, by Application 2020 & 2033
- Table 31: Global Lockout Hasp Revenue undefined Forecast, by Application 2020 & 2033
- Table 32: Global Lockout Hasp Volume K Forecast, by Application 2020 & 2033
- Table 33: Global Lockout Hasp Revenue undefined Forecast, by Types 2020 & 2033
- Table 34: Global Lockout Hasp Volume K Forecast, by Types 2020 & 2033
- Table 35: Global Lockout Hasp Revenue undefined Forecast, by Country 2020 & 2033
- Table 36: Global Lockout Hasp Volume K Forecast, by Country 2020 & 2033
- Table 37: United Kingdom Lockout Hasp Revenue (undefined) Forecast, by Application 2020 & 2033
- Table 38: United Kingdom Lockout Hasp Volume (K) Forecast, by Application 2020 & 2033
- Table 39: Germany Lockout Hasp Revenue (undefined) Forecast, by Application 2020 & 2033
- Table 40: Germany Lockout Hasp Volume (K) Forecast, by Application 2020 & 2033
- Table 41: France Lockout Hasp Revenue (undefined) Forecast, by Application 2020 & 2033
- Table 42: France Lockout Hasp Volume (K) Forecast, by Application 2020 & 2033
- Table 43: Italy Lockout Hasp Revenue (undefined) Forecast, by Application 2020 & 2033
- Table 44: Italy Lockout Hasp Volume (K) Forecast, by Application 2020 & 2033
- Table 45: Spain Lockout Hasp Revenue (undefined) Forecast, by Application 2020 & 2033
- Table 46: Spain Lockout Hasp Volume (K) Forecast, by Application 2020 & 2033
- Table 47: Russia Lockout Hasp Revenue (undefined) Forecast, by Application 2020 & 2033
- Table 48: Russia Lockout Hasp Volume (K) Forecast, by Application 2020 & 2033
- Table 49: Benelux Lockout Hasp Revenue (undefined) Forecast, by Application 2020 & 2033
- Table 50: Benelux Lockout Hasp Volume (K) Forecast, by Application 2020 & 2033
- Table 51: Nordics Lockout Hasp Revenue (undefined) Forecast, by Application 2020 & 2033
- Table 52: Nordics Lockout Hasp Volume (K) Forecast, by Application 2020 & 2033
- Table 53: Rest of Europe Lockout Hasp Revenue (undefined) Forecast, by Application 2020 & 2033
- Table 54: Rest of Europe Lockout Hasp Volume (K) Forecast, by Application 2020 & 2033
- Table 55: Global Lockout Hasp Revenue undefined Forecast, by Application 2020 & 2033
- Table 56: Global Lockout Hasp Volume K Forecast, by Application 2020 & 2033
- Table 57: Global Lockout Hasp Revenue undefined Forecast, by Types 2020 & 2033
- Table 58: Global Lockout Hasp Volume K Forecast, by Types 2020 & 2033
- Table 59: Global Lockout Hasp Revenue undefined Forecast, by Country 2020 & 2033
- Table 60: Global Lockout Hasp Volume K Forecast, by Country 2020 & 2033
- Table 61: Turkey Lockout Hasp Revenue (undefined) Forecast, by Application 2020 & 2033
- Table 62: Turkey Lockout Hasp Volume (K) Forecast, by Application 2020 & 2033
- Table 63: Israel Lockout Hasp Revenue (undefined) Forecast, by Application 2020 & 2033
- Table 64: Israel Lockout Hasp Volume (K) Forecast, by Application 2020 & 2033
- Table 65: GCC Lockout Hasp Revenue (undefined) Forecast, by Application 2020 & 2033
- Table 66: GCC Lockout Hasp Volume (K) Forecast, by Application 2020 & 2033
- Table 67: North Africa Lockout Hasp Revenue (undefined) Forecast, by Application 2020 & 2033
- Table 68: North Africa Lockout Hasp Volume (K) Forecast, by Application 2020 & 2033
- Table 69: South Africa Lockout Hasp Revenue (undefined) Forecast, by Application 2020 & 2033
- Table 70: South Africa Lockout Hasp Volume (K) Forecast, by Application 2020 & 2033
- Table 71: Rest of Middle East & Africa Lockout Hasp Revenue (undefined) Forecast, by Application 2020 & 2033
- Table 72: Rest of Middle East & Africa Lockout Hasp Volume (K) Forecast, by Application 2020 & 2033
- Table 73: Global Lockout Hasp Revenue undefined Forecast, by Application 2020 & 2033
- Table 74: Global Lockout Hasp Volume K Forecast, by Application 2020 & 2033
- Table 75: Global Lockout Hasp Revenue undefined Forecast, by Types 2020 & 2033
- Table 76: Global Lockout Hasp Volume K Forecast, by Types 2020 & 2033
- Table 77: Global Lockout Hasp Revenue undefined Forecast, by Country 2020 & 2033
- Table 78: Global Lockout Hasp Volume K Forecast, by Country 2020 & 2033
- Table 79: China Lockout Hasp Revenue (undefined) Forecast, by Application 2020 & 2033
- Table 80: China Lockout Hasp Volume (K) Forecast, by Application 2020 & 2033
- Table 81: India Lockout Hasp Revenue (undefined) Forecast, by Application 2020 & 2033
- Table 82: India Lockout Hasp Volume (K) Forecast, by Application 2020 & 2033
- Table 83: Japan Lockout Hasp Revenue (undefined) Forecast, by Application 2020 & 2033
- Table 84: Japan Lockout Hasp Volume (K) Forecast, by Application 2020 & 2033
- Table 85: South Korea Lockout Hasp Revenue (undefined) Forecast, by Application 2020 & 2033
- Table 86: South Korea Lockout Hasp Volume (K) Forecast, by Application 2020 & 2033
- Table 87: ASEAN Lockout Hasp Revenue (undefined) Forecast, by Application 2020 & 2033
- Table 88: ASEAN Lockout Hasp Volume (K) Forecast, by Application 2020 & 2033
- Table 89: Oceania Lockout Hasp Revenue (undefined) Forecast, by Application 2020 & 2033
- Table 90: Oceania Lockout Hasp Volume (K) Forecast, by Application 2020 & 2033
- Table 91: Rest of Asia Pacific Lockout Hasp Revenue (undefined) Forecast, by Application 2020 & 2033
- Table 92: Rest of Asia Pacific Lockout Hasp Volume (K) Forecast, by Application 2020 & 2033
Frequently Asked Questions
1. What is the projected Compound Annual Growth Rate (CAGR) of the Lockout Hasp?
The projected CAGR is approximately 5.3%.
2. Which companies are prominent players in the Lockout Hasp?
Key companies in the market include Reece Safety, Brady, TRADESAFE, Master Lock, ABUS, SKILCRAFT, Securikey, TUFFA Products, BOZZYS, Lockey Safety Products, Safetyware Group, Globalite Safety Solutions, MRS security technology.
3. What are the main segments of the Lockout Hasp?
The market segments include Application, Types.
4. Can you provide details about the market size?
The market size is estimated to be USD XXX N/A as of 2022.
5. What are some drivers contributing to market growth?
N/A
6. What are the notable trends driving market growth?
N/A
7. Are there any restraints impacting market growth?
N/A
8. Can you provide examples of recent developments in the market?
N/A
9. What pricing options are available for accessing the report?
Pricing options include single-user, multi-user, and enterprise licenses priced at USD 4350.00, USD 6525.00, and USD 8700.00 respectively.
10. Is the market size provided in terms of value or volume?
The market size is provided in terms of value, measured in N/A and volume, measured in K.
11. Are there any specific market keywords associated with the report?
Yes, the market keyword associated with the report is "Lockout Hasp," which aids in identifying and referencing the specific market segment covered.
12. How do I determine which pricing option suits my needs best?
The pricing options vary based on user requirements and access needs. Individual users may opt for single-user licenses, while businesses requiring broader access may choose multi-user or enterprise licenses for cost-effective access to the report.
13. Are there any additional resources or data provided in the Lockout Hasp report?
While the report offers comprehensive insights, it's advisable to review the specific contents or supplementary materials provided to ascertain if additional resources or data are available.
14. How can I stay updated on further developments or reports in the Lockout Hasp?
To stay informed about further developments, trends, and reports in the Lockout Hasp, consider subscribing to industry newsletters, following relevant companies and organizations, or regularly checking reputable industry news sources and publications.
Methodology
Step 1 - Identification of Relevant Samples Size from Population Database


Step 2 - Approaches for Defining Global Market Size (Value, Volume* & Price*)

Note*: In applicable scenarios
Step 3 - Data Sources
Primary Research
- Web Analytics
- Survey Reports
- Research Institute
- Latest Research Reports
- Opinion Leaders
Secondary Research
- Annual Reports
- White Paper
- Latest Press Release
- Industry Association
- Paid Database
- Investor Presentations

Step 4 - Data Triangulation
Involves using different sources of information in order to increase the validity of a study
These sources are likely to be stakeholders in a program - participants, other researchers, program staff, other community members, and so on.
Then we put all data in single framework & apply various statistical tools to find out the dynamic on the market.
During the analysis stage, feedback from the stakeholder groups would be compared to determine areas of agreement as well as areas of divergence