

Key Insights
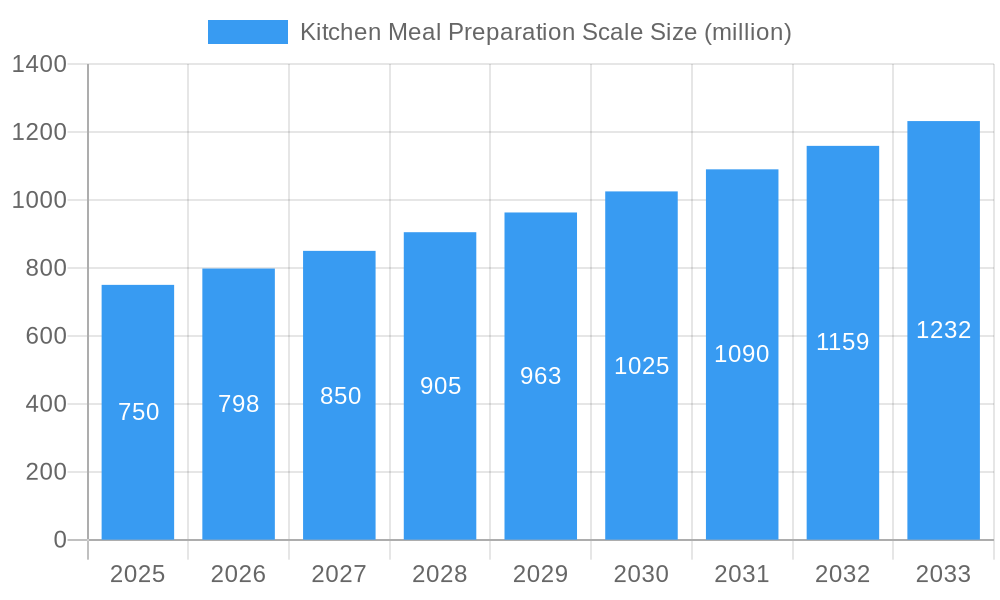
The global Kitchen Meal Preparation Scale market is poised for robust growth, projected to reach approximately $750 million by 2025, with a Compound Annual Growth Rate (CAGR) of around 6.5% anticipated from 2025 to 2033. This expansion is fueled by an increasing consumer focus on health and wellness, leading to a greater demand for precise nutritional tracking and portion control, particularly in home kitchens. The "Household Use" segment is expected to dominate, driven by the rising popularity of home cooking, specialized diets (keto, paleo, vegan), and the desire for accurate ingredient measurements in baking and cooking. Furthermore, the growing adoption of smart kitchen appliances and the integration of connectivity features in meal prep scales are contributing to market advancement, offering enhanced user experiences and data management capabilities. The convenience and portability offered by these devices empower individuals to maintain dietary goals both at home and on the go.
Kitchen Meal Preparation Scale Market Size (In Million)
The market is also significantly influenced by emerging trends such as the integration of AI and machine learning for personalized dietary recommendations and recipe generation. The "Portable Food Preparation Scale" segment is likely to witness accelerated growth due to its utility for individuals with active lifestyles, frequent travelers, and those utilizing meal prep services. While the market presents substantial opportunities, certain restraints, such as the relatively high cost of advanced smart scales and the limited awareness in some developing regions, could temper the pace of growth. However, continuous innovation in sensor technology, user interface design, and competitive pricing strategies by key players like Etekcity and Smart Weigh are expected to mitigate these challenges, ensuring a dynamic and evolving market landscape over the forecast period. Regional dominance is anticipated in Asia Pacific, driven by its large population and increasing disposable income, followed by North America and Europe due to established health consciousness and technological adoption.
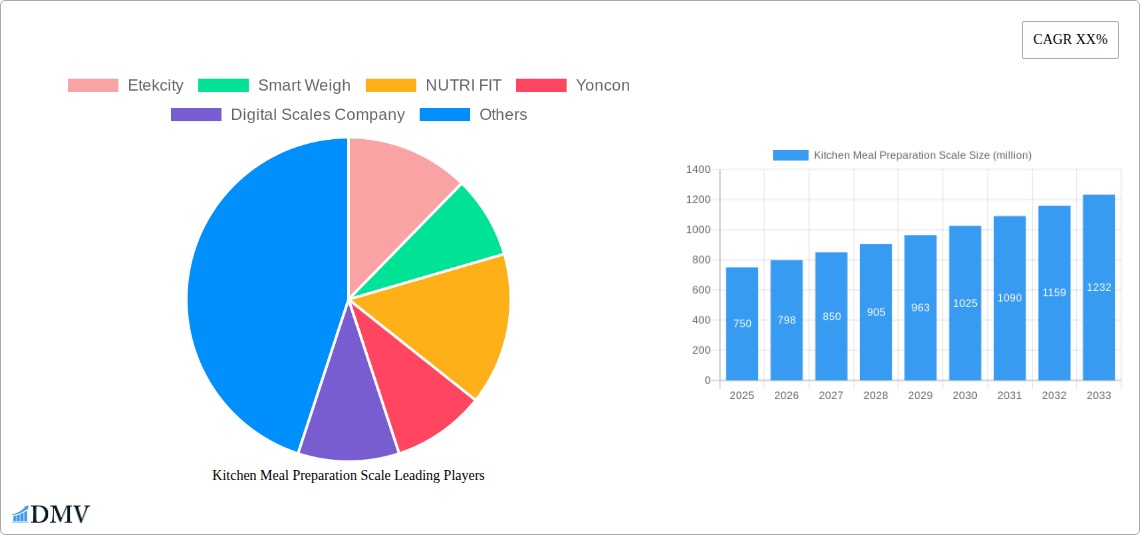
Kitchen Meal Preparation Scale Company Market Share
Kitchen Meal Preparation Scale Market Analysis: Trends, Growth, and Future Outlook (2019–2033)
This comprehensive report offers an in-depth analysis of the global Kitchen Meal Preparation Scale market, encompassing market composition, industry evolution, regional dynamics, product innovations, growth drivers, challenges, and future opportunities. With a study period spanning from 2019 to 2033, including a base year of 2025 and a forecast period from 2025 to 2033, this report provides actionable insights for stakeholders seeking to understand and capitalize on market trends.
Kitchen Meal Preparation Scale Market Composition & Trends
The global Kitchen Meal Preparation Scale market is characterized by a moderate level of concentration, with a few key players holding significant market share. Leading companies like Etekcity and Smart Weigh are at the forefront of innovation, consistently introducing advanced features and user-friendly designs. The market is propelled by a growing emphasis on health and wellness, precise dietary tracking, and the rise of home cooking. Regulatory landscapes, while generally supportive of product safety and accuracy, can vary by region, influencing product certifications and market entry strategies. Substitute products, such as measuring cups and spoons, exist but lack the precision and convenience offered by digital scales. End-user profiles are diverse, encompassing health-conscious individuals, professional chefs, home bakers, and commercial kitchens aiming for consistent portion control. Merger and acquisition activities, while not at a fever pitch, are observed as companies seek to expand their product portfolios and market reach. For instance, a recent M&A deal valued at approximately XX million saw a prominent appliance manufacturer acquire a specialized scale producer to integrate smart features. Market share distribution is estimated as follows: Etekcity (XX%), Smart Weigh (XX%), NUTRI FIT (XX%), Yoncon (XX%), Digital Scales Company (XX%), Charder (XX%), Weightron (XX%), Brecknell (XX%), Arlyn Scales (XX%), Hogentogler & Co Inc (XX%), Salter (XX%), and XX% for other players.
Kitchen Meal Preparation Scale Industry Evolution
The Kitchen Meal Preparation Scale industry has witnessed remarkable evolution, driven by technological advancements and shifting consumer preferences. Over the historical period of 2019–2024, the market experienced a steady growth trajectory, with an estimated compound annual growth rate (CAGR) of XX%. This growth was fueled by an increasing awareness of the importance of accurate portioning for weight management and specialized diets, such as ketogenic and low-carb lifestyles. The advent of smart kitchen appliances and the proliferation of mobile health applications have further spurred demand for connected and intelligent meal preparation scales. Early models focused on basic weighing functionality, but the industry has rapidly advanced to incorporate features like nutritional analysis, recipe integration, and Bluetooth connectivity. The base year of 2025 is projected to see the market reach a valuation of XX million, with an estimated CAGR of XX% anticipated during the forecast period of 2025–2033. This robust growth is attributed to the increasing adoption of these scales in household settings for precise calorie counting and in commercial kitchens for consistent inventory management and cost control. Technological innovations, including enhanced sensor accuracy, real-time data syncing, and user-friendly interfaces, have significantly improved the utility and appeal of these devices. Consumer demand is shifting towards scales that offer more than just weight measurement, seeking integrated solutions that simplify the entire meal preparation process. For example, the adoption rate of smart kitchen scales with app connectivity has surged by an estimated XX% between 2020 and 2024. The industry is also responding to the demand for aesthetically pleasing and durable kitchen tools, leading to a diversification of designs and materials.
Leading Regions, Countries, or Segments in Kitchen Meal Preparation Scale
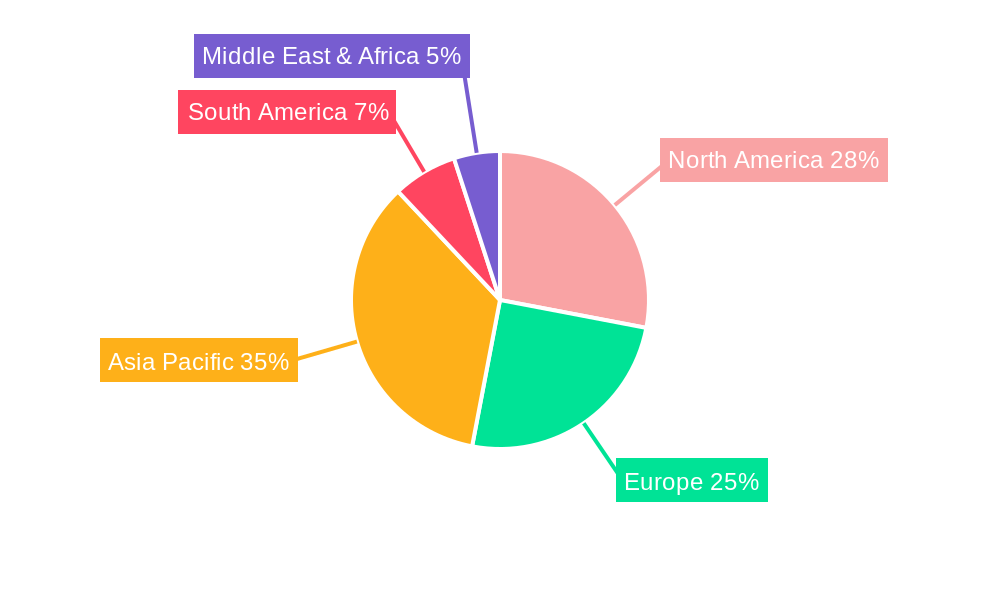
The global Kitchen Meal Preparation Scale market exhibits varied strengths across different regions and application segments. North America currently leads in market dominance, driven by a high prevalence of health-conscious consumers and a robust adoption rate of smart home technology. The United States, in particular, represents a significant market due to its large population, disposable income, and established culture of healthy eating and fitness.
Key drivers for this dominance in North America include:
- High Disposable Income and Consumer Spending: Consumers in North America have a greater propensity to invest in premium kitchen gadgets that offer enhanced functionality and convenience.
- Growing Health and Wellness Trends: The strong emphasis on healthy lifestyles, weight management, and specialized diets (e.g., keto, vegan) directly fuels the demand for precise meal preparation scales.
- Technological Adoption: The region has a high adoption rate for smart home devices, making connected kitchen scales with app integration a natural fit for consumers.
- Robust Retail Infrastructure: A well-developed retail network, both online and offline, ensures wide accessibility to a variety of kitchen meal preparation scales.
Within the Application segment, Household Use is the most dominant, accounting for an estimated XX% of the total market share in 2025. This is due to the increasing trend of home cooking, meal prepping for busy schedules, and a growing awareness of nutritional intake for personal health goals. The Commercial application segment, while smaller, is experiencing significant growth, particularly in the food service industry, where accurate portioning is crucial for cost control, inventory management, and maintaining consistent quality.
In terms of Types, the Desktop Food Preparation Scale holds a larger market share, estimated at XX% in 2025, due to its widespread use in domestic kitchens and its versatility for various culinary tasks. The Portable Food Preparation Scale segment, while smaller, is witnessing accelerated growth, driven by the increasing popularity of outdoor cooking, picnics, and the need for compact and easy-to-carry weighing solutions.
Kitchen Meal Preparation Scale Product Innovations
Recent product innovations in the Kitchen Meal Preparation Scale market have focused on enhancing user experience and expanding functionality. Many new scales now feature integrated Bluetooth connectivity, allowing seamless data syncing with mobile applications for nutritional tracking and recipe management. Advanced sensors provide unparalleled accuracy, measuring in grams, ounces, and milliliters, catering to diverse cooking needs. Some models offer pre-programmed nutritional databases, instantly calculating calories, fats, proteins, and carbohydrates for common ingredients. Water and oil-resistant surfaces, alongside intuitive touch-screen interfaces, are becoming standard, improving durability and ease of use. The integration of AI-powered recipe suggestions based on dietary preferences is also an emerging trend, further solidifying these scales as intelligent kitchen companions.
Propelling Factors for Kitchen Meal Preparation Scale Growth
Several key factors are propelling the growth of the Kitchen Meal Preparation Scale market. Firstly, the escalating global health and wellness consciousness, coupled with the rising prevalence of diet-related diseases, is driving consumers towards precise calorie and nutrient tracking. Secondly, the surge in home cooking and meal prepping as a cost-effective and healthier alternative to dining out is increasing the demand for accurate weighing tools. Thirdly, technological advancements, including the integration of smart features like app connectivity and nutritional databases, are enhancing the utility and appeal of these scales. Furthermore, the growing popularity of fitness tracking and wearable technology has created a synergistic effect, with users seeking comprehensive data for their health regimens. The expansion of e-commerce platforms also provides wider accessibility to these products globally.
Obstacles in the Kitchen Meal Preparation Scale Market
Despite the positive growth trajectory, the Kitchen Meal Preparation Scale market faces certain obstacles. Intense competition from a multitude of brands, both established and emerging, can lead to price wars and thinner profit margins. The rapid pace of technological advancement necessitates continuous R&D investment, which can be a significant cost for smaller manufacturers. Furthermore, the availability of basic, low-cost digital scales in the market can deter some consumers from investing in premium, feature-rich models. Supply chain disruptions, as seen in recent global events, can impact manufacturing and distribution, leading to increased costs and potential product shortages. Regulatory compliance in different countries for electronic devices can also present challenges for market entry.
Future Opportunities in Kitchen Meal Preparation Scale
The Kitchen Meal Preparation Scale market is poised for significant future opportunities. The growing demand for specialized dietary scales catering to specific needs like gluten-free or allergen-free diets presents a niche growth area. The expansion into emerging economies with rising disposable incomes and increasing health awareness offers vast untapped potential. Furthermore, the integration of scales with smart kitchen ecosystems and voice-activated assistants will create a more seamless and connected cooking experience. The development of sustainable and eco-friendly scale designs using recycled materials will appeal to environmentally conscious consumers. Innovations in portable and compact designs for on-the-go weighing will also open new avenues.
Major Players in the Kitchen Meal Preparation Scale Ecosystem
- Etekcity
- Smart Weigh
- NUTRI FIT
- Yoncon
- Digital Scales Company
- Charder
- Weightron
- Brecknell
- Arlyn Scales
- Hogentogler & Co Inc
- Salter
Key Developments in Kitchen Meal Preparation Scale Industry
- 2023/04: Etekcity launches a new range of smart food scales with enhanced app connectivity and nutritional analysis features, impacting consumer engagement.
- 2023/09: Smart Weigh introduces advanced IoT-enabled scales, allowing for remote monitoring and data integration in commercial kitchens, boosting efficiency by an estimated XX%.
- 2024/01: NUTRI FIT debuts a line of aesthetically designed, ultra-accurate scales with touch-sensitive displays, enhancing user experience and product appeal.
- 2024/06: Yoncon announces strategic partnerships with major appliance manufacturers to integrate their scales into premium kitchen appliance bundles, expanding market reach.
- 2024/11: Digital Scales Company unveils a new generation of durable, water-resistant scales designed for professional culinary environments, addressing industry-specific needs.
Strategic Kitchen Meal Preparation Scale Market Forecast
The strategic outlook for the Kitchen Meal Preparation Scale market remains highly optimistic. Driven by the persistent global focus on health and wellness, coupled with the accelerating trend of home-based food preparation, the demand for precise and intelligent weighing solutions is projected to continue its upward trajectory. The integration of smart technologies, including advanced sensor capabilities and seamless app connectivity, will further enhance the value proposition for consumers and professionals alike. Emerging market penetration and the development of specialized product lines catering to niche dietary requirements represent significant growth avenues. The market is expected to witness sustained innovation, with a focus on user-centric design, durability, and comprehensive nutritional data integration, collectively contributing to a projected market valuation of XX million by 2033.
Kitchen Meal Preparation Scale Segmentation
-
1. Application
- 1.1. Household Use
- 1.2. Commercial
-
2. Types
- 2.1. Desktop Food Preparation Scale
- 2.2. Portable Food Preparation Scale
Kitchen Meal Preparation Scale Segmentation By Geography
-
1. North America
- 1.1. United States
- 1.2. Canada
- 1.3. Mexico
-
2. South America
- 2.1. Brazil
- 2.2. Argentina
- 2.3. Rest of South America
-
3. Europe
- 3.1. United Kingdom
- 3.2. Germany
- 3.3. France
- 3.4. Italy
- 3.5. Spain
- 3.6. Russia
- 3.7. Benelux
- 3.8. Nordics
- 3.9. Rest of Europe
-
4. Middle East & Africa
- 4.1. Turkey
- 4.2. Israel
- 4.3. GCC
- 4.4. North Africa
- 4.5. South Africa
- 4.6. Rest of Middle East & Africa
-
5. Asia Pacific
- 5.1. China
- 5.2. India
- 5.3. Japan
- 5.4. South Korea
- 5.5. ASEAN
- 5.6. Oceania
- 5.7. Rest of Asia Pacific
Kitchen Meal Preparation Scale Regional Market Share
Geographic Coverage of Kitchen Meal Preparation Scale
Kitchen Meal Preparation Scale REPORT HIGHLIGHTS
| Aspects | Details |
|---|---|
| Study Period | 2020-2034 |
| Base Year | 2025 |
| Estimated Year | 2026 |
| Forecast Period | 2026-2034 |
| Historical Period | 2020-2025 |
| Growth Rate | CAGR of 8.4% from 2020-2034 |
| Segmentation |
|
Table of Contents
- 1. Introduction
- 1.1. Research Scope
- 1.2. Market Segmentation
- 1.3. Research Methodology
- 1.4. Definitions and Assumptions
- 2. Executive Summary
- 2.1. Introduction
- 3. Market Dynamics
- 3.1. Introduction
- 3.2. Market Drivers
- 3.3. Market Restrains
- 3.4. Market Trends
- 4. Market Factor Analysis
- 4.1. Porters Five Forces
- 4.2. Supply/Value Chain
- 4.3. PESTEL analysis
- 4.4. Market Entropy
- 4.5. Patent/Trademark Analysis
- 5. Global Kitchen Meal Preparation Scale Analysis, Insights and Forecast, 2020-2032
- 5.1. Market Analysis, Insights and Forecast - by Application
- 5.1.1. Household Use
- 5.1.2. Commercial
- 5.2. Market Analysis, Insights and Forecast - by Types
- 5.2.1. Desktop Food Preparation Scale
- 5.2.2. Portable Food Preparation Scale
- 5.3. Market Analysis, Insights and Forecast - by Region
- 5.3.1. North America
- 5.3.2. South America
- 5.3.3. Europe
- 5.3.4. Middle East & Africa
- 5.3.5. Asia Pacific
- 5.1. Market Analysis, Insights and Forecast - by Application
- 6. North America Kitchen Meal Preparation Scale Analysis, Insights and Forecast, 2020-2032
- 6.1. Market Analysis, Insights and Forecast - by Application
- 6.1.1. Household Use
- 6.1.2. Commercial
- 6.2. Market Analysis, Insights and Forecast - by Types
- 6.2.1. Desktop Food Preparation Scale
- 6.2.2. Portable Food Preparation Scale
- 6.1. Market Analysis, Insights and Forecast - by Application
- 7. South America Kitchen Meal Preparation Scale Analysis, Insights and Forecast, 2020-2032
- 7.1. Market Analysis, Insights and Forecast - by Application
- 7.1.1. Household Use
- 7.1.2. Commercial
- 7.2. Market Analysis, Insights and Forecast - by Types
- 7.2.1. Desktop Food Preparation Scale
- 7.2.2. Portable Food Preparation Scale
- 7.1. Market Analysis, Insights and Forecast - by Application
- 8. Europe Kitchen Meal Preparation Scale Analysis, Insights and Forecast, 2020-2032
- 8.1. Market Analysis, Insights and Forecast - by Application
- 8.1.1. Household Use
- 8.1.2. Commercial
- 8.2. Market Analysis, Insights and Forecast - by Types
- 8.2.1. Desktop Food Preparation Scale
- 8.2.2. Portable Food Preparation Scale
- 8.1. Market Analysis, Insights and Forecast - by Application
- 9. Middle East & Africa Kitchen Meal Preparation Scale Analysis, Insights and Forecast, 2020-2032
- 9.1. Market Analysis, Insights and Forecast - by Application
- 9.1.1. Household Use
- 9.1.2. Commercial
- 9.2. Market Analysis, Insights and Forecast - by Types
- 9.2.1. Desktop Food Preparation Scale
- 9.2.2. Portable Food Preparation Scale
- 9.1. Market Analysis, Insights and Forecast - by Application
- 10. Asia Pacific Kitchen Meal Preparation Scale Analysis, Insights and Forecast, 2020-2032
- 10.1. Market Analysis, Insights and Forecast - by Application
- 10.1.1. Household Use
- 10.1.2. Commercial
- 10.2. Market Analysis, Insights and Forecast - by Types
- 10.2.1. Desktop Food Preparation Scale
- 10.2.2. Portable Food Preparation Scale
- 10.1. Market Analysis, Insights and Forecast - by Application
- 11. Competitive Analysis
- 11.1. Global Market Share Analysis 2025
- 11.2. Company Profiles
- 11.2.1 Etekcity
- 11.2.1.1. Overview
- 11.2.1.2. Products
- 11.2.1.3. SWOT Analysis
- 11.2.1.4. Recent Developments
- 11.2.1.5. Financials (Based on Availability)
- 11.2.2 Smart Weigh
- 11.2.2.1. Overview
- 11.2.2.2. Products
- 11.2.2.3. SWOT Analysis
- 11.2.2.4. Recent Developments
- 11.2.2.5. Financials (Based on Availability)
- 11.2.3 NUTRI FIT
- 11.2.3.1. Overview
- 11.2.3.2. Products
- 11.2.3.3. SWOT Analysis
- 11.2.3.4. Recent Developments
- 11.2.3.5. Financials (Based on Availability)
- 11.2.4 Yoncon
- 11.2.4.1. Overview
- 11.2.4.2. Products
- 11.2.4.3. SWOT Analysis
- 11.2.4.4. Recent Developments
- 11.2.4.5. Financials (Based on Availability)
- 11.2.5 Digital Scales Company
- 11.2.5.1. Overview
- 11.2.5.2. Products
- 11.2.5.3. SWOT Analysis
- 11.2.5.4. Recent Developments
- 11.2.5.5. Financials (Based on Availability)
- 11.2.6 Charder
- 11.2.6.1. Overview
- 11.2.6.2. Products
- 11.2.6.3. SWOT Analysis
- 11.2.6.4. Recent Developments
- 11.2.6.5. Financials (Based on Availability)
- 11.2.7 Weightron
- 11.2.7.1. Overview
- 11.2.7.2. Products
- 11.2.7.3. SWOT Analysis
- 11.2.7.4. Recent Developments
- 11.2.7.5. Financials (Based on Availability)
- 11.2.8 Brecknell
- 11.2.8.1. Overview
- 11.2.8.2. Products
- 11.2.8.3. SWOT Analysis
- 11.2.8.4. Recent Developments
- 11.2.8.5. Financials (Based on Availability)
- 11.2.9 Arlyn Scales
- 11.2.9.1. Overview
- 11.2.9.2. Products
- 11.2.9.3. SWOT Analysis
- 11.2.9.4. Recent Developments
- 11.2.9.5. Financials (Based on Availability)
- 11.2.10 Hogentogler & Co Inc
- 11.2.10.1. Overview
- 11.2.10.2. Products
- 11.2.10.3. SWOT Analysis
- 11.2.10.4. Recent Developments
- 11.2.10.5. Financials (Based on Availability)
- 11.2.11 Salter
- 11.2.11.1. Overview
- 11.2.11.2. Products
- 11.2.11.3. SWOT Analysis
- 11.2.11.4. Recent Developments
- 11.2.11.5. Financials (Based on Availability)
- 11.2.1 Etekcity
List of Figures
- Figure 1: Global Kitchen Meal Preparation Scale Revenue Breakdown (undefined, %) by Region 2025 & 2033
- Figure 2: Global Kitchen Meal Preparation Scale Volume Breakdown (K, %) by Region 2025 & 2033
- Figure 3: North America Kitchen Meal Preparation Scale Revenue (undefined), by Application 2025 & 2033
- Figure 4: North America Kitchen Meal Preparation Scale Volume (K), by Application 2025 & 2033
- Figure 5: North America Kitchen Meal Preparation Scale Revenue Share (%), by Application 2025 & 2033
- Figure 6: North America Kitchen Meal Preparation Scale Volume Share (%), by Application 2025 & 2033
- Figure 7: North America Kitchen Meal Preparation Scale Revenue (undefined), by Types 2025 & 2033
- Figure 8: North America Kitchen Meal Preparation Scale Volume (K), by Types 2025 & 2033
- Figure 9: North America Kitchen Meal Preparation Scale Revenue Share (%), by Types 2025 & 2033
- Figure 10: North America Kitchen Meal Preparation Scale Volume Share (%), by Types 2025 & 2033
- Figure 11: North America Kitchen Meal Preparation Scale Revenue (undefined), by Country 2025 & 2033
- Figure 12: North America Kitchen Meal Preparation Scale Volume (K), by Country 2025 & 2033
- Figure 13: North America Kitchen Meal Preparation Scale Revenue Share (%), by Country 2025 & 2033
- Figure 14: North America Kitchen Meal Preparation Scale Volume Share (%), by Country 2025 & 2033
- Figure 15: South America Kitchen Meal Preparation Scale Revenue (undefined), by Application 2025 & 2033
- Figure 16: South America Kitchen Meal Preparation Scale Volume (K), by Application 2025 & 2033
- Figure 17: South America Kitchen Meal Preparation Scale Revenue Share (%), by Application 2025 & 2033
- Figure 18: South America Kitchen Meal Preparation Scale Volume Share (%), by Application 2025 & 2033
- Figure 19: South America Kitchen Meal Preparation Scale Revenue (undefined), by Types 2025 & 2033
- Figure 20: South America Kitchen Meal Preparation Scale Volume (K), by Types 2025 & 2033
- Figure 21: South America Kitchen Meal Preparation Scale Revenue Share (%), by Types 2025 & 2033
- Figure 22: South America Kitchen Meal Preparation Scale Volume Share (%), by Types 2025 & 2033
- Figure 23: South America Kitchen Meal Preparation Scale Revenue (undefined), by Country 2025 & 2033
- Figure 24: South America Kitchen Meal Preparation Scale Volume (K), by Country 2025 & 2033
- Figure 25: South America Kitchen Meal Preparation Scale Revenue Share (%), by Country 2025 & 2033
- Figure 26: South America Kitchen Meal Preparation Scale Volume Share (%), by Country 2025 & 2033
- Figure 27: Europe Kitchen Meal Preparation Scale Revenue (undefined), by Application 2025 & 2033
- Figure 28: Europe Kitchen Meal Preparation Scale Volume (K), by Application 2025 & 2033
- Figure 29: Europe Kitchen Meal Preparation Scale Revenue Share (%), by Application 2025 & 2033
- Figure 30: Europe Kitchen Meal Preparation Scale Volume Share (%), by Application 2025 & 2033
- Figure 31: Europe Kitchen Meal Preparation Scale Revenue (undefined), by Types 2025 & 2033
- Figure 32: Europe Kitchen Meal Preparation Scale Volume (K), by Types 2025 & 2033
- Figure 33: Europe Kitchen Meal Preparation Scale Revenue Share (%), by Types 2025 & 2033
- Figure 34: Europe Kitchen Meal Preparation Scale Volume Share (%), by Types 2025 & 2033
- Figure 35: Europe Kitchen Meal Preparation Scale Revenue (undefined), by Country 2025 & 2033
- Figure 36: Europe Kitchen Meal Preparation Scale Volume (K), by Country 2025 & 2033
- Figure 37: Europe Kitchen Meal Preparation Scale Revenue Share (%), by Country 2025 & 2033
- Figure 38: Europe Kitchen Meal Preparation Scale Volume Share (%), by Country 2025 & 2033
- Figure 39: Middle East & Africa Kitchen Meal Preparation Scale Revenue (undefined), by Application 2025 & 2033
- Figure 40: Middle East & Africa Kitchen Meal Preparation Scale Volume (K), by Application 2025 & 2033
- Figure 41: Middle East & Africa Kitchen Meal Preparation Scale Revenue Share (%), by Application 2025 & 2033
- Figure 42: Middle East & Africa Kitchen Meal Preparation Scale Volume Share (%), by Application 2025 & 2033
- Figure 43: Middle East & Africa Kitchen Meal Preparation Scale Revenue (undefined), by Types 2025 & 2033
- Figure 44: Middle East & Africa Kitchen Meal Preparation Scale Volume (K), by Types 2025 & 2033
- Figure 45: Middle East & Africa Kitchen Meal Preparation Scale Revenue Share (%), by Types 2025 & 2033
- Figure 46: Middle East & Africa Kitchen Meal Preparation Scale Volume Share (%), by Types 2025 & 2033
- Figure 47: Middle East & Africa Kitchen Meal Preparation Scale Revenue (undefined), by Country 2025 & 2033
- Figure 48: Middle East & Africa Kitchen Meal Preparation Scale Volume (K), by Country 2025 & 2033
- Figure 49: Middle East & Africa Kitchen Meal Preparation Scale Revenue Share (%), by Country 2025 & 2033
- Figure 50: Middle East & Africa Kitchen Meal Preparation Scale Volume Share (%), by Country 2025 & 2033
- Figure 51: Asia Pacific Kitchen Meal Preparation Scale Revenue (undefined), by Application 2025 & 2033
- Figure 52: Asia Pacific Kitchen Meal Preparation Scale Volume (K), by Application 2025 & 2033
- Figure 53: Asia Pacific Kitchen Meal Preparation Scale Revenue Share (%), by Application 2025 & 2033
- Figure 54: Asia Pacific Kitchen Meal Preparation Scale Volume Share (%), by Application 2025 & 2033
- Figure 55: Asia Pacific Kitchen Meal Preparation Scale Revenue (undefined), by Types 2025 & 2033
- Figure 56: Asia Pacific Kitchen Meal Preparation Scale Volume (K), by Types 2025 & 2033
- Figure 57: Asia Pacific Kitchen Meal Preparation Scale Revenue Share (%), by Types 2025 & 2033
- Figure 58: Asia Pacific Kitchen Meal Preparation Scale Volume Share (%), by Types 2025 & 2033
- Figure 59: Asia Pacific Kitchen Meal Preparation Scale Revenue (undefined), by Country 2025 & 2033
- Figure 60: Asia Pacific Kitchen Meal Preparation Scale Volume (K), by Country 2025 & 2033
- Figure 61: Asia Pacific Kitchen Meal Preparation Scale Revenue Share (%), by Country 2025 & 2033
- Figure 62: Asia Pacific Kitchen Meal Preparation Scale Volume Share (%), by Country 2025 & 2033
List of Tables
- Table 1: Global Kitchen Meal Preparation Scale Revenue undefined Forecast, by Application 2020 & 2033
- Table 2: Global Kitchen Meal Preparation Scale Volume K Forecast, by Application 2020 & 2033
- Table 3: Global Kitchen Meal Preparation Scale Revenue undefined Forecast, by Types 2020 & 2033
- Table 4: Global Kitchen Meal Preparation Scale Volume K Forecast, by Types 2020 & 2033
- Table 5: Global Kitchen Meal Preparation Scale Revenue undefined Forecast, by Region 2020 & 2033
- Table 6: Global Kitchen Meal Preparation Scale Volume K Forecast, by Region 2020 & 2033
- Table 7: Global Kitchen Meal Preparation Scale Revenue undefined Forecast, by Application 2020 & 2033
- Table 8: Global Kitchen Meal Preparation Scale Volume K Forecast, by Application 2020 & 2033
- Table 9: Global Kitchen Meal Preparation Scale Revenue undefined Forecast, by Types 2020 & 2033
- Table 10: Global Kitchen Meal Preparation Scale Volume K Forecast, by Types 2020 & 2033
- Table 11: Global Kitchen Meal Preparation Scale Revenue undefined Forecast, by Country 2020 & 2033
- Table 12: Global Kitchen Meal Preparation Scale Volume K Forecast, by Country 2020 & 2033
- Table 13: United States Kitchen Meal Preparation Scale Revenue (undefined) Forecast, by Application 2020 & 2033
- Table 14: United States Kitchen Meal Preparation Scale Volume (K) Forecast, by Application 2020 & 2033
- Table 15: Canada Kitchen Meal Preparation Scale Revenue (undefined) Forecast, by Application 2020 & 2033
- Table 16: Canada Kitchen Meal Preparation Scale Volume (K) Forecast, by Application 2020 & 2033
- Table 17: Mexico Kitchen Meal Preparation Scale Revenue (undefined) Forecast, by Application 2020 & 2033
- Table 18: Mexico Kitchen Meal Preparation Scale Volume (K) Forecast, by Application 2020 & 2033
- Table 19: Global Kitchen Meal Preparation Scale Revenue undefined Forecast, by Application 2020 & 2033
- Table 20: Global Kitchen Meal Preparation Scale Volume K Forecast, by Application 2020 & 2033
- Table 21: Global Kitchen Meal Preparation Scale Revenue undefined Forecast, by Types 2020 & 2033
- Table 22: Global Kitchen Meal Preparation Scale Volume K Forecast, by Types 2020 & 2033
- Table 23: Global Kitchen Meal Preparation Scale Revenue undefined Forecast, by Country 2020 & 2033
- Table 24: Global Kitchen Meal Preparation Scale Volume K Forecast, by Country 2020 & 2033
- Table 25: Brazil Kitchen Meal Preparation Scale Revenue (undefined) Forecast, by Application 2020 & 2033
- Table 26: Brazil Kitchen Meal Preparation Scale Volume (K) Forecast, by Application 2020 & 2033
- Table 27: Argentina Kitchen Meal Preparation Scale Revenue (undefined) Forecast, by Application 2020 & 2033
- Table 28: Argentina Kitchen Meal Preparation Scale Volume (K) Forecast, by Application 2020 & 2033
- Table 29: Rest of South America Kitchen Meal Preparation Scale Revenue (undefined) Forecast, by Application 2020 & 2033
- Table 30: Rest of South America Kitchen Meal Preparation Scale Volume (K) Forecast, by Application 2020 & 2033
- Table 31: Global Kitchen Meal Preparation Scale Revenue undefined Forecast, by Application 2020 & 2033
- Table 32: Global Kitchen Meal Preparation Scale Volume K Forecast, by Application 2020 & 2033
- Table 33: Global Kitchen Meal Preparation Scale Revenue undefined Forecast, by Types 2020 & 2033
- Table 34: Global Kitchen Meal Preparation Scale Volume K Forecast, by Types 2020 & 2033
- Table 35: Global Kitchen Meal Preparation Scale Revenue undefined Forecast, by Country 2020 & 2033
- Table 36: Global Kitchen Meal Preparation Scale Volume K Forecast, by Country 2020 & 2033
- Table 37: United Kingdom Kitchen Meal Preparation Scale Revenue (undefined) Forecast, by Application 2020 & 2033
- Table 38: United Kingdom Kitchen Meal Preparation Scale Volume (K) Forecast, by Application 2020 & 2033
- Table 39: Germany Kitchen Meal Preparation Scale Revenue (undefined) Forecast, by Application 2020 & 2033
- Table 40: Germany Kitchen Meal Preparation Scale Volume (K) Forecast, by Application 2020 & 2033
- Table 41: France Kitchen Meal Preparation Scale Revenue (undefined) Forecast, by Application 2020 & 2033
- Table 42: France Kitchen Meal Preparation Scale Volume (K) Forecast, by Application 2020 & 2033
- Table 43: Italy Kitchen Meal Preparation Scale Revenue (undefined) Forecast, by Application 2020 & 2033
- Table 44: Italy Kitchen Meal Preparation Scale Volume (K) Forecast, by Application 2020 & 2033
- Table 45: Spain Kitchen Meal Preparation Scale Revenue (undefined) Forecast, by Application 2020 & 2033
- Table 46: Spain Kitchen Meal Preparation Scale Volume (K) Forecast, by Application 2020 & 2033
- Table 47: Russia Kitchen Meal Preparation Scale Revenue (undefined) Forecast, by Application 2020 & 2033
- Table 48: Russia Kitchen Meal Preparation Scale Volume (K) Forecast, by Application 2020 & 2033
- Table 49: Benelux Kitchen Meal Preparation Scale Revenue (undefined) Forecast, by Application 2020 & 2033
- Table 50: Benelux Kitchen Meal Preparation Scale Volume (K) Forecast, by Application 2020 & 2033
- Table 51: Nordics Kitchen Meal Preparation Scale Revenue (undefined) Forecast, by Application 2020 & 2033
- Table 52: Nordics Kitchen Meal Preparation Scale Volume (K) Forecast, by Application 2020 & 2033
- Table 53: Rest of Europe Kitchen Meal Preparation Scale Revenue (undefined) Forecast, by Application 2020 & 2033
- Table 54: Rest of Europe Kitchen Meal Preparation Scale Volume (K) Forecast, by Application 2020 & 2033
- Table 55: Global Kitchen Meal Preparation Scale Revenue undefined Forecast, by Application 2020 & 2033
- Table 56: Global Kitchen Meal Preparation Scale Volume K Forecast, by Application 2020 & 2033
- Table 57: Global Kitchen Meal Preparation Scale Revenue undefined Forecast, by Types 2020 & 2033
- Table 58: Global Kitchen Meal Preparation Scale Volume K Forecast, by Types 2020 & 2033
- Table 59: Global Kitchen Meal Preparation Scale Revenue undefined Forecast, by Country 2020 & 2033
- Table 60: Global Kitchen Meal Preparation Scale Volume K Forecast, by Country 2020 & 2033
- Table 61: Turkey Kitchen Meal Preparation Scale Revenue (undefined) Forecast, by Application 2020 & 2033
- Table 62: Turkey Kitchen Meal Preparation Scale Volume (K) Forecast, by Application 2020 & 2033
- Table 63: Israel Kitchen Meal Preparation Scale Revenue (undefined) Forecast, by Application 2020 & 2033
- Table 64: Israel Kitchen Meal Preparation Scale Volume (K) Forecast, by Application 2020 & 2033
- Table 65: GCC Kitchen Meal Preparation Scale Revenue (undefined) Forecast, by Application 2020 & 2033
- Table 66: GCC Kitchen Meal Preparation Scale Volume (K) Forecast, by Application 2020 & 2033
- Table 67: North Africa Kitchen Meal Preparation Scale Revenue (undefined) Forecast, by Application 2020 & 2033
- Table 68: North Africa Kitchen Meal Preparation Scale Volume (K) Forecast, by Application 2020 & 2033
- Table 69: South Africa Kitchen Meal Preparation Scale Revenue (undefined) Forecast, by Application 2020 & 2033
- Table 70: South Africa Kitchen Meal Preparation Scale Volume (K) Forecast, by Application 2020 & 2033
- Table 71: Rest of Middle East & Africa Kitchen Meal Preparation Scale Revenue (undefined) Forecast, by Application 2020 & 2033
- Table 72: Rest of Middle East & Africa Kitchen Meal Preparation Scale Volume (K) Forecast, by Application 2020 & 2033
- Table 73: Global Kitchen Meal Preparation Scale Revenue undefined Forecast, by Application 2020 & 2033
- Table 74: Global Kitchen Meal Preparation Scale Volume K Forecast, by Application 2020 & 2033
- Table 75: Global Kitchen Meal Preparation Scale Revenue undefined Forecast, by Types 2020 & 2033
- Table 76: Global Kitchen Meal Preparation Scale Volume K Forecast, by Types 2020 & 2033
- Table 77: Global Kitchen Meal Preparation Scale Revenue undefined Forecast, by Country 2020 & 2033
- Table 78: Global Kitchen Meal Preparation Scale Volume K Forecast, by Country 2020 & 2033
- Table 79: China Kitchen Meal Preparation Scale Revenue (undefined) Forecast, by Application 2020 & 2033
- Table 80: China Kitchen Meal Preparation Scale Volume (K) Forecast, by Application 2020 & 2033
- Table 81: India Kitchen Meal Preparation Scale Revenue (undefined) Forecast, by Application 2020 & 2033
- Table 82: India Kitchen Meal Preparation Scale Volume (K) Forecast, by Application 2020 & 2033
- Table 83: Japan Kitchen Meal Preparation Scale Revenue (undefined) Forecast, by Application 2020 & 2033
- Table 84: Japan Kitchen Meal Preparation Scale Volume (K) Forecast, by Application 2020 & 2033
- Table 85: South Korea Kitchen Meal Preparation Scale Revenue (undefined) Forecast, by Application 2020 & 2033
- Table 86: South Korea Kitchen Meal Preparation Scale Volume (K) Forecast, by Application 2020 & 2033
- Table 87: ASEAN Kitchen Meal Preparation Scale Revenue (undefined) Forecast, by Application 2020 & 2033
- Table 88: ASEAN Kitchen Meal Preparation Scale Volume (K) Forecast, by Application 2020 & 2033
- Table 89: Oceania Kitchen Meal Preparation Scale Revenue (undefined) Forecast, by Application 2020 & 2033
- Table 90: Oceania Kitchen Meal Preparation Scale Volume (K) Forecast, by Application 2020 & 2033
- Table 91: Rest of Asia Pacific Kitchen Meal Preparation Scale Revenue (undefined) Forecast, by Application 2020 & 2033
- Table 92: Rest of Asia Pacific Kitchen Meal Preparation Scale Volume (K) Forecast, by Application 2020 & 2033
Frequently Asked Questions
1. What is the projected Compound Annual Growth Rate (CAGR) of the Kitchen Meal Preparation Scale?
The projected CAGR is approximately 8.4%.
2. Which companies are prominent players in the Kitchen Meal Preparation Scale?
Key companies in the market include Etekcity, Smart Weigh, NUTRI FIT, Yoncon, Digital Scales Company, Charder, Weightron, Brecknell, Arlyn Scales, Hogentogler & Co Inc, Salter.
3. What are the main segments of the Kitchen Meal Preparation Scale?
The market segments include Application, Types.
4. Can you provide details about the market size?
The market size is estimated to be USD XXX N/A as of 2022.
5. What are some drivers contributing to market growth?
N/A
6. What are the notable trends driving market growth?
N/A
7. Are there any restraints impacting market growth?
N/A
8. Can you provide examples of recent developments in the market?
N/A
9. What pricing options are available for accessing the report?
Pricing options include single-user, multi-user, and enterprise licenses priced at USD 4350.00, USD 6525.00, and USD 8700.00 respectively.
10. Is the market size provided in terms of value or volume?
The market size is provided in terms of value, measured in N/A and volume, measured in K.
11. Are there any specific market keywords associated with the report?
Yes, the market keyword associated with the report is "Kitchen Meal Preparation Scale," which aids in identifying and referencing the specific market segment covered.
12. How do I determine which pricing option suits my needs best?
The pricing options vary based on user requirements and access needs. Individual users may opt for single-user licenses, while businesses requiring broader access may choose multi-user or enterprise licenses for cost-effective access to the report.
13. Are there any additional resources or data provided in the Kitchen Meal Preparation Scale report?
While the report offers comprehensive insights, it's advisable to review the specific contents or supplementary materials provided to ascertain if additional resources or data are available.
14. How can I stay updated on further developments or reports in the Kitchen Meal Preparation Scale?
To stay informed about further developments, trends, and reports in the Kitchen Meal Preparation Scale, consider subscribing to industry newsletters, following relevant companies and organizations, or regularly checking reputable industry news sources and publications.
Methodology
Step 1 - Identification of Relevant Samples Size from Population Database


Step 2 - Approaches for Defining Global Market Size (Value, Volume* & Price*)

Note*: In applicable scenarios
Step 3 - Data Sources
Primary Research
- Web Analytics
- Survey Reports
- Research Institute
- Latest Research Reports
- Opinion Leaders
Secondary Research
- Annual Reports
- White Paper
- Latest Press Release
- Industry Association
- Paid Database
- Investor Presentations

Step 4 - Data Triangulation
Involves using different sources of information in order to increase the validity of a study
These sources are likely to be stakeholders in a program - participants, other researchers, program staff, other community members, and so on.
Then we put all data in single framework & apply various statistical tools to find out the dynamic on the market.
During the analysis stage, feedback from the stakeholder groups would be compared to determine areas of agreement as well as areas of divergence