

Key Insights
The Integrated Pest Management (IPM) pheromone products market is experiencing robust growth, projected to reach a substantial market size driven by increasing demand for eco-friendly pest control solutions. The market's Compound Annual Growth Rate (CAGR) of 10.50% from 2019-2033 indicates a significant upward trajectory. This growth is fueled by several key factors. Firstly, the rising awareness of the harmful effects of synthetic pesticides on the environment and human health is pushing farmers and agricultural professionals towards more sustainable pest management strategies. Pheromones offer a precise and targeted approach, minimizing environmental impact and reducing reliance on harmful chemicals. Secondly, the increasing prevalence of pest resistance to conventional insecticides is driving the adoption of pheromone-based solutions as an effective alternative. The market is segmented by type (pheromones, aggregation pheromones, others), function (mating disruption, detection & monitoring, mass trapping), mode of application (traps, lures, dispensers), and crop type (field crops, vegetable crops, other crops). The diverse applications across various agricultural sectors further contribute to market expansion. Leading companies like Russell IPM, Syngenta Bioline, and BASF SE are actively investing in research and development, introducing innovative pheromone products to cater to evolving market needs and expand their market share. Geographic expansion, particularly in developing economies with growing agricultural sectors, also presents significant opportunities for market growth.
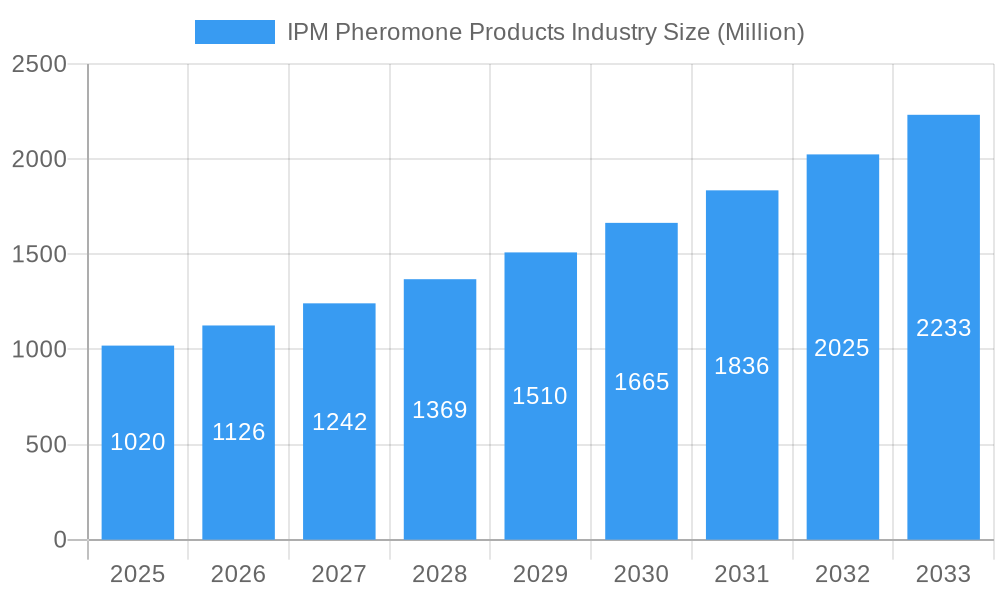
IPM Pheromone Products Industry Market Size (In Billion)
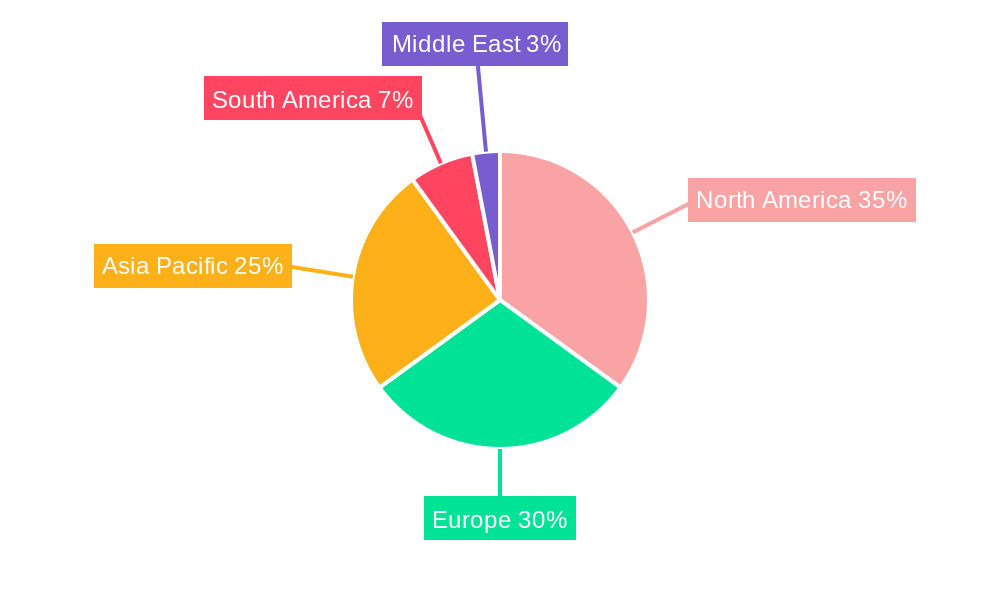
The regional distribution of the IPM pheromone market shows strong growth potential across various regions. North America and Europe currently hold substantial market shares, owing to the established agricultural practices and regulatory frameworks supporting sustainable pest management. However, the Asia-Pacific region, especially India and China, exhibits significant growth potential, driven by the expanding agricultural sector and increasing adoption of advanced pest management technologies. South America and the Middle East also present promising opportunities as awareness of sustainable agriculture grows and government initiatives promoting eco-friendly pest control gain momentum. While challenges remain, such as the relatively high cost of pheromone-based products compared to conventional insecticides and the need for sophisticated application techniques, the overall market outlook for IPM pheromone products remains extremely positive, promising substantial growth and significant market penetration in the coming years.
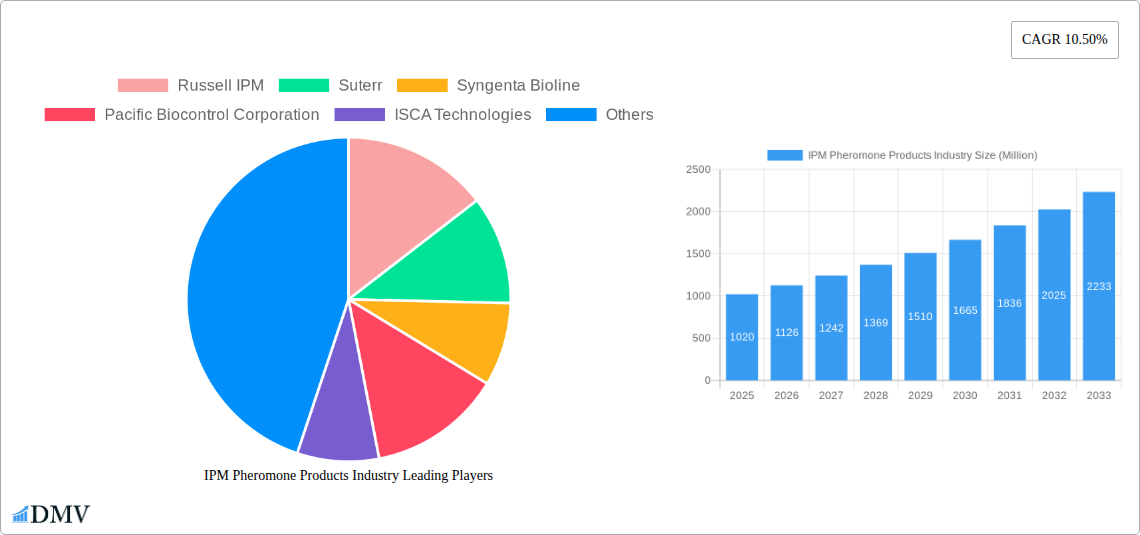
IPM Pheromone Products Industry Company Market Share
This comprehensive report provides an in-depth analysis of the IPM Pheromone Products industry, offering valuable insights for stakeholders seeking to navigate this dynamic market. The study period covers 2019-2033, with a base year of 2025 and a forecast period of 2025-2033. We analyze a market expected to reach xx Million by 2033, driven by increasing adoption of sustainable pest management practices.
IPM Pheromone Products Industry Market Composition & Trends
This section analyzes the competitive landscape, innovation drivers, regulatory factors, and market dynamics within the IPM Pheromone Products industry. The market exhibits a moderately concentrated structure, with key players like Syngenta Bioline, BASF SE, and Russell IPM holding significant market share. However, the presence of several smaller, specialized companies fosters innovation.
Market Share Distribution (2024 Estimate):
- Syngenta Bioline: 20%
- BASF SE: 15%
- Russell IPM: 12%
- Others: 53%
Innovation Catalysts:
- Development of novel pheromone blends for enhanced efficacy.
- Advancements in dispenser technology for improved longevity and release rates.
- Integration of pheromone-based IPM with digital monitoring systems.
Regulatory Landscape: Stringent regulations concerning pesticide use are driving the adoption of IPM strategies, including pheromone-based approaches, particularly in regions with strict environmental protection laws like the EU and North America.
Substitute Products: While some biological control agents offer partial substitution, pheromones remain a unique and effective solution for specific pest management needs.
End-User Profiles: The primary end-users are farmers (both large-scale commercial and smaller operations), government agencies involved in pest control, and specialized pest management companies.
M&A Activities: The industry has witnessed several mergers and acquisitions (M&A) in recent years, with deal values averaging approximately xx Million per transaction. These activities primarily involve larger companies acquiring smaller, specialized firms to expand their product portfolios and technological capabilities.
IPM Pheromone Products Industry Industry Evolution
The IPM pheromone products market has experienced consistent growth throughout the historical period (2019-2024), driven by increasing awareness of the negative impacts of traditional chemical pesticides. Technological advancements, such as the development of more effective pheromone formulations and improved dispensing technologies, have further fueled market expansion. The market exhibited a Compound Annual Growth Rate (CAGR) of xx% during 2019-2024, reaching xx Million in 2024. The shift towards sustainable agriculture practices, coupled with rising consumer demand for pesticide-free produce, is propelling significant growth in the forecast period (2025-2033). We project a CAGR of xx% for 2025-2033, resulting in a market size of xx Million by 2033.
Leading Regions, Countries, or Segments in IPM Pheromone Products Industry
Dominant Regions: North America and Europe currently lead the market, driven by stringent regulations on synthetic pesticides, increasing adoption of sustainable farming practices, and high consumer awareness regarding pesticide residues in food. Asia-Pacific is also showing strong growth potential due to the expanding agricultural sector and rising disposable incomes.
Dominant Segments:
By Type: Pheromones constitute the largest segment, followed by aggregation pheromones. The “Others” category includes kairomones and other semiochemicals used in IPM strategies.
By Function: Mating disruption is currently the most widely adopted application, followed by detection and monitoring. Mass trapping is gaining traction, especially in specific applications.
By Mode of Application: Traps are the dominant application method, owing to their cost-effectiveness and ease of use. Dispensers and lures are seeing increasing adoption, due to their longer duration of efficacy.
By Crops: Field crops currently represent the largest market segment, followed by vegetable crops. The "Other Crops" segment includes fruits, nuts, and ornamentals, all experiencing gradual market penetration.
Key Drivers (Bullet Points):
- Investment Trends: Significant investments in R&D are driving the development of more effective and targeted pheromone products.
- Regulatory Support: Government policies and regulations promoting sustainable agriculture are boosting market growth.
- Consumer Demand: Rising consumer demand for pesticide-free produce creates a strong market pull for IPM solutions.
IPM Pheromone Products Industry Product Innovations
Recent product innovations focus on enhancing pheromone efficacy and developing new delivery systems. For example, microencapsulated pheromones prolong release, while novel dispenser designs improve effectiveness and reduce environmental impact. Many manufacturers are incorporating digital technologies, such as smart traps, for improved pest monitoring and data analysis, offering a unique selling proposition of optimized pest control with data-driven insights. Technological advancements like using AI in analyzing pheromone data lead to better prediction of pest infestations and timely application.
Propelling Factors for IPM Pheromone Products Industry Growth
Technological advancements, coupled with a growing awareness of environmental concerns and increasing demand for sustainable agricultural practices, are driving the growth of the IPM pheromone products industry. Stringent regulations on synthetic pesticides in several regions further support this trend. Economic incentives and government subsidies aimed at promoting sustainable agriculture practices also play a significant role.
Obstacles in the IPM Pheromone Products Industry Market
The industry faces challenges such as high initial investment costs, the potential for pheromone resistance development in pests, and variations in pheromone efficacy due to environmental factors. Supply chain disruptions, particularly in sourcing key raw materials, and intense competition from established players and newer entrants can also impact market growth.
Future Opportunities in IPM Pheromone Products Industry
Emerging opportunities include the development of novel pheromone blends targeting specific pest species, integration with precision agriculture technologies, and expansion into new geographic markets. Growing demand for sustainable practices in non-agricultural applications, such as public health and forestry, presents further opportunities. Innovative applications like pheromone-based smart traps and the potential for developing pheromone-based resistance management strategies represent key opportunities for the future.
Major Players in the IPM Pheromone Products Industry Ecosystem
- Russell IPM
- Suterr
- Syngenta Bioline
- Pacific Biocontrol Corporation
- ISCA Technologies
- Shin-Etsu
- Hercon Environmental
- Sumi Agro France
- Isagro
- BASF SE
Key Developments in IPM Pheromone Products Industry Industry
- 2022-Q4: Syngenta Bioline launched a new line of pheromone dispensers with improved longevity.
- 2023-Q1: Russell IPM acquired a smaller pheromone producer, expanding its product portfolio.
- 2023-Q3: BASF SE announced a significant investment in R&D for new pheromone formulations.
Strategic IPM Pheromone Products Industry Market Forecast
The IPM pheromone products market is poised for significant growth, driven by the increasing adoption of sustainable pest management practices, stringent regulations on synthetic pesticides, and rising consumer demand for pesticide-free produce. Ongoing technological advancements and the development of innovative products are expected to further fuel market expansion in the coming years, offering substantial opportunities for industry players. The market is expected to achieve a total addressable market value of xx Million by 2033.
IPM Pheromone Products Industry Segmentation
- 1. Production Analysis
- 2. Consumption Analysis
- 3. Import Market Analysis (Value & Volume)
- 4. Export Market Analysis (Value & Volume)
- 5. Price Trend Analysis
IPM Pheromone Products Industry Segmentation By Geography
-
1. North America
- 1.1. United States
- 1.2. Canada
- 1.3. Mexico
-
2. South America
- 2.1. Brazil
- 2.2. Argentina
- 2.3. Rest of South America
-
3. Europe
- 3.1. United Kingdom
- 3.2. Germany
- 3.3. France
- 3.4. Italy
- 3.5. Spain
- 3.6. Russia
- 3.7. Benelux
- 3.8. Nordics
- 3.9. Rest of Europe
-
4. Middle East & Africa
- 4.1. Turkey
- 4.2. Israel
- 4.3. GCC
- 4.4. North Africa
- 4.5. South Africa
- 4.6. Rest of Middle East & Africa
-
5. Asia Pacific
- 5.1. China
- 5.2. India
- 5.3. Japan
- 5.4. South Korea
- 5.5. ASEAN
- 5.6. Oceania
- 5.7. Rest of Asia Pacific
IPM Pheromone Products Industry Regional Market Share
Geographic Coverage of IPM Pheromone Products Industry
IPM Pheromone Products Industry REPORT HIGHLIGHTS
| Aspects | Details |
|---|---|
| Study Period | 2020-2034 |
| Base Year | 2025 |
| Estimated Year | 2026 |
| Forecast Period | 2026-2034 |
| Historical Period | 2020-2025 |
| Growth Rate | CAGR of 10.50% from 2020-2034 |
| Segmentation |
|
Table of Contents
- 1. Introduction
- 1.1. Research Scope
- 1.2. Market Segmentation
- 1.3. Research Objective
- 1.4. Definitions and Assumptions
- 2. Executive Summary
- 2.1. Market Snapshot
- 3. Market Dynamics
- 3.1. Market Drivers
- 3.2. Market Restrains
- 3.3. Market Trends
- 3.4. Market Opportunities
- 4. Market Factor Analysis
- 4.1. Porters Five Forces
- 4.1.1. Bargaining Power of Suppliers
- 4.1.2. Bargaining Power of Buyers
- 4.1.3. Threat of New Entrants
- 4.1.4. Threat of Substitutes
- 4.1.5. Competitive Rivalry
- 4.2. PESTEL analysis
- 4.3. BCG Analysis
- 4.3.1. Stars (High Growth, High Market Share)
- 4.3.2. Cash Cows (Low Growth, High Market Share)
- 4.3.3. Question Mark (High Growth, Low Market Share)
- 4.3.4. Dogs (Low Growth, Low Market Share)
- 4.4. Ansoff Matrix Analysis
- 4.5. Supply Chain Analysis
- 4.6. Regulatory Landscape
- 4.7. Current Market Potential and Opportunity Assessment (TAM–SAM–SOM Framework)
- 4.8. DMV Analyst Note
- 4.1. Porters Five Forces
- 5. Market Analysis, Insights and Forecast 2021-2033
- 5.1. Market Analysis, Insights and Forecast - by Production Analysis
- 5.2. Market Analysis, Insights and Forecast - by Consumption Analysis
- 5.3. Market Analysis, Insights and Forecast - by Import Market Analysis (Value & Volume)
- 5.4. Market Analysis, Insights and Forecast - by Export Market Analysis (Value & Volume)
- 5.5. Market Analysis, Insights and Forecast - by Price Trend Analysis
- 5.6. Market Analysis, Insights and Forecast - by Region
- 5.6.1. North America
- 5.6.2. South America
- 5.6.3. Europe
- 5.6.4. Middle East & Africa
- 5.6.5. Asia Pacific
- 6. Global IPM Pheromone Products Industry Analysis, Insights and Forecast, 2021-2033
- 6.1. Market Analysis, Insights and Forecast - by Production Analysis
- 6.2. Market Analysis, Insights and Forecast - by Consumption Analysis
- 6.3. Market Analysis, Insights and Forecast - by Import Market Analysis (Value & Volume)
- 6.4. Market Analysis, Insights and Forecast - by Export Market Analysis (Value & Volume)
- 6.5. Market Analysis, Insights and Forecast - by Price Trend Analysis
- 7. North America IPM Pheromone Products Industry Analysis, Insights and Forecast, 2020-2032
- 7.1. Market Analysis, Insights and Forecast - by Production Analysis
- 7.2. Market Analysis, Insights and Forecast - by Consumption Analysis
- 7.3. Market Analysis, Insights and Forecast - by Import Market Analysis (Value & Volume)
- 7.4. Market Analysis, Insights and Forecast - by Export Market Analysis (Value & Volume)
- 7.5. Market Analysis, Insights and Forecast - by Price Trend Analysis
- 8. South America IPM Pheromone Products Industry Analysis, Insights and Forecast, 2020-2032
- 8.1. Market Analysis, Insights and Forecast - by Production Analysis
- 8.2. Market Analysis, Insights and Forecast - by Consumption Analysis
- 8.3. Market Analysis, Insights and Forecast - by Import Market Analysis (Value & Volume)
- 8.4. Market Analysis, Insights and Forecast - by Export Market Analysis (Value & Volume)
- 8.5. Market Analysis, Insights and Forecast - by Price Trend Analysis
- 9. Europe IPM Pheromone Products Industry Analysis, Insights and Forecast, 2020-2032
- 9.1. Market Analysis, Insights and Forecast - by Production Analysis
- 9.2. Market Analysis, Insights and Forecast - by Consumption Analysis
- 9.3. Market Analysis, Insights and Forecast - by Import Market Analysis (Value & Volume)
- 9.4. Market Analysis, Insights and Forecast - by Export Market Analysis (Value & Volume)
- 9.5. Market Analysis, Insights and Forecast - by Price Trend Analysis
- 10. Middle East & Africa IPM Pheromone Products Industry Analysis, Insights and Forecast, 2020-2032
- 10.1. Market Analysis, Insights and Forecast - by Production Analysis
- 10.2. Market Analysis, Insights and Forecast - by Consumption Analysis
- 10.3. Market Analysis, Insights and Forecast - by Import Market Analysis (Value & Volume)
- 10.4. Market Analysis, Insights and Forecast - by Export Market Analysis (Value & Volume)
- 10.5. Market Analysis, Insights and Forecast - by Price Trend Analysis
- 11. Asia Pacific IPM Pheromone Products Industry Analysis, Insights and Forecast, 2020-2032
- 11.1. Market Analysis, Insights and Forecast - by Production Analysis
- 11.2. Market Analysis, Insights and Forecast - by Consumption Analysis
- 11.3. Market Analysis, Insights and Forecast - by Import Market Analysis (Value & Volume)
- 11.4. Market Analysis, Insights and Forecast - by Export Market Analysis (Value & Volume)
- 11.5. Market Analysis, Insights and Forecast - by Price Trend Analysis
- 12. Competitive Analysis
- 12.1. Company Profiles
- 12.1.1 Russell IPM
- 12.1.1.1. Company Overview
- 12.1.1.2. Products
- 12.1.1.3. Company Financials
- 12.1.1.4. SWOT Analysis
- 12.1.2 Suterr
- 12.1.2.1. Company Overview
- 12.1.2.2. Products
- 12.1.2.3. Company Financials
- 12.1.2.4. SWOT Analysis
- 12.1.3 Syngenta Bioline
- 12.1.3.1. Company Overview
- 12.1.3.2. Products
- 12.1.3.3. Company Financials
- 12.1.3.4. SWOT Analysis
- 12.1.4 Pacific Biocontrol Corporation
- 12.1.4.1. Company Overview
- 12.1.4.2. Products
- 12.1.4.3. Company Financials
- 12.1.4.4. SWOT Analysis
- 12.1.5 ISCA Technologies
- 12.1.5.1. Company Overview
- 12.1.5.2. Products
- 12.1.5.3. Company Financials
- 12.1.5.4. SWOT Analysis
- 12.1.6 Shin-Etsu
- 12.1.6.1. Company Overview
- 12.1.6.2. Products
- 12.1.6.3. Company Financials
- 12.1.6.4. SWOT Analysis
- 12.1.7 Hercon Environmental
- 12.1.7.1. Company Overview
- 12.1.7.2. Products
- 12.1.7.3. Company Financials
- 12.1.7.4. SWOT Analysis
- 12.1.8 Sumi Agro France
- 12.1.8.1. Company Overview
- 12.1.8.2. Products
- 12.1.8.3. Company Financials
- 12.1.8.4. SWOT Analysis
- 12.1.9 Isagro
- 12.1.9.1. Company Overview
- 12.1.9.2. Products
- 12.1.9.3. Company Financials
- 12.1.9.4. SWOT Analysis
- 12.1.10 BASF SE
- 12.1.10.1. Company Overview
- 12.1.10.2. Products
- 12.1.10.3. Company Financials
- 12.1.10.4. SWOT Analysis
- 12.1.1 Russell IPM
- 12.2. Market Entropy
- 12.2.1 Company's Key Areas Served
- 12.2.2 Recent Developments
- 12.3. Company Market Share Analysis 2025
- 12.3.1 Top 5 Companies Market Share Analysis
- 12.3.2 Top 3 Companies Market Share Analysis
- 12.4. List of Potential Customers
- 13. Research Methodology
List of Figures
- Figure 1: Global IPM Pheromone Products Industry Revenue Breakdown (Million, %) by Region 2025 & 2033
- Figure 2: North America IPM Pheromone Products Industry Revenue (Million), by Production Analysis 2025 & 2033
- Figure 3: North America IPM Pheromone Products Industry Revenue Share (%), by Production Analysis 2025 & 2033
- Figure 4: North America IPM Pheromone Products Industry Revenue (Million), by Consumption Analysis 2025 & 2033
- Figure 5: North America IPM Pheromone Products Industry Revenue Share (%), by Consumption Analysis 2025 & 2033
- Figure 6: North America IPM Pheromone Products Industry Revenue (Million), by Import Market Analysis (Value & Volume) 2025 & 2033
- Figure 7: North America IPM Pheromone Products Industry Revenue Share (%), by Import Market Analysis (Value & Volume) 2025 & 2033
- Figure 8: North America IPM Pheromone Products Industry Revenue (Million), by Export Market Analysis (Value & Volume) 2025 & 2033
- Figure 9: North America IPM Pheromone Products Industry Revenue Share (%), by Export Market Analysis (Value & Volume) 2025 & 2033
- Figure 10: North America IPM Pheromone Products Industry Revenue (Million), by Price Trend Analysis 2025 & 2033
- Figure 11: North America IPM Pheromone Products Industry Revenue Share (%), by Price Trend Analysis 2025 & 2033
- Figure 12: North America IPM Pheromone Products Industry Revenue (Million), by Country 2025 & 2033
- Figure 13: North America IPM Pheromone Products Industry Revenue Share (%), by Country 2025 & 2033
- Figure 14: South America IPM Pheromone Products Industry Revenue (Million), by Production Analysis 2025 & 2033
- Figure 15: South America IPM Pheromone Products Industry Revenue Share (%), by Production Analysis 2025 & 2033
- Figure 16: South America IPM Pheromone Products Industry Revenue (Million), by Consumption Analysis 2025 & 2033
- Figure 17: South America IPM Pheromone Products Industry Revenue Share (%), by Consumption Analysis 2025 & 2033
- Figure 18: South America IPM Pheromone Products Industry Revenue (Million), by Import Market Analysis (Value & Volume) 2025 & 2033
- Figure 19: South America IPM Pheromone Products Industry Revenue Share (%), by Import Market Analysis (Value & Volume) 2025 & 2033
- Figure 20: South America IPM Pheromone Products Industry Revenue (Million), by Export Market Analysis (Value & Volume) 2025 & 2033
- Figure 21: South America IPM Pheromone Products Industry Revenue Share (%), by Export Market Analysis (Value & Volume) 2025 & 2033
- Figure 22: South America IPM Pheromone Products Industry Revenue (Million), by Price Trend Analysis 2025 & 2033
- Figure 23: South America IPM Pheromone Products Industry Revenue Share (%), by Price Trend Analysis 2025 & 2033
- Figure 24: South America IPM Pheromone Products Industry Revenue (Million), by Country 2025 & 2033
- Figure 25: South America IPM Pheromone Products Industry Revenue Share (%), by Country 2025 & 2033
- Figure 26: Europe IPM Pheromone Products Industry Revenue (Million), by Production Analysis 2025 & 2033
- Figure 27: Europe IPM Pheromone Products Industry Revenue Share (%), by Production Analysis 2025 & 2033
- Figure 28: Europe IPM Pheromone Products Industry Revenue (Million), by Consumption Analysis 2025 & 2033
- Figure 29: Europe IPM Pheromone Products Industry Revenue Share (%), by Consumption Analysis 2025 & 2033
- Figure 30: Europe IPM Pheromone Products Industry Revenue (Million), by Import Market Analysis (Value & Volume) 2025 & 2033
- Figure 31: Europe IPM Pheromone Products Industry Revenue Share (%), by Import Market Analysis (Value & Volume) 2025 & 2033
- Figure 32: Europe IPM Pheromone Products Industry Revenue (Million), by Export Market Analysis (Value & Volume) 2025 & 2033
- Figure 33: Europe IPM Pheromone Products Industry Revenue Share (%), by Export Market Analysis (Value & Volume) 2025 & 2033
- Figure 34: Europe IPM Pheromone Products Industry Revenue (Million), by Price Trend Analysis 2025 & 2033
- Figure 35: Europe IPM Pheromone Products Industry Revenue Share (%), by Price Trend Analysis 2025 & 2033
- Figure 36: Europe IPM Pheromone Products Industry Revenue (Million), by Country 2025 & 2033
- Figure 37: Europe IPM Pheromone Products Industry Revenue Share (%), by Country 2025 & 2033
- Figure 38: Middle East & Africa IPM Pheromone Products Industry Revenue (Million), by Production Analysis 2025 & 2033
- Figure 39: Middle East & Africa IPM Pheromone Products Industry Revenue Share (%), by Production Analysis 2025 & 2033
- Figure 40: Middle East & Africa IPM Pheromone Products Industry Revenue (Million), by Consumption Analysis 2025 & 2033
- Figure 41: Middle East & Africa IPM Pheromone Products Industry Revenue Share (%), by Consumption Analysis 2025 & 2033
- Figure 42: Middle East & Africa IPM Pheromone Products Industry Revenue (Million), by Import Market Analysis (Value & Volume) 2025 & 2033
- Figure 43: Middle East & Africa IPM Pheromone Products Industry Revenue Share (%), by Import Market Analysis (Value & Volume) 2025 & 2033
- Figure 44: Middle East & Africa IPM Pheromone Products Industry Revenue (Million), by Export Market Analysis (Value & Volume) 2025 & 2033
- Figure 45: Middle East & Africa IPM Pheromone Products Industry Revenue Share (%), by Export Market Analysis (Value & Volume) 2025 & 2033
- Figure 46: Middle East & Africa IPM Pheromone Products Industry Revenue (Million), by Price Trend Analysis 2025 & 2033
- Figure 47: Middle East & Africa IPM Pheromone Products Industry Revenue Share (%), by Price Trend Analysis 2025 & 2033
- Figure 48: Middle East & Africa IPM Pheromone Products Industry Revenue (Million), by Country 2025 & 2033
- Figure 49: Middle East & Africa IPM Pheromone Products Industry Revenue Share (%), by Country 2025 & 2033
- Figure 50: Asia Pacific IPM Pheromone Products Industry Revenue (Million), by Production Analysis 2025 & 2033
- Figure 51: Asia Pacific IPM Pheromone Products Industry Revenue Share (%), by Production Analysis 2025 & 2033
- Figure 52: Asia Pacific IPM Pheromone Products Industry Revenue (Million), by Consumption Analysis 2025 & 2033
- Figure 53: Asia Pacific IPM Pheromone Products Industry Revenue Share (%), by Consumption Analysis 2025 & 2033
- Figure 54: Asia Pacific IPM Pheromone Products Industry Revenue (Million), by Import Market Analysis (Value & Volume) 2025 & 2033
- Figure 55: Asia Pacific IPM Pheromone Products Industry Revenue Share (%), by Import Market Analysis (Value & Volume) 2025 & 2033
- Figure 56: Asia Pacific IPM Pheromone Products Industry Revenue (Million), by Export Market Analysis (Value & Volume) 2025 & 2033
- Figure 57: Asia Pacific IPM Pheromone Products Industry Revenue Share (%), by Export Market Analysis (Value & Volume) 2025 & 2033
- Figure 58: Asia Pacific IPM Pheromone Products Industry Revenue (Million), by Price Trend Analysis 2025 & 2033
- Figure 59: Asia Pacific IPM Pheromone Products Industry Revenue Share (%), by Price Trend Analysis 2025 & 2033
- Figure 60: Asia Pacific IPM Pheromone Products Industry Revenue (Million), by Country 2025 & 2033
- Figure 61: Asia Pacific IPM Pheromone Products Industry Revenue Share (%), by Country 2025 & 2033
List of Tables
- Table 1: Global IPM Pheromone Products Industry Revenue Million Forecast, by Production Analysis 2020 & 2033
- Table 2: Global IPM Pheromone Products Industry Revenue Million Forecast, by Consumption Analysis 2020 & 2033
- Table 3: Global IPM Pheromone Products Industry Revenue Million Forecast, by Import Market Analysis (Value & Volume) 2020 & 2033
- Table 4: Global IPM Pheromone Products Industry Revenue Million Forecast, by Export Market Analysis (Value & Volume) 2020 & 2033
- Table 5: Global IPM Pheromone Products Industry Revenue Million Forecast, by Price Trend Analysis 2020 & 2033
- Table 6: Global IPM Pheromone Products Industry Revenue Million Forecast, by Region 2020 & 2033
- Table 7: Global IPM Pheromone Products Industry Revenue Million Forecast, by Production Analysis 2020 & 2033
- Table 8: Global IPM Pheromone Products Industry Revenue Million Forecast, by Consumption Analysis 2020 & 2033
- Table 9: Global IPM Pheromone Products Industry Revenue Million Forecast, by Import Market Analysis (Value & Volume) 2020 & 2033
- Table 10: Global IPM Pheromone Products Industry Revenue Million Forecast, by Export Market Analysis (Value & Volume) 2020 & 2033
- Table 11: Global IPM Pheromone Products Industry Revenue Million Forecast, by Price Trend Analysis 2020 & 2033
- Table 12: Global IPM Pheromone Products Industry Revenue Million Forecast, by Country 2020 & 2033
- Table 13: United States IPM Pheromone Products Industry Revenue (Million) Forecast, by Application 2020 & 2033
- Table 14: Canada IPM Pheromone Products Industry Revenue (Million) Forecast, by Application 2020 & 2033
- Table 15: Mexico IPM Pheromone Products Industry Revenue (Million) Forecast, by Application 2020 & 2033
- Table 16: Global IPM Pheromone Products Industry Revenue Million Forecast, by Production Analysis 2020 & 2033
- Table 17: Global IPM Pheromone Products Industry Revenue Million Forecast, by Consumption Analysis 2020 & 2033
- Table 18: Global IPM Pheromone Products Industry Revenue Million Forecast, by Import Market Analysis (Value & Volume) 2020 & 2033
- Table 19: Global IPM Pheromone Products Industry Revenue Million Forecast, by Export Market Analysis (Value & Volume) 2020 & 2033
- Table 20: Global IPM Pheromone Products Industry Revenue Million Forecast, by Price Trend Analysis 2020 & 2033
- Table 21: Global IPM Pheromone Products Industry Revenue Million Forecast, by Country 2020 & 2033
- Table 22: Brazil IPM Pheromone Products Industry Revenue (Million) Forecast, by Application 2020 & 2033
- Table 23: Argentina IPM Pheromone Products Industry Revenue (Million) Forecast, by Application 2020 & 2033
- Table 24: Rest of South America IPM Pheromone Products Industry Revenue (Million) Forecast, by Application 2020 & 2033
- Table 25: Global IPM Pheromone Products Industry Revenue Million Forecast, by Production Analysis 2020 & 2033
- Table 26: Global IPM Pheromone Products Industry Revenue Million Forecast, by Consumption Analysis 2020 & 2033
- Table 27: Global IPM Pheromone Products Industry Revenue Million Forecast, by Import Market Analysis (Value & Volume) 2020 & 2033
- Table 28: Global IPM Pheromone Products Industry Revenue Million Forecast, by Export Market Analysis (Value & Volume) 2020 & 2033
- Table 29: Global IPM Pheromone Products Industry Revenue Million Forecast, by Price Trend Analysis 2020 & 2033
- Table 30: Global IPM Pheromone Products Industry Revenue Million Forecast, by Country 2020 & 2033
- Table 31: United Kingdom IPM Pheromone Products Industry Revenue (Million) Forecast, by Application 2020 & 2033
- Table 32: Germany IPM Pheromone Products Industry Revenue (Million) Forecast, by Application 2020 & 2033
- Table 33: France IPM Pheromone Products Industry Revenue (Million) Forecast, by Application 2020 & 2033
- Table 34: Italy IPM Pheromone Products Industry Revenue (Million) Forecast, by Application 2020 & 2033
- Table 35: Spain IPM Pheromone Products Industry Revenue (Million) Forecast, by Application 2020 & 2033
- Table 36: Russia IPM Pheromone Products Industry Revenue (Million) Forecast, by Application 2020 & 2033
- Table 37: Benelux IPM Pheromone Products Industry Revenue (Million) Forecast, by Application 2020 & 2033
- Table 38: Nordics IPM Pheromone Products Industry Revenue (Million) Forecast, by Application 2020 & 2033
- Table 39: Rest of Europe IPM Pheromone Products Industry Revenue (Million) Forecast, by Application 2020 & 2033
- Table 40: Global IPM Pheromone Products Industry Revenue Million Forecast, by Production Analysis 2020 & 2033
- Table 41: Global IPM Pheromone Products Industry Revenue Million Forecast, by Consumption Analysis 2020 & 2033
- Table 42: Global IPM Pheromone Products Industry Revenue Million Forecast, by Import Market Analysis (Value & Volume) 2020 & 2033
- Table 43: Global IPM Pheromone Products Industry Revenue Million Forecast, by Export Market Analysis (Value & Volume) 2020 & 2033
- Table 44: Global IPM Pheromone Products Industry Revenue Million Forecast, by Price Trend Analysis 2020 & 2033
- Table 45: Global IPM Pheromone Products Industry Revenue Million Forecast, by Country 2020 & 2033
- Table 46: Turkey IPM Pheromone Products Industry Revenue (Million) Forecast, by Application 2020 & 2033
- Table 47: Israel IPM Pheromone Products Industry Revenue (Million) Forecast, by Application 2020 & 2033
- Table 48: GCC IPM Pheromone Products Industry Revenue (Million) Forecast, by Application 2020 & 2033
- Table 49: North Africa IPM Pheromone Products Industry Revenue (Million) Forecast, by Application 2020 & 2033
- Table 50: South Africa IPM Pheromone Products Industry Revenue (Million) Forecast, by Application 2020 & 2033
- Table 51: Rest of Middle East & Africa IPM Pheromone Products Industry Revenue (Million) Forecast, by Application 2020 & 2033
- Table 52: Global IPM Pheromone Products Industry Revenue Million Forecast, by Production Analysis 2020 & 2033
- Table 53: Global IPM Pheromone Products Industry Revenue Million Forecast, by Consumption Analysis 2020 & 2033
- Table 54: Global IPM Pheromone Products Industry Revenue Million Forecast, by Import Market Analysis (Value & Volume) 2020 & 2033
- Table 55: Global IPM Pheromone Products Industry Revenue Million Forecast, by Export Market Analysis (Value & Volume) 2020 & 2033
- Table 56: Global IPM Pheromone Products Industry Revenue Million Forecast, by Price Trend Analysis 2020 & 2033
- Table 57: Global IPM Pheromone Products Industry Revenue Million Forecast, by Country 2020 & 2033
- Table 58: China IPM Pheromone Products Industry Revenue (Million) Forecast, by Application 2020 & 2033
- Table 59: India IPM Pheromone Products Industry Revenue (Million) Forecast, by Application 2020 & 2033
- Table 60: Japan IPM Pheromone Products Industry Revenue (Million) Forecast, by Application 2020 & 2033
- Table 61: South Korea IPM Pheromone Products Industry Revenue (Million) Forecast, by Application 2020 & 2033
- Table 62: ASEAN IPM Pheromone Products Industry Revenue (Million) Forecast, by Application 2020 & 2033
- Table 63: Oceania IPM Pheromone Products Industry Revenue (Million) Forecast, by Application 2020 & 2033
- Table 64: Rest of Asia Pacific IPM Pheromone Products Industry Revenue (Million) Forecast, by Application 2020 & 2033
Frequently Asked Questions
1. What is the projected Compound Annual Growth Rate (CAGR) of the IPM Pheromone Products Industry?
The projected CAGR is approximately 10.50%.
2. Which companies are prominent players in the IPM Pheromone Products Industry?
Key companies in the market include Russell IPM, Suterr, Syngenta Bioline, Pacific Biocontrol Corporation, ISCA Technologies, Shin-Etsu, Hercon Environmental, Sumi Agro France, Isagro, BASF SE.
3. What are the main segments of the IPM Pheromone Products Industry?
The market segments include Production Analysis, Consumption Analysis, Import Market Analysis (Value & Volume), Export Market Analysis (Value & Volume), Price Trend Analysis.
4. Can you provide details about the market size?
The market size is estimated to be USD 1.02 Million as of 2022.
5. What are some drivers contributing to market growth?
Decreasing Per Capita Arable Land; Increased Demand for Food.
6. What are the notable trends driving market growth?
Strong Demand for High-Value Crops.
7. Are there any restraints impacting market growth?
High Initial Investments; Requirement of Precision Agriculture.
8. Can you provide examples of recent developments in the market?
N/A
9. What pricing options are available for accessing the report?
Pricing options include single-user, multi-user, and enterprise licenses priced at USD 3800, USD 4500, and USD 5800 respectively.
10. Is the market size provided in terms of value or volume?
The market size is provided in terms of value, measured in Million.
11. Are there any specific market keywords associated with the report?
Yes, the market keyword associated with the report is "IPM Pheromone Products Industry," which aids in identifying and referencing the specific market segment covered.
12. How do I determine which pricing option suits my needs best?
The pricing options vary based on user requirements and access needs. Individual users may opt for single-user licenses, while businesses requiring broader access may choose multi-user or enterprise licenses for cost-effective access to the report.
13. Are there any additional resources or data provided in the IPM Pheromone Products Industry report?
While the report offers comprehensive insights, it's advisable to review the specific contents or supplementary materials provided to ascertain if additional resources or data are available.
14. How can I stay updated on further developments or reports in the IPM Pheromone Products Industry?
To stay informed about further developments, trends, and reports in the IPM Pheromone Products Industry, consider subscribing to industry newsletters, following relevant companies and organizations, or regularly checking reputable industry news sources and publications.
Methodology
Step 1 - Identification of Relevant Samples Size from Population Database


Step 2 - Approaches for Defining Global Market Size (Value, Volume* & Price*)

Note*: In applicable scenarios
Step 3 - Data Sources
Primary Research
- Web Analytics
- Survey Reports
- Research Institute
- Latest Research Reports
- Opinion Leaders
Secondary Research
- Annual Reports
- White Paper
- Latest Press Release
- Industry Association
- Paid Database
- Investor Presentations

Step 4 - Data Triangulation
Involves using different sources of information in order to increase the validity of a study
These sources are likely to be stakeholders in a program - participants, other researchers, program staff, other community members, and so on.
Then we put all data in single framework & apply various statistical tools to find out the dynamic on the market.
During the analysis stage, feedback from the stakeholder groups would be compared to determine areas of agreement as well as areas of divergence