

Key Insights
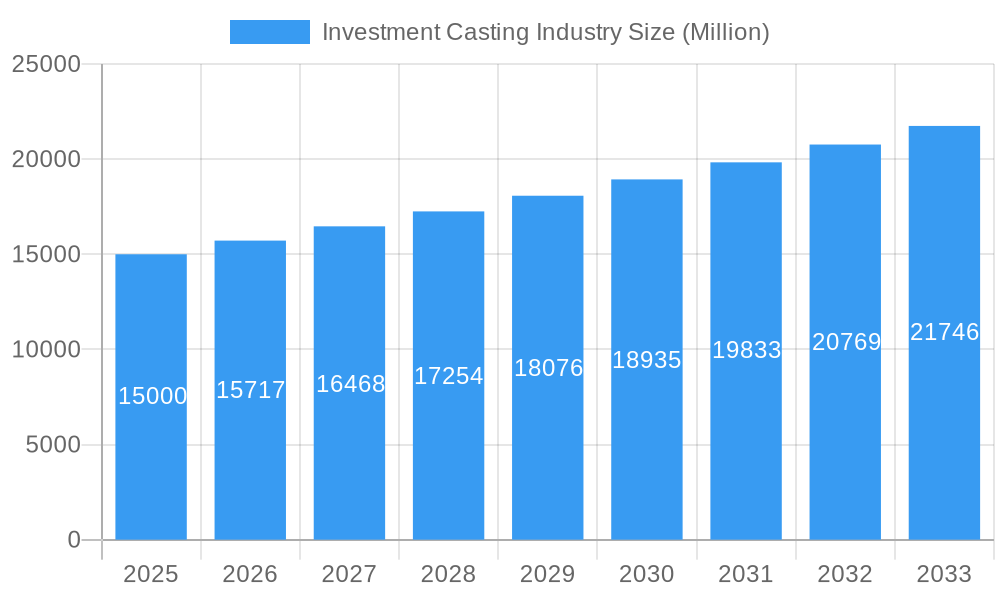
The investment casting market, valued at approximately $XX million in 2025, is projected to experience steady growth, with a compound annual growth rate (CAGR) of 4.58% from 2025 to 2033. This expansion is fueled by increasing demand across diverse end-use sectors, notably automotive, aerospace, and medical. The automotive industry's push for lightweight, high-strength components, coupled with the growing adoption of precision casting in aerospace applications requiring intricate designs and high durability, are key drivers. Furthermore, the medical device industry's reliance on precise and biocompatible materials is significantly contributing to market growth. The preference for the Sodium Silicate Process and Tetraethyl Orthosilicate/Silica Sol Process reflects ongoing improvements in casting precision and material properties. While challenges such as fluctuating raw material prices and stringent environmental regulations pose restraints, technological advancements in automation and improved casting techniques are mitigating these concerns. Geographic expansion, particularly in the Asia-Pacific region driven by robust industrial growth in countries like China and India, is also expected to fuel market expansion. Competition among established players like Zollern GmbH, Signicast, and Precision Castparts Corp., alongside emerging regional players, creates a dynamic and innovative landscape.
Investment Casting Industry Market Size (In Billion)
The forecast period (2025-2033) anticipates significant growth opportunities within specific segments. The aerospace and military segment is expected to experience substantial growth due to increased defense spending and the demand for lightweight yet robust components in aircraft and defense systems. Similarly, the medical segment will likely see significant growth due to technological advances in medical devices requiring high precision. The general industrial machinery segment will also show robust growth fueled by increasing automation and the demand for durable and precision-engineered components. North America and Europe currently hold significant market shares, but the Asia-Pacific region is poised for rapid expansion, driven by substantial investments in infrastructure development and manufacturing capacity. This regional shift will present both opportunities and challenges for existing and emerging players alike, requiring strategic adaptations to cater to the evolving market dynamics in this rapidly growing industry.
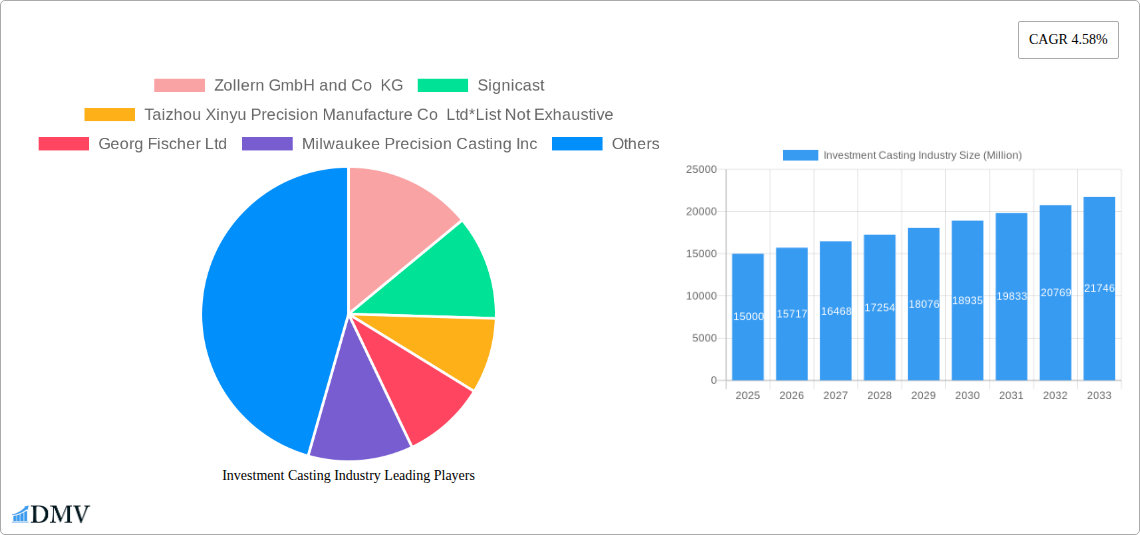
Investment Casting Industry Company Market Share
Investment Casting Industry Market Report: 2019-2033
This comprehensive report provides a detailed analysis of the global Investment Casting Industry, offering invaluable insights for stakeholders seeking to navigate this dynamic market. With a study period spanning 2019-2033, a base year of 2025, and a forecast period of 2025-2033, this report unveils the market's current state, future trajectory, and key players shaping its evolution. The market is expected to reach a value of $XX Million by 2033.
Investment Casting Industry Market Composition & Trends
This section delves into the intricate composition of the investment casting market, evaluating its concentration, innovation drivers, regulatory landscape, substitute products, end-user profiles, and mergers & acquisitions (M&A) activity. We analyze the market share distribution among key players such as Zollern GmbH and Co KG, Signicast, Taizhou Xinyu Precision Manufacture Co Ltd, Georg Fischer Ltd, Milwaukee Precision Casting Inc, Precision Castparts Corp (Berkshire Hathaway), MetalTek International, Impro Precision Industries Limited, Dongying Giayoung Precision Metal, and Alcoa Corporation. The report quantifies market concentration using the Herfindahl-Hirschman Index (HHI) and identifies leading players' market share percentages. The impact of regulatory changes like stricter environmental regulations on material sourcing and manufacturing processes is also detailed, along with the influence of substitute materials (e.g., 3D-printed components) on market growth. The section further examines the types of M&A activities, including their frequency, deal values (estimated at $XX Million annually in recent years), and the strategic rationale behind these transactions. It also includes profiles of key end-user segments and their impact on market demand.
- Market Concentration: High (HHI of XX) indicating dominance by a few large players.
- Innovation Catalysts: Advancements in materials science, automation, and additive manufacturing.
- Regulatory Landscape: Stringent environmental regulations impacting material choices and manufacturing processes.
- Substitute Products: 3D printing and other additive manufacturing technologies pose a competitive threat.
- End-User Profiles: Automotive, aerospace, and medical sectors are major consumers of investment castings.
- M&A Activity: XX significant M&A deals observed in the past five years, with a total estimated value of $XX Million.
Investment Casting Industry Industry Evolution
This section traces the historical evolution of the investment casting industry (2019-2024), analyzing market growth trajectories, technological advancements, and the shifts in consumer demand. Data points on compound annual growth rates (CAGRs) for different segments and regions are provided, alongside an analysis of the adoption rates of new technologies such as automation and digitalization in manufacturing processes. The impact of macroeconomic factors such as economic recessions and global supply chain disruptions on the industry's performance is also assessed. Furthermore, evolving consumer preferences toward lightweighting, improved performance, and cost-effectiveness are examined in the context of their influence on market demand and the adoption of new materials and processes. The report details how shifts in demand from different end-user sectors are shaping industry growth and product development strategies.
Leading Regions, Countries, or Segments in Investment Casting Industry
This section identifies the leading regions, countries, and segments within the investment casting market, focusing on By Type: Sodium Silicate Process, Tetraethyl Orthosilicate/Silica Sol Process and By End-user Type: Automotive, Aerospace and Military, General Industrial Machinery, Medical, and Other End-user Types. It offers an in-depth analysis of the factors contributing to the dominance of specific regions or segments, including regional investment trends, government policies supporting the industry, and the availability of skilled labor.
- Dominant Region: North America (driven by strong automotive and aerospace sectors).
- Leading Country: United States (due to robust manufacturing infrastructure and high R&D investment).
- Leading Segment (By Type): Sodium Silicate Process (due to cost-effectiveness and established infrastructure).
- Leading Segment (By End-user Type): Automotive (high volume of castings needed in vehicle production).
Key Drivers for Dominant Regions/Segments:
- Investment Trends: Significant investments in automation and advanced manufacturing technologies in North America.
- Regulatory Support: Government incentives and subsidies for the aerospace and defense industries in the US.
- Market Size and Growth: The Automotive sector showcases consistently high growth rates leading to increased demand for investment castings.
Investment Casting Industry Product Innovations
Recent innovations in investment casting encompass the development of high-strength, lightweight alloys, such as titanium aluminides, for aerospace applications. Advancements in casting processes, including the use of 3D printing for mold creation, enable the production of highly complex geometries with improved accuracy and surface finish. These innovations translate to enhanced product performance, reduced weight, and improved efficiency for end-users, creating a significant competitive advantage. Companies are increasingly focusing on developing customized solutions tailored to specific customer needs, reflecting the growing demand for specialized castings in niche markets.
Propelling Factors for Investment Casting Industry Growth
The investment casting industry's growth is fueled by several key factors. Technological advancements, such as improved automation and the adoption of advanced materials, are driving efficiency gains and enabling the production of more complex parts. Economic growth in key end-user sectors like automotive and aerospace is stimulating demand for investment castings. Furthermore, favorable government regulations in various regions, including tax incentives and environmental regulations prompting the use of sustainable materials, create an enabling environment for industry expansion.
Obstacles in the Investment Casting Industry Market
The investment casting industry faces various challenges. Stricter environmental regulations can increase production costs and necessitate the adoption of more expensive, eco-friendly materials. Supply chain disruptions, particularly in the sourcing of raw materials and specialized equipment, can lead to production delays and higher costs. Intense competition from other manufacturing processes, such as 3D printing and forging, puts pressure on prices and profit margins. These factors can collectively restrain market growth.
Future Opportunities in Investment Casting Industry
Emerging opportunities include the expansion into new markets, such as renewable energy and medical devices, where high-precision castings are essential. Advancements in materials science and manufacturing processes will enable the creation of even more complex and high-performance castings. The adoption of Industry 4.0 technologies, such as advanced analytics and AI, will improve efficiency, reduce costs, and enhance the overall customer experience. These factors promise future market expansion.
Major Players in the Investment Casting Industry Ecosystem
- Zollern GmbH and Co KG
- Signicast
- Taizhou Xinyu Precision Manufacture Co Ltd
- Georg Fischer Ltd
- Milwaukee Precision Casting Inc
- Precision Castparts Corp (Berkshire Hathaway)
- MetalTek International
- Impro Precision Industries Limited
- Dongying Giayoung Precision Metal
- Alcoa Corporation
Key Developments in Investment Casting Industry Industry
- 2022 Q4: Signicast announced a significant investment in new automation technology.
- 2023 Q1: Alcoa Corporation introduced a new lightweight alloy specifically for automotive applications.
- 2023 Q2: Zollern GmbH and Co KG partnered with a leading 3D printing company to develop advanced casting solutions. (Further details on specific developments will be included in the full report.)
Strategic Investment Casting Industry Market Forecast
The investment casting market is poised for robust growth driven by technological advancements, increasing demand from key end-user sectors, and favorable regulatory environments. Continued innovation in materials science and manufacturing processes will lead to higher-performance and more cost-effective castings. Expansion into emerging markets and adoption of Industry 4.0 technologies will further contribute to the market's expansion in the coming years, promising substantial market potential.
Investment Casting Industry Segmentation
-
1. Type
- 1.1. Sodium Silicate Process
- 1.2. Tetraethyl Orthosilicate/Silica Sol Process
-
2. End-user Type
- 2.1. Automotive
- 2.2. Aerospace and Military
- 2.3. General Industrial Machinery
- 2.4. Medical
- 2.5. Other End-user Types
Investment Casting Industry Segmentation By Geography
-
1. North America
- 1.1. United States
- 1.2. Canada
- 1.3. Rest of North America
-
2. Europe
- 2.1. Germany
- 2.2. United Kingdom
- 2.3. France
- 2.4. Spain
- 2.5. Rest of Europe
-
3. Asia Pacific
- 3.1. India
- 3.2. China
- 3.3. Japan
- 3.4. South Korea
- 3.5. Rest of Asia Pacific
-
4. Rest of the World
- 4.1. Brazil
- 4.2. Argentina
- 4.3. Mexico
- 4.4. United Arab Emirates
- 4.5. Other Countries
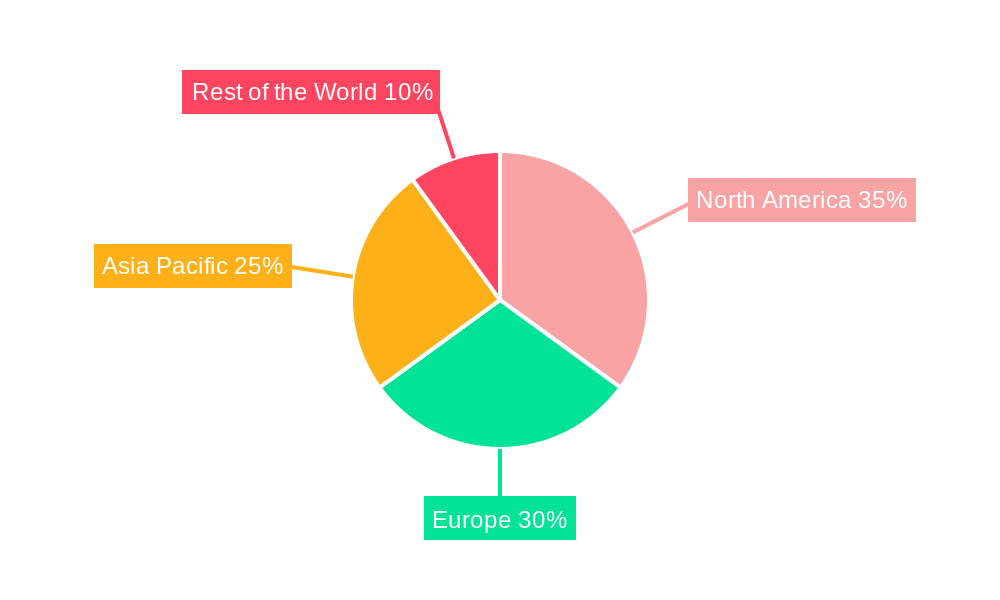
Investment Casting Industry Regional Market Share
Geographic Coverage of Investment Casting Industry
Investment Casting Industry REPORT HIGHLIGHTS
| Aspects | Details |
|---|---|
| Study Period | 2020-2034 |
| Base Year | 2025 |
| Estimated Year | 2026 |
| Forecast Period | 2026-2034 |
| Historical Period | 2020-2025 |
| Growth Rate | CAGR of 4.58% from 2020-2034 |
| Segmentation |
|
Table of Contents
- 1. Introduction
- 1.1. Research Scope
- 1.2. Market Segmentation
- 1.3. Research Objective
- 1.4. Definitions and Assumptions
- 2. Executive Summary
- 2.1. Market Snapshot
- 3. Market Dynamics
- 3.1. Market Drivers
- 3.2. Market Restrains
- 3.3. Market Trends
- 3.4. Market Opportunities
- 4. Market Factor Analysis
- 4.1. Porters Five Forces
- 4.1.1. Bargaining Power of Suppliers
- 4.1.2. Bargaining Power of Buyers
- 4.1.3. Threat of New Entrants
- 4.1.4. Threat of Substitutes
- 4.1.5. Competitive Rivalry
- 4.2. PESTEL analysis
- 4.3. BCG Analysis
- 4.3.1. Stars (High Growth, High Market Share)
- 4.3.2. Cash Cows (Low Growth, High Market Share)
- 4.3.3. Question Mark (High Growth, Low Market Share)
- 4.3.4. Dogs (Low Growth, Low Market Share)
- 4.4. Ansoff Matrix Analysis
- 4.5. Supply Chain Analysis
- 4.6. Regulatory Landscape
- 4.7. Current Market Potential and Opportunity Assessment (TAM–SAM–SOM Framework)
- 4.8. DMV Analyst Note
- 4.1. Porters Five Forces
- 5. Market Analysis, Insights and Forecast 2021-2033
- 5.1. Market Analysis, Insights and Forecast - by Type
- 5.1.1. Sodium Silicate Process
- 5.1.2. Tetraethyl Orthosilicate/Silica Sol Process
- 5.2. Market Analysis, Insights and Forecast - by End-user Type
- 5.2.1. Automotive
- 5.2.2. Aerospace and Military
- 5.2.3. General Industrial Machinery
- 5.2.4. Medical
- 5.2.5. Other End-user Types
- 5.3. Market Analysis, Insights and Forecast - by Region
- 5.3.1. North America
- 5.3.2. Europe
- 5.3.3. Asia Pacific
- 5.3.4. Rest of the World
- 5.1. Market Analysis, Insights and Forecast - by Type
- 6. Global Investment Casting Industry Analysis, Insights and Forecast, 2021-2033
- 6.1. Market Analysis, Insights and Forecast - by Type
- 6.1.1. Sodium Silicate Process
- 6.1.2. Tetraethyl Orthosilicate/Silica Sol Process
- 6.2. Market Analysis, Insights and Forecast - by End-user Type
- 6.2.1. Automotive
- 6.2.2. Aerospace and Military
- 6.2.3. General Industrial Machinery
- 6.2.4. Medical
- 6.2.5. Other End-user Types
- 6.1. Market Analysis, Insights and Forecast - by Type
- 7. North America Investment Casting Industry Analysis, Insights and Forecast, 2020-2032
- 7.1. Market Analysis, Insights and Forecast - by Type
- 7.1.1. Sodium Silicate Process
- 7.1.2. Tetraethyl Orthosilicate/Silica Sol Process
- 7.2. Market Analysis, Insights and Forecast - by End-user Type
- 7.2.1. Automotive
- 7.2.2. Aerospace and Military
- 7.2.3. General Industrial Machinery
- 7.2.4. Medical
- 7.2.5. Other End-user Types
- 7.1. Market Analysis, Insights and Forecast - by Type
- 8. Europe Investment Casting Industry Analysis, Insights and Forecast, 2020-2032
- 8.1. Market Analysis, Insights and Forecast - by Type
- 8.1.1. Sodium Silicate Process
- 8.1.2. Tetraethyl Orthosilicate/Silica Sol Process
- 8.2. Market Analysis, Insights and Forecast - by End-user Type
- 8.2.1. Automotive
- 8.2.2. Aerospace and Military
- 8.2.3. General Industrial Machinery
- 8.2.4. Medical
- 8.2.5. Other End-user Types
- 8.1. Market Analysis, Insights and Forecast - by Type
- 9. Asia Pacific Investment Casting Industry Analysis, Insights and Forecast, 2020-2032
- 9.1. Market Analysis, Insights and Forecast - by Type
- 9.1.1. Sodium Silicate Process
- 9.1.2. Tetraethyl Orthosilicate/Silica Sol Process
- 9.2. Market Analysis, Insights and Forecast - by End-user Type
- 9.2.1. Automotive
- 9.2.2. Aerospace and Military
- 9.2.3. General Industrial Machinery
- 9.2.4. Medical
- 9.2.5. Other End-user Types
- 9.1. Market Analysis, Insights and Forecast - by Type
- 10. Rest of the World Investment Casting Industry Analysis, Insights and Forecast, 2020-2032
- 10.1. Market Analysis, Insights and Forecast - by Type
- 10.1.1. Sodium Silicate Process
- 10.1.2. Tetraethyl Orthosilicate/Silica Sol Process
- 10.2. Market Analysis, Insights and Forecast - by End-user Type
- 10.2.1. Automotive
- 10.2.2. Aerospace and Military
- 10.2.3. General Industrial Machinery
- 10.2.4. Medical
- 10.2.5. Other End-user Types
- 10.1. Market Analysis, Insights and Forecast - by Type
- 11. Competitive Analysis
- 11.1. Company Profiles
- 11.1.1 Zollern GmbH and Co KG
- 11.1.1.1. Company Overview
- 11.1.1.2. Products
- 11.1.1.3. Company Financials
- 11.1.1.4. SWOT Analysis
- 11.1.2 Signicast
- 11.1.2.1. Company Overview
- 11.1.2.2. Products
- 11.1.2.3. Company Financials
- 11.1.2.4. SWOT Analysis
- 11.1.3 Taizhou Xinyu Precision Manufacture Co Ltd*List Not Exhaustive
- 11.1.3.1. Company Overview
- 11.1.3.2. Products
- 11.1.3.3. Company Financials
- 11.1.3.4. SWOT Analysis
- 11.1.4 Georg Fischer Ltd
- 11.1.4.1. Company Overview
- 11.1.4.2. Products
- 11.1.4.3. Company Financials
- 11.1.4.4. SWOT Analysis
- 11.1.5 Milwaukee Precision Casting Inc
- 11.1.5.1. Company Overview
- 11.1.5.2. Products
- 11.1.5.3. Company Financials
- 11.1.5.4. SWOT Analysis
- 11.1.6 Precision Castparts Corp (Berkshire Hathaway)
- 11.1.6.1. Company Overview
- 11.1.6.2. Products
- 11.1.6.3. Company Financials
- 11.1.6.4. SWOT Analysis
- 11.1.7 MetalTek International
- 11.1.7.1. Company Overview
- 11.1.7.2. Products
- 11.1.7.3. Company Financials
- 11.1.7.4. SWOT Analysis
- 11.1.8 Impro Precision Industries Limited
- 11.1.8.1. Company Overview
- 11.1.8.2. Products
- 11.1.8.3. Company Financials
- 11.1.8.4. SWOT Analysis
- 11.1.9 Dongying Giayoung Precision Metal
- 11.1.9.1. Company Overview
- 11.1.9.2. Products
- 11.1.9.3. Company Financials
- 11.1.9.4. SWOT Analysis
- 11.1.10 Alcoa Corporation
- 11.1.10.1. Company Overview
- 11.1.10.2. Products
- 11.1.10.3. Company Financials
- 11.1.10.4. SWOT Analysis
- 11.1.1 Zollern GmbH and Co KG
- 11.2. Market Entropy
- 11.2.1 Company's Key Areas Served
- 11.2.2 Recent Developments
- 11.3. Company Market Share Analysis 2025
- 11.3.1 Top 5 Companies Market Share Analysis
- 11.3.2 Top 3 Companies Market Share Analysis
- 11.4. List of Potential Customers
- 12. Research Methodology
List of Figures
- Figure 1: Global Investment Casting Industry Revenue Breakdown (Million, %) by Region 2025 & 2033
- Figure 2: North America Investment Casting Industry Revenue (Million), by Type 2025 & 2033
- Figure 3: North America Investment Casting Industry Revenue Share (%), by Type 2025 & 2033
- Figure 4: North America Investment Casting Industry Revenue (Million), by End-user Type 2025 & 2033
- Figure 5: North America Investment Casting Industry Revenue Share (%), by End-user Type 2025 & 2033
- Figure 6: North America Investment Casting Industry Revenue (Million), by Country 2025 & 2033
- Figure 7: North America Investment Casting Industry Revenue Share (%), by Country 2025 & 2033
- Figure 8: Europe Investment Casting Industry Revenue (Million), by Type 2025 & 2033
- Figure 9: Europe Investment Casting Industry Revenue Share (%), by Type 2025 & 2033
- Figure 10: Europe Investment Casting Industry Revenue (Million), by End-user Type 2025 & 2033
- Figure 11: Europe Investment Casting Industry Revenue Share (%), by End-user Type 2025 & 2033
- Figure 12: Europe Investment Casting Industry Revenue (Million), by Country 2025 & 2033
- Figure 13: Europe Investment Casting Industry Revenue Share (%), by Country 2025 & 2033
- Figure 14: Asia Pacific Investment Casting Industry Revenue (Million), by Type 2025 & 2033
- Figure 15: Asia Pacific Investment Casting Industry Revenue Share (%), by Type 2025 & 2033
- Figure 16: Asia Pacific Investment Casting Industry Revenue (Million), by End-user Type 2025 & 2033
- Figure 17: Asia Pacific Investment Casting Industry Revenue Share (%), by End-user Type 2025 & 2033
- Figure 18: Asia Pacific Investment Casting Industry Revenue (Million), by Country 2025 & 2033
- Figure 19: Asia Pacific Investment Casting Industry Revenue Share (%), by Country 2025 & 2033
- Figure 20: Rest of the World Investment Casting Industry Revenue (Million), by Type 2025 & 2033
- Figure 21: Rest of the World Investment Casting Industry Revenue Share (%), by Type 2025 & 2033
- Figure 22: Rest of the World Investment Casting Industry Revenue (Million), by End-user Type 2025 & 2033
- Figure 23: Rest of the World Investment Casting Industry Revenue Share (%), by End-user Type 2025 & 2033
- Figure 24: Rest of the World Investment Casting Industry Revenue (Million), by Country 2025 & 2033
- Figure 25: Rest of the World Investment Casting Industry Revenue Share (%), by Country 2025 & 2033
List of Tables
- Table 1: Global Investment Casting Industry Revenue Million Forecast, by Type 2020 & 2033
- Table 2: Global Investment Casting Industry Revenue Million Forecast, by End-user Type 2020 & 2033
- Table 3: Global Investment Casting Industry Revenue Million Forecast, by Region 2020 & 2033
- Table 4: Global Investment Casting Industry Revenue Million Forecast, by Type 2020 & 2033
- Table 5: Global Investment Casting Industry Revenue Million Forecast, by End-user Type 2020 & 2033
- Table 6: Global Investment Casting Industry Revenue Million Forecast, by Country 2020 & 2033
- Table 7: United States Investment Casting Industry Revenue (Million) Forecast, by Application 2020 & 2033
- Table 8: Canada Investment Casting Industry Revenue (Million) Forecast, by Application 2020 & 2033
- Table 9: Rest of North America Investment Casting Industry Revenue (Million) Forecast, by Application 2020 & 2033
- Table 10: Global Investment Casting Industry Revenue Million Forecast, by Type 2020 & 2033
- Table 11: Global Investment Casting Industry Revenue Million Forecast, by End-user Type 2020 & 2033
- Table 12: Global Investment Casting Industry Revenue Million Forecast, by Country 2020 & 2033
- Table 13: Germany Investment Casting Industry Revenue (Million) Forecast, by Application 2020 & 2033
- Table 14: United Kingdom Investment Casting Industry Revenue (Million) Forecast, by Application 2020 & 2033
- Table 15: France Investment Casting Industry Revenue (Million) Forecast, by Application 2020 & 2033
- Table 16: Spain Investment Casting Industry Revenue (Million) Forecast, by Application 2020 & 2033
- Table 17: Rest of Europe Investment Casting Industry Revenue (Million) Forecast, by Application 2020 & 2033
- Table 18: Global Investment Casting Industry Revenue Million Forecast, by Type 2020 & 2033
- Table 19: Global Investment Casting Industry Revenue Million Forecast, by End-user Type 2020 & 2033
- Table 20: Global Investment Casting Industry Revenue Million Forecast, by Country 2020 & 2033
- Table 21: India Investment Casting Industry Revenue (Million) Forecast, by Application 2020 & 2033
- Table 22: China Investment Casting Industry Revenue (Million) Forecast, by Application 2020 & 2033
- Table 23: Japan Investment Casting Industry Revenue (Million) Forecast, by Application 2020 & 2033
- Table 24: South Korea Investment Casting Industry Revenue (Million) Forecast, by Application 2020 & 2033
- Table 25: Rest of Asia Pacific Investment Casting Industry Revenue (Million) Forecast, by Application 2020 & 2033
- Table 26: Global Investment Casting Industry Revenue Million Forecast, by Type 2020 & 2033
- Table 27: Global Investment Casting Industry Revenue Million Forecast, by End-user Type 2020 & 2033
- Table 28: Global Investment Casting Industry Revenue Million Forecast, by Country 2020 & 2033
- Table 29: Brazil Investment Casting Industry Revenue (Million) Forecast, by Application 2020 & 2033
- Table 30: Argentina Investment Casting Industry Revenue (Million) Forecast, by Application 2020 & 2033
- Table 31: Mexico Investment Casting Industry Revenue (Million) Forecast, by Application 2020 & 2033
- Table 32: United Arab Emirates Investment Casting Industry Revenue (Million) Forecast, by Application 2020 & 2033
- Table 33: Other Countries Investment Casting Industry Revenue (Million) Forecast, by Application 2020 & 2033
Frequently Asked Questions
1. What is the projected Compound Annual Growth Rate (CAGR) of the Investment Casting Industry?
The projected CAGR is approximately 4.58%.
2. Which companies are prominent players in the Investment Casting Industry?
Key companies in the market include Zollern GmbH and Co KG, Signicast, Taizhou Xinyu Precision Manufacture Co Ltd*List Not Exhaustive, Georg Fischer Ltd, Milwaukee Precision Casting Inc, Precision Castparts Corp (Berkshire Hathaway), MetalTek International, Impro Precision Industries Limited, Dongying Giayoung Precision Metal, Alcoa Corporation.
3. What are the main segments of the Investment Casting Industry?
The market segments include Type, End-user Type.
4. Can you provide details about the market size?
The market size is estimated to be USD XX Million as of 2022.
5. What are some drivers contributing to market growth?
Investments in Refueling Infrastructure Is Driving the Market Growth.
6. What are the notable trends driving market growth?
Sodium Silicate Process To Exhibit The Highest Growth Rate.
7. Are there any restraints impacting market growth?
Inadequate Regulatory Frameworks is Anticipated to Restrain the Market Growth.
8. Can you provide examples of recent developments in the market?
N/A
9. What pricing options are available for accessing the report?
Pricing options include single-user, multi-user, and enterprise licenses priced at USD 4750, USD 5250, and USD 8750 respectively.
10. Is the market size provided in terms of value or volume?
The market size is provided in terms of value, measured in Million.
11. Are there any specific market keywords associated with the report?
Yes, the market keyword associated with the report is "Investment Casting Industry," which aids in identifying and referencing the specific market segment covered.
12. How do I determine which pricing option suits my needs best?
The pricing options vary based on user requirements and access needs. Individual users may opt for single-user licenses, while businesses requiring broader access may choose multi-user or enterprise licenses for cost-effective access to the report.
13. Are there any additional resources or data provided in the Investment Casting Industry report?
While the report offers comprehensive insights, it's advisable to review the specific contents or supplementary materials provided to ascertain if additional resources or data are available.
14. How can I stay updated on further developments or reports in the Investment Casting Industry?
To stay informed about further developments, trends, and reports in the Investment Casting Industry, consider subscribing to industry newsletters, following relevant companies and organizations, or regularly checking reputable industry news sources and publications.
Methodology
Step 1 - Identification of Relevant Samples Size from Population Database


Step 2 - Approaches for Defining Global Market Size (Value, Volume* & Price*)

Note*: In applicable scenarios
Step 3 - Data Sources
Primary Research
- Web Analytics
- Survey Reports
- Research Institute
- Latest Research Reports
- Opinion Leaders
Secondary Research
- Annual Reports
- White Paper
- Latest Press Release
- Industry Association
- Paid Database
- Investor Presentations

Step 4 - Data Triangulation
Involves using different sources of information in order to increase the validity of a study
These sources are likely to be stakeholders in a program - participants, other researchers, program staff, other community members, and so on.
Then we put all data in single framework & apply various statistical tools to find out the dynamic on the market.
During the analysis stage, feedback from the stakeholder groups would be compared to determine areas of agreement as well as areas of divergence