

Key Insights
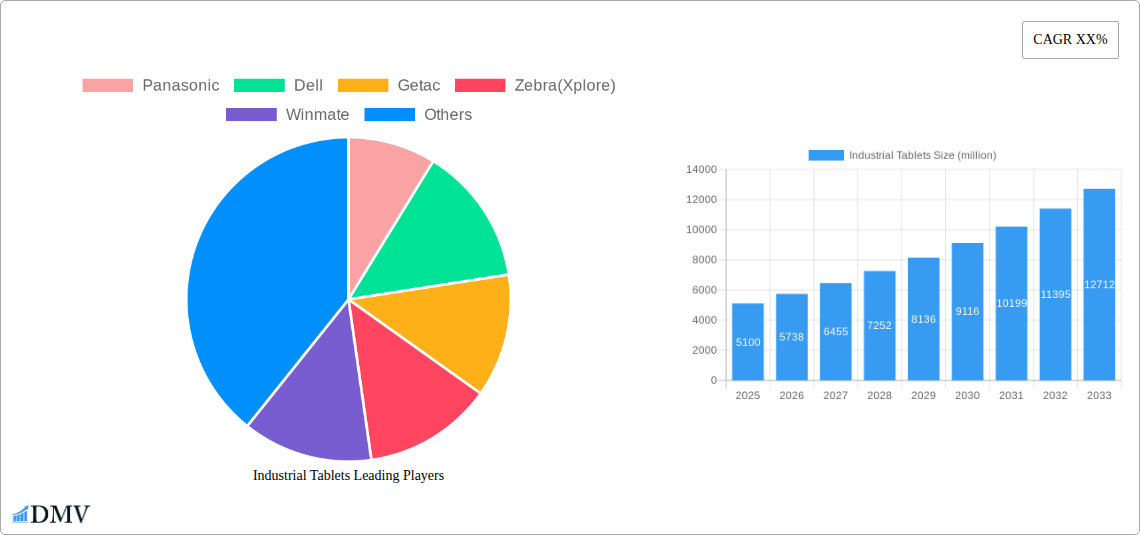
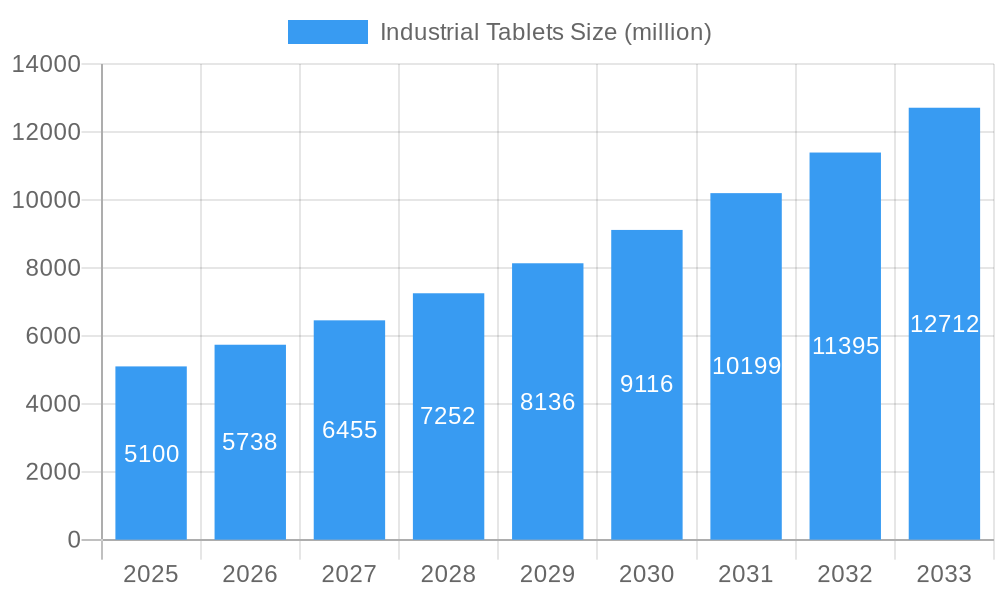
The global industrial tablet market is poised for substantial growth, projected to reach an estimated market size of $5,100 million by 2025. This expansion is driven by the increasing adoption of ruggedized devices across diverse sectors, including manufacturing, energy, and construction, where durability and reliability are paramount. The market is expected to witness a Compound Annual Growth Rate (CAGR) of 12.5% from 2025 to 2033, underscoring a robust and sustained upward trajectory. Key drivers for this growth include the rising demand for real-time data processing and analytics in operational environments, the implementation of Industry 4.0 initiatives, and the necessity for mobile solutions that can withstand harsh conditions such as extreme temperatures, dust, and water. The proliferation of IoT devices further fuels the need for rugged tablets capable of seamless integration and efficient data collection in field operations, logistics, and remote monitoring.
Industrial Tablets Market Size (In Billion)
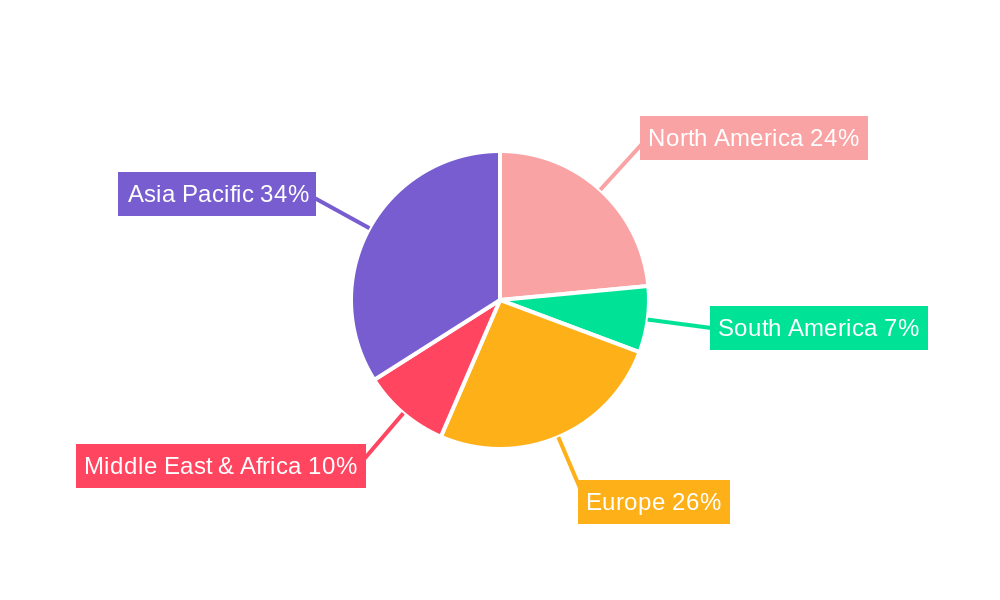
The industrial tablet market is segmented into different types of ruggedness, with ultra-rugged tablets leading the pack due to their superior resilience in the most demanding environments. Fully rugged tablets and semi-rugged tablets also hold significant market share, catering to applications with moderate to high durability requirements. Geographically, Asia Pacific is emerging as a dominant region, propelled by rapid industrialization, significant manufacturing output, and substantial investments in smart city projects and infrastructure development in countries like China and India. North America and Europe remain mature markets, characterized by a strong emphasis on technological advancements and upgrades in existing industrial infrastructure. Restraints include the initial high cost of rugged devices compared to consumer-grade tablets and the need for specialized training for end-users, although these are increasingly offset by the long-term return on investment due to reduced repair and replacement costs and enhanced productivity.
Industrial Tablets Company Market Share
Industrial Tablets Market: Comprehensive Analysis & Future Outlook (2019-2033)
This in-depth report provides a crucial analysis of the global Industrial Tablets Market, offering strategic insights for stakeholders navigating this dynamic sector. Spanning the Historical Period (2019-2024) and projecting through the Forecast Period (2025-2033) with a Base Year of 2025 and Estimated Year of 2025, this report details market composition, industry evolution, regional dominance, product innovations, growth drivers, obstacles, opportunities, major players, key developments, and a strategic market forecast. We delve into the application segments of Energy, Manufacturing, Construction, and Others, and examine the types including Fully Rugged Tablets, Semi Rugged Tablets, and Ultra-rugged Tablets.
Industrial Tablets Market Composition & Trends
The global Industrial Tablets Market exhibits a moderate concentration, with key players like Panasonic, Dell, Getac, and Zebra (Xplore) holding significant market share, estimated to be around $30,000 million in 2024. Innovation remains a primary catalyst, driven by advancements in processing power, battery life, and display technology, crucial for harsh operational environments. Regulatory landscapes, particularly in sectors like energy and manufacturing, are increasingly mandating the adoption of robust digital solutions, further stimulating market growth. Substitute products, while present in the form of consumer-grade tablets adapted for industrial use, generally fall short of the durability and specialized features offered by dedicated industrial tablets, representing less than $5,000 million in market impact. End-user profiles are diverse, ranging from field technicians in construction to assembly line workers in manufacturing and remote inspectors in the energy sector, each with specific requirements for mobility, connectivity, and ruggedness. Mergers and Acquisitions (M&A) activities have been strategic, with estimated deal values reaching $1,500 million between 2019 and 2024, aimed at consolidating market position, expanding product portfolios, and enhancing technological capabilities.
Industrial Tablets Industry Evolution
The Industrial Tablets Market has witnessed a consistent upward trajectory, driven by the pervasive digital transformation across core industries. From 2019 to 2024, the market experienced a Compound Annual Growth Rate (CAGR) of approximately 8.5%, reaching an estimated market size of $30,000 million by the end of 2024. This growth is intrinsically linked to technological advancements, such as the integration of advanced processors for complex data analysis in real-time, improved battery management systems offering extended operational hours, and the adoption of brighter, high-resolution displays for enhanced readability in challenging lighting conditions. The increasing demand for mobility and real-time data access on the factory floor, in remote energy sites, and at construction project locations has been a significant consumer-driven factor. For instance, the adoption of Fully Rugged Tablets has surged by an estimated 10% annually as industries prioritize devices that can withstand extreme temperatures, dust, water, and accidental drops, minimizing downtime.
Shifting consumer demands have also played a pivotal role. Industries are no longer satisfied with generic computing solutions; they require specialized devices tailored to their unique operational environments. This has led to a greater emphasis on customization, including the integration of specific sensors, barcode scanners, and RFID readers. The rise of the Internet of Things (IoT) further amplifies this evolution, as industrial tablets act as crucial interfaces for collecting and transmitting data from connected devices and machinery. The demand for enhanced cybersecurity features in these devices has also grown considerably, ensuring the integrity of sensitive operational data. Consequently, the market is witnessing a gradual shift towards more sophisticated and feature-rich industrial tablets, with adoption rates for devices supporting 5G connectivity projected to grow by over 15% annually in the coming years.
Leading Regions, Countries, or Segments in Industrial Tablets
The Industrial Tablets Market is spearheaded by the Manufacturing application segment, estimated to account for approximately 35% of the global market share in 2024, followed closely by the Energy sector at 30%. This dominance is fueled by the continuous drive for Industry 4.0 adoption, automation, and the need for robust data acquisition and control systems on production lines and in power generation facilities. The Construction segment also represents a significant portion, contributing around 20%, driven by the increasing reliance on digital blueprints, project management tools, and on-site data collection for enhanced efficiency and safety. The "Others" segment, encompassing logistics, transportation, and public safety, rounds out the remaining market share.
Within the product types, Fully Rugged Tablets continue to lead the market, commanding an estimated 60% market share in 2024. Their unparalleled durability, water and dust resistance (IP ratings up to IP68), and ability to withstand extreme temperature fluctuations make them indispensable for environments where accidental drops, spills, and harsh weather are common. Semi Rugged Tablets hold a considerable share of approximately 25%, offering a balance of durability and cost-effectiveness for less demanding industrial settings. Ultra-rugged Tablets, designed for the most extreme conditions, represent the remaining 15%, catering to specialized applications in mining, oil and gas exploration, and military operations.
Dominant Application Segment (Manufacturing):
- Key Drivers: Industry 4.0 initiatives, smart factory implementations, automation adoption, real-time production monitoring, quality control systems.
- In-depth Analysis: The manufacturing sector's relentless pursuit of operational efficiency and reduced downtime necessitates mobile computing solutions that can withstand the rigors of a factory floor. The integration of industrial tablets with SCADA systems and manufacturing execution systems (MES) allows for seamless data flow, enabling predictive maintenance, optimized resource allocation, and enhanced worker productivity. Investment trends in automation and digital transformation within manufacturing consistently exceed $50,000 million annually, directly impacting the demand for rugged devices.
Dominant Product Type (Fully Rugged Tablets):
- Key Drivers: Enhanced durability, high IP ratings, MIL-STD-810G/H certifications, extended battery life, glove-touch capabilities, sunlight-readable displays.
- In-depth Analysis: The inherent risks and challenging conditions prevalent in industrial settings make the resilience of fully rugged tablets a non-negotiable requirement. Regulatory support for worker safety and operational continuity further solidifies their position. For instance, in the construction sector, the use of fully rugged tablets for site surveying and inspection ensures data integrity even in dusty and wet conditions, preventing costly rework.
Industrial Tablets Product Innovations
Product innovation in the Industrial Tablets Market is relentlessly focused on enhancing user experience and operational efficiency in demanding environments. Key advancements include the integration of next-generation processors for faster data processing, extended battery life exceeding 20 hours on a single charge, and ultra-bright displays (over 1,000 nits) for superior outdoor visibility. The incorporation of advanced connectivity options, such as 5G and Wi-Fi 6E, ensures seamless data transfer for real-time collaboration and cloud access. Unique selling propositions include specialized features like hot-swappable batteries, integrated barcode scanners, RFID readers, and robust docking solutions for vehicle and desktop integration. Performance metrics like shock resistance up to 6 feet and water/dust ingress protection (IP65/IP67) are standard benchmarks, with some Ultra-rugged Tablets achieving MIL-STD-810H certification for extreme environmental tolerance.
Propelling Factors for Industrial Tablets Growth
The Industrial Tablets Market is experiencing robust growth fueled by several key factors. The accelerating pace of digital transformation across industries like manufacturing, energy, and construction is a primary driver, as businesses seek to enhance productivity, efficiency, and data-driven decision-making. The increasing adoption of Industry 4.0 principles and the Internet of Things (IoT) mandates the need for reliable mobile devices to collect and transmit real-time data from the field. Furthermore, government initiatives promoting industrial modernization and digital infrastructure development, particularly in emerging economies, are creating significant demand. The imperative for enhanced worker safety and operational continuity in hazardous environments directly fuels the demand for rugged and reliable computing solutions. The increasing demand for mobile solutions that can withstand extreme conditions, including dust, water, temperature variations, and drops, continues to drive the adoption of specialized industrial tablets, estimated to represent a market of over $30,000 million in 2024.
Obstacles in the Industrial Tablets Market
Despite the positive growth trajectory, the Industrial Tablets Market faces certain obstacles. High initial investment costs for premium rugged devices can be a deterrent for smaller enterprises, with fully rugged models often costing upwards of $2,000. Supply chain disruptions, particularly for specialized components and semiconductors, can lead to extended lead times and price volatility, impacting availability. Rapid technological obsolescence necessitates frequent upgrades, adding to the total cost of ownership. Furthermore, compatibility challenges with legacy industrial systems and software can hinder seamless integration. The shortage of skilled IT personnel capable of managing and maintaining these specialized devices also presents a challenge for some organizations.
Future Opportunities in Industrial Tablets
The Industrial Tablets Market is poised for significant future opportunities. The expanding adoption of 5G technology will unlock new possibilities for real-time data streaming and remote operations, particularly in the energy and transportation sectors. The growing demand for AI-powered analytics on edge devices will enable more sophisticated on-site decision-making. The continuous expansion of the IoT ecosystem will further integrate industrial tablets into the broader network of connected devices. Emerging markets in Asia-Pacific and Latin America represent untapped potential, with increasing industrialization driving demand. Furthermore, the development of specialized tablets for niche applications such as agriculture, healthcare, and public safety offers significant growth avenues. The market for solutions supporting augmented reality (AR) and virtual reality (VR) for training and maintenance is also projected to expand considerably.
Major Players in the Industrial Tablets Ecosystem
- Panasonic
- Dell
- Getac
- Zebra (Xplore)
- Winmate
- Leonardo DRS
- HP
- AAEON
- NEXCOM
- RuggON
- DT Research
- Xenarc Technologies
- MobileDemand
- Kontron
- MilDef
- Trimble
- Samsung
- JLT Mobile Computers
- Conker
- Bright Alliance Technology
- Estone Technology
- Logic Instrument (ARCHOS)
Key Developments in Industrial Tablets Industry
- 2023 Q4: Panasonic launches its new Toughbook tablet series with enhanced 5G connectivity and improved battery life, targeting manufacturing and logistics.
- 2024 Q1: Getac announces significant investments in R&D for advanced rugged device security features, responding to increasing cybersecurity concerns.
- 2024 Q2: Zebra Technologies acquires a company specializing in mobile workforce solutions, expanding its portfolio in rugged data capture and analytics.
- 2024 Q3: Winmate introduces a new line of industrial tablets with integrated IoT sensors for predictive maintenance applications in the energy sector.
- 2024 Q4: Dell unveils its latest rugged tablet with a focus on enhanced display technology for outdoor construction site use.
Strategic Industrial Tablets Market Forecast
The Industrial Tablets Market is projected for sustained and robust growth through 2033. Key growth catalysts include the escalating demand for digitalization across all industrial sectors, driven by the imperatives of Industry 4.0 and IoT adoption. The continuous evolution of ruggedization technologies, offering greater resilience and functionality, will expand application possibilities. Emerging markets and the increasing need for mobile data solutions in remote and challenging environments present significant expansion opportunities. The forecast anticipates a CAGR of approximately 7.5% from 2025 to 2033, with the market size potentially reaching $55,000 million by the end of the forecast period. The ongoing innovation in connectivity, processing power, and specialized features will continue to drive market penetration and demand for these critical industrial tools.
Industrial Tablets Segmentation
-
1. Application
- 1.1. Energy
- 1.2. Manufacturing
- 1.3. Construction
- 1.4. Others
-
2. Types
- 2.1. Fully Rugged Tablets
- 2.2. Semi Rugged Tablets
- 2.3. Ultra-rugged Tablets
Industrial Tablets Segmentation By Geography
-
1. North America
- 1.1. United States
- 1.2. Canada
- 1.3. Mexico
-
2. South America
- 2.1. Brazil
- 2.2. Argentina
- 2.3. Rest of South America
-
3. Europe
- 3.1. United Kingdom
- 3.2. Germany
- 3.3. France
- 3.4. Italy
- 3.5. Spain
- 3.6. Russia
- 3.7. Benelux
- 3.8. Nordics
- 3.9. Rest of Europe
-
4. Middle East & Africa
- 4.1. Turkey
- 4.2. Israel
- 4.3. GCC
- 4.4. North Africa
- 4.5. South Africa
- 4.6. Rest of Middle East & Africa
-
5. Asia Pacific
- 5.1. China
- 5.2. India
- 5.3. Japan
- 5.4. South Korea
- 5.5. ASEAN
- 5.6. Oceania
- 5.7. Rest of Asia Pacific
Industrial Tablets Regional Market Share
Geographic Coverage of Industrial Tablets
Industrial Tablets REPORT HIGHLIGHTS
| Aspects | Details |
|---|---|
| Study Period | 2020-2034 |
| Base Year | 2025 |
| Estimated Year | 2026 |
| Forecast Period | 2026-2034 |
| Historical Period | 2020-2025 |
| Growth Rate | CAGR of XX% from 2020-2034 |
| Segmentation |
|
Table of Contents
- 1. Introduction
- 1.1. Research Scope
- 1.2. Market Segmentation
- 1.3. Research Objective
- 1.4. Definitions and Assumptions
- 2. Executive Summary
- 2.1. Market Snapshot
- 3. Market Dynamics
- 3.1. Market Drivers
- 3.2. Market Restrains
- 3.3. Market Trends
- 3.4. Market Opportunities
- 4. Market Factor Analysis
- 4.1. Porters Five Forces
- 4.1.1. Bargaining Power of Suppliers
- 4.1.2. Bargaining Power of Buyers
- 4.1.3. Threat of New Entrants
- 4.1.4. Threat of Substitutes
- 4.1.5. Competitive Rivalry
- 4.2. PESTEL analysis
- 4.3. BCG Analysis
- 4.3.1. Stars (High Growth, High Market Share)
- 4.3.2. Cash Cows (Low Growth, High Market Share)
- 4.3.3. Question Mark (High Growth, Low Market Share)
- 4.3.4. Dogs (Low Growth, Low Market Share)
- 4.4. Ansoff Matrix Analysis
- 4.5. Supply Chain Analysis
- 4.6. Regulatory Landscape
- 4.7. Current Market Potential and Opportunity Assessment (TAM–SAM–SOM Framework)
- 4.8. DMV Analyst Note
- 4.1. Porters Five Forces
- 5. Market Analysis, Insights and Forecast 2021-2033
- 5.1. Market Analysis, Insights and Forecast - by Application
- 5.1.1. Energy
- 5.1.2. Manufacturing
- 5.1.3. Construction
- 5.1.4. Others
- 5.2. Market Analysis, Insights and Forecast - by Types
- 5.2.1. Fully Rugged Tablets
- 5.2.2. Semi Rugged Tablets
- 5.2.3. Ultra-rugged Tablets
- 5.3. Market Analysis, Insights and Forecast - by Region
- 5.3.1. North America
- 5.3.2. South America
- 5.3.3. Europe
- 5.3.4. Middle East & Africa
- 5.3.5. Asia Pacific
- 5.1. Market Analysis, Insights and Forecast - by Application
- 6. Global Industrial Tablets Analysis, Insights and Forecast, 2021-2033
- 6.1. Market Analysis, Insights and Forecast - by Application
- 6.1.1. Energy
- 6.1.2. Manufacturing
- 6.1.3. Construction
- 6.1.4. Others
- 6.2. Market Analysis, Insights and Forecast - by Types
- 6.2.1. Fully Rugged Tablets
- 6.2.2. Semi Rugged Tablets
- 6.2.3. Ultra-rugged Tablets
- 6.1. Market Analysis, Insights and Forecast - by Application
- 7. North America Industrial Tablets Analysis, Insights and Forecast, 2020-2032
- 7.1. Market Analysis, Insights and Forecast - by Application
- 7.1.1. Energy
- 7.1.2. Manufacturing
- 7.1.3. Construction
- 7.1.4. Others
- 7.2. Market Analysis, Insights and Forecast - by Types
- 7.2.1. Fully Rugged Tablets
- 7.2.2. Semi Rugged Tablets
- 7.2.3. Ultra-rugged Tablets
- 7.1. Market Analysis, Insights and Forecast - by Application
- 8. South America Industrial Tablets Analysis, Insights and Forecast, 2020-2032
- 8.1. Market Analysis, Insights and Forecast - by Application
- 8.1.1. Energy
- 8.1.2. Manufacturing
- 8.1.3. Construction
- 8.1.4. Others
- 8.2. Market Analysis, Insights and Forecast - by Types
- 8.2.1. Fully Rugged Tablets
- 8.2.2. Semi Rugged Tablets
- 8.2.3. Ultra-rugged Tablets
- 8.1. Market Analysis, Insights and Forecast - by Application
- 9. Europe Industrial Tablets Analysis, Insights and Forecast, 2020-2032
- 9.1. Market Analysis, Insights and Forecast - by Application
- 9.1.1. Energy
- 9.1.2. Manufacturing
- 9.1.3. Construction
- 9.1.4. Others
- 9.2. Market Analysis, Insights and Forecast - by Types
- 9.2.1. Fully Rugged Tablets
- 9.2.2. Semi Rugged Tablets
- 9.2.3. Ultra-rugged Tablets
- 9.1. Market Analysis, Insights and Forecast - by Application
- 10. Middle East & Africa Industrial Tablets Analysis, Insights and Forecast, 2020-2032
- 10.1. Market Analysis, Insights and Forecast - by Application
- 10.1.1. Energy
- 10.1.2. Manufacturing
- 10.1.3. Construction
- 10.1.4. Others
- 10.2. Market Analysis, Insights and Forecast - by Types
- 10.2.1. Fully Rugged Tablets
- 10.2.2. Semi Rugged Tablets
- 10.2.3. Ultra-rugged Tablets
- 10.1. Market Analysis, Insights and Forecast - by Application
- 11. Asia Pacific Industrial Tablets Analysis, Insights and Forecast, 2020-2032
- 11.1. Market Analysis, Insights and Forecast - by Application
- 11.1.1. Energy
- 11.1.2. Manufacturing
- 11.1.3. Construction
- 11.1.4. Others
- 11.2. Market Analysis, Insights and Forecast - by Types
- 11.2.1. Fully Rugged Tablets
- 11.2.2. Semi Rugged Tablets
- 11.2.3. Ultra-rugged Tablets
- 11.1. Market Analysis, Insights and Forecast - by Application
- 12. Competitive Analysis
- 12.1. Company Profiles
- 12.1.1 Panasonic
- 12.1.1.1. Company Overview
- 12.1.1.2. Products
- 12.1.1.3. Company Financials
- 12.1.1.4. SWOT Analysis
- 12.1.2 Dell
- 12.1.2.1. Company Overview
- 12.1.2.2. Products
- 12.1.2.3. Company Financials
- 12.1.2.4. SWOT Analysis
- 12.1.3 Getac
- 12.1.3.1. Company Overview
- 12.1.3.2. Products
- 12.1.3.3. Company Financials
- 12.1.3.4. SWOT Analysis
- 12.1.4 Zebra(Xplore)
- 12.1.4.1. Company Overview
- 12.1.4.2. Products
- 12.1.4.3. Company Financials
- 12.1.4.4. SWOT Analysis
- 12.1.5 Winmate
- 12.1.5.1. Company Overview
- 12.1.5.2. Products
- 12.1.5.3. Company Financials
- 12.1.5.4. SWOT Analysis
- 12.1.6 Leonardo DRS
- 12.1.6.1. Company Overview
- 12.1.6.2. Products
- 12.1.6.3. Company Financials
- 12.1.6.4. SWOT Analysis
- 12.1.7 HP
- 12.1.7.1. Company Overview
- 12.1.7.2. Products
- 12.1.7.3. Company Financials
- 12.1.7.4. SWOT Analysis
- 12.1.8 AAEON
- 12.1.8.1. Company Overview
- 12.1.8.2. Products
- 12.1.8.3. Company Financials
- 12.1.8.4. SWOT Analysis
- 12.1.9 NEXCOM
- 12.1.9.1. Company Overview
- 12.1.9.2. Products
- 12.1.9.3. Company Financials
- 12.1.9.4. SWOT Analysis
- 12.1.10 RuggON
- 12.1.10.1. Company Overview
- 12.1.10.2. Products
- 12.1.10.3. Company Financials
- 12.1.10.4. SWOT Analysis
- 12.1.11 DT Research
- 12.1.11.1. Company Overview
- 12.1.11.2. Products
- 12.1.11.3. Company Financials
- 12.1.11.4. SWOT Analysis
- 12.1.12 Xenarc Technologies
- 12.1.12.1. Company Overview
- 12.1.12.2. Products
- 12.1.12.3. Company Financials
- 12.1.12.4. SWOT Analysis
- 12.1.13 MobileDemand
- 12.1.13.1. Company Overview
- 12.1.13.2. Products
- 12.1.13.3. Company Financials
- 12.1.13.4. SWOT Analysis
- 12.1.14 Kontron
- 12.1.14.1. Company Overview
- 12.1.14.2. Products
- 12.1.14.3. Company Financials
- 12.1.14.4. SWOT Analysis
- 12.1.15 MilDef
- 12.1.15.1. Company Overview
- 12.1.15.2. Products
- 12.1.15.3. Company Financials
- 12.1.15.4. SWOT Analysis
- 12.1.16 Trimble
- 12.1.16.1. Company Overview
- 12.1.16.2. Products
- 12.1.16.3. Company Financials
- 12.1.16.4. SWOT Analysis
- 12.1.17 Samsung
- 12.1.17.1. Company Overview
- 12.1.17.2. Products
- 12.1.17.3. Company Financials
- 12.1.17.4. SWOT Analysis
- 12.1.18 JLT Mobile Computers
- 12.1.18.1. Company Overview
- 12.1.18.2. Products
- 12.1.18.3. Company Financials
- 12.1.18.4. SWOT Analysis
- 12.1.19 Conker
- 12.1.19.1. Company Overview
- 12.1.19.2. Products
- 12.1.19.3. Company Financials
- 12.1.19.4. SWOT Analysis
- 12.1.20 Bright Alliance Technology
- 12.1.20.1. Company Overview
- 12.1.20.2. Products
- 12.1.20.3. Company Financials
- 12.1.20.4. SWOT Analysis
- 12.1.21 Estone Technology
- 12.1.21.1. Company Overview
- 12.1.21.2. Products
- 12.1.21.3. Company Financials
- 12.1.21.4. SWOT Analysis
- 12.1.22 Logic Instrument (ARCHOS)
- 12.1.22.1. Company Overview
- 12.1.22.2. Products
- 12.1.22.3. Company Financials
- 12.1.22.4. SWOT Analysis
- 12.1.1 Panasonic
- 12.2. Market Entropy
- 12.2.1 Company's Key Areas Served
- 12.2.2 Recent Developments
- 12.3. Company Market Share Analysis 2025
- 12.3.1 Top 5 Companies Market Share Analysis
- 12.3.2 Top 3 Companies Market Share Analysis
- 12.4. List of Potential Customers
- 13. Research Methodology
List of Figures
- Figure 1: Global Industrial Tablets Revenue Breakdown (million, %) by Region 2025 & 2033
- Figure 2: Global Industrial Tablets Volume Breakdown (K, %) by Region 2025 & 2033
- Figure 3: North America Industrial Tablets Revenue (million), by Application 2025 & 2033
- Figure 4: North America Industrial Tablets Volume (K), by Application 2025 & 2033
- Figure 5: North America Industrial Tablets Revenue Share (%), by Application 2025 & 2033
- Figure 6: North America Industrial Tablets Volume Share (%), by Application 2025 & 2033
- Figure 7: North America Industrial Tablets Revenue (million), by Types 2025 & 2033
- Figure 8: North America Industrial Tablets Volume (K), by Types 2025 & 2033
- Figure 9: North America Industrial Tablets Revenue Share (%), by Types 2025 & 2033
- Figure 10: North America Industrial Tablets Volume Share (%), by Types 2025 & 2033
- Figure 11: North America Industrial Tablets Revenue (million), by Country 2025 & 2033
- Figure 12: North America Industrial Tablets Volume (K), by Country 2025 & 2033
- Figure 13: North America Industrial Tablets Revenue Share (%), by Country 2025 & 2033
- Figure 14: North America Industrial Tablets Volume Share (%), by Country 2025 & 2033
- Figure 15: South America Industrial Tablets Revenue (million), by Application 2025 & 2033
- Figure 16: South America Industrial Tablets Volume (K), by Application 2025 & 2033
- Figure 17: South America Industrial Tablets Revenue Share (%), by Application 2025 & 2033
- Figure 18: South America Industrial Tablets Volume Share (%), by Application 2025 & 2033
- Figure 19: South America Industrial Tablets Revenue (million), by Types 2025 & 2033
- Figure 20: South America Industrial Tablets Volume (K), by Types 2025 & 2033
- Figure 21: South America Industrial Tablets Revenue Share (%), by Types 2025 & 2033
- Figure 22: South America Industrial Tablets Volume Share (%), by Types 2025 & 2033
- Figure 23: South America Industrial Tablets Revenue (million), by Country 2025 & 2033
- Figure 24: South America Industrial Tablets Volume (K), by Country 2025 & 2033
- Figure 25: South America Industrial Tablets Revenue Share (%), by Country 2025 & 2033
- Figure 26: South America Industrial Tablets Volume Share (%), by Country 2025 & 2033
- Figure 27: Europe Industrial Tablets Revenue (million), by Application 2025 & 2033
- Figure 28: Europe Industrial Tablets Volume (K), by Application 2025 & 2033
- Figure 29: Europe Industrial Tablets Revenue Share (%), by Application 2025 & 2033
- Figure 30: Europe Industrial Tablets Volume Share (%), by Application 2025 & 2033
- Figure 31: Europe Industrial Tablets Revenue (million), by Types 2025 & 2033
- Figure 32: Europe Industrial Tablets Volume (K), by Types 2025 & 2033
- Figure 33: Europe Industrial Tablets Revenue Share (%), by Types 2025 & 2033
- Figure 34: Europe Industrial Tablets Volume Share (%), by Types 2025 & 2033
- Figure 35: Europe Industrial Tablets Revenue (million), by Country 2025 & 2033
- Figure 36: Europe Industrial Tablets Volume (K), by Country 2025 & 2033
- Figure 37: Europe Industrial Tablets Revenue Share (%), by Country 2025 & 2033
- Figure 38: Europe Industrial Tablets Volume Share (%), by Country 2025 & 2033
- Figure 39: Middle East & Africa Industrial Tablets Revenue (million), by Application 2025 & 2033
- Figure 40: Middle East & Africa Industrial Tablets Volume (K), by Application 2025 & 2033
- Figure 41: Middle East & Africa Industrial Tablets Revenue Share (%), by Application 2025 & 2033
- Figure 42: Middle East & Africa Industrial Tablets Volume Share (%), by Application 2025 & 2033
- Figure 43: Middle East & Africa Industrial Tablets Revenue (million), by Types 2025 & 2033
- Figure 44: Middle East & Africa Industrial Tablets Volume (K), by Types 2025 & 2033
- Figure 45: Middle East & Africa Industrial Tablets Revenue Share (%), by Types 2025 & 2033
- Figure 46: Middle East & Africa Industrial Tablets Volume Share (%), by Types 2025 & 2033
- Figure 47: Middle East & Africa Industrial Tablets Revenue (million), by Country 2025 & 2033
- Figure 48: Middle East & Africa Industrial Tablets Volume (K), by Country 2025 & 2033
- Figure 49: Middle East & Africa Industrial Tablets Revenue Share (%), by Country 2025 & 2033
- Figure 50: Middle East & Africa Industrial Tablets Volume Share (%), by Country 2025 & 2033
- Figure 51: Asia Pacific Industrial Tablets Revenue (million), by Application 2025 & 2033
- Figure 52: Asia Pacific Industrial Tablets Volume (K), by Application 2025 & 2033
- Figure 53: Asia Pacific Industrial Tablets Revenue Share (%), by Application 2025 & 2033
- Figure 54: Asia Pacific Industrial Tablets Volume Share (%), by Application 2025 & 2033
- Figure 55: Asia Pacific Industrial Tablets Revenue (million), by Types 2025 & 2033
- Figure 56: Asia Pacific Industrial Tablets Volume (K), by Types 2025 & 2033
- Figure 57: Asia Pacific Industrial Tablets Revenue Share (%), by Types 2025 & 2033
- Figure 58: Asia Pacific Industrial Tablets Volume Share (%), by Types 2025 & 2033
- Figure 59: Asia Pacific Industrial Tablets Revenue (million), by Country 2025 & 2033
- Figure 60: Asia Pacific Industrial Tablets Volume (K), by Country 2025 & 2033
- Figure 61: Asia Pacific Industrial Tablets Revenue Share (%), by Country 2025 & 2033
- Figure 62: Asia Pacific Industrial Tablets Volume Share (%), by Country 2025 & 2033
List of Tables
- Table 1: Global Industrial Tablets Revenue million Forecast, by Application 2020 & 2033
- Table 2: Global Industrial Tablets Volume K Forecast, by Application 2020 & 2033
- Table 3: Global Industrial Tablets Revenue million Forecast, by Types 2020 & 2033
- Table 4: Global Industrial Tablets Volume K Forecast, by Types 2020 & 2033
- Table 5: Global Industrial Tablets Revenue million Forecast, by Region 2020 & 2033
- Table 6: Global Industrial Tablets Volume K Forecast, by Region 2020 & 2033
- Table 7: Global Industrial Tablets Revenue million Forecast, by Application 2020 & 2033
- Table 8: Global Industrial Tablets Volume K Forecast, by Application 2020 & 2033
- Table 9: Global Industrial Tablets Revenue million Forecast, by Types 2020 & 2033
- Table 10: Global Industrial Tablets Volume K Forecast, by Types 2020 & 2033
- Table 11: Global Industrial Tablets Revenue million Forecast, by Country 2020 & 2033
- Table 12: Global Industrial Tablets Volume K Forecast, by Country 2020 & 2033
- Table 13: United States Industrial Tablets Revenue (million) Forecast, by Application 2020 & 2033
- Table 14: United States Industrial Tablets Volume (K) Forecast, by Application 2020 & 2033
- Table 15: Canada Industrial Tablets Revenue (million) Forecast, by Application 2020 & 2033
- Table 16: Canada Industrial Tablets Volume (K) Forecast, by Application 2020 & 2033
- Table 17: Mexico Industrial Tablets Revenue (million) Forecast, by Application 2020 & 2033
- Table 18: Mexico Industrial Tablets Volume (K) Forecast, by Application 2020 & 2033
- Table 19: Global Industrial Tablets Revenue million Forecast, by Application 2020 & 2033
- Table 20: Global Industrial Tablets Volume K Forecast, by Application 2020 & 2033
- Table 21: Global Industrial Tablets Revenue million Forecast, by Types 2020 & 2033
- Table 22: Global Industrial Tablets Volume K Forecast, by Types 2020 & 2033
- Table 23: Global Industrial Tablets Revenue million Forecast, by Country 2020 & 2033
- Table 24: Global Industrial Tablets Volume K Forecast, by Country 2020 & 2033
- Table 25: Brazil Industrial Tablets Revenue (million) Forecast, by Application 2020 & 2033
- Table 26: Brazil Industrial Tablets Volume (K) Forecast, by Application 2020 & 2033
- Table 27: Argentina Industrial Tablets Revenue (million) Forecast, by Application 2020 & 2033
- Table 28: Argentina Industrial Tablets Volume (K) Forecast, by Application 2020 & 2033
- Table 29: Rest of South America Industrial Tablets Revenue (million) Forecast, by Application 2020 & 2033
- Table 30: Rest of South America Industrial Tablets Volume (K) Forecast, by Application 2020 & 2033
- Table 31: Global Industrial Tablets Revenue million Forecast, by Application 2020 & 2033
- Table 32: Global Industrial Tablets Volume K Forecast, by Application 2020 & 2033
- Table 33: Global Industrial Tablets Revenue million Forecast, by Types 2020 & 2033
- Table 34: Global Industrial Tablets Volume K Forecast, by Types 2020 & 2033
- Table 35: Global Industrial Tablets Revenue million Forecast, by Country 2020 & 2033
- Table 36: Global Industrial Tablets Volume K Forecast, by Country 2020 & 2033
- Table 37: United Kingdom Industrial Tablets Revenue (million) Forecast, by Application 2020 & 2033
- Table 38: United Kingdom Industrial Tablets Volume (K) Forecast, by Application 2020 & 2033
- Table 39: Germany Industrial Tablets Revenue (million) Forecast, by Application 2020 & 2033
- Table 40: Germany Industrial Tablets Volume (K) Forecast, by Application 2020 & 2033
- Table 41: France Industrial Tablets Revenue (million) Forecast, by Application 2020 & 2033
- Table 42: France Industrial Tablets Volume (K) Forecast, by Application 2020 & 2033
- Table 43: Italy Industrial Tablets Revenue (million) Forecast, by Application 2020 & 2033
- Table 44: Italy Industrial Tablets Volume (K) Forecast, by Application 2020 & 2033
- Table 45: Spain Industrial Tablets Revenue (million) Forecast, by Application 2020 & 2033
- Table 46: Spain Industrial Tablets Volume (K) Forecast, by Application 2020 & 2033
- Table 47: Russia Industrial Tablets Revenue (million) Forecast, by Application 2020 & 2033
- Table 48: Russia Industrial Tablets Volume (K) Forecast, by Application 2020 & 2033
- Table 49: Benelux Industrial Tablets Revenue (million) Forecast, by Application 2020 & 2033
- Table 50: Benelux Industrial Tablets Volume (K) Forecast, by Application 2020 & 2033
- Table 51: Nordics Industrial Tablets Revenue (million) Forecast, by Application 2020 & 2033
- Table 52: Nordics Industrial Tablets Volume (K) Forecast, by Application 2020 & 2033
- Table 53: Rest of Europe Industrial Tablets Revenue (million) Forecast, by Application 2020 & 2033
- Table 54: Rest of Europe Industrial Tablets Volume (K) Forecast, by Application 2020 & 2033
- Table 55: Global Industrial Tablets Revenue million Forecast, by Application 2020 & 2033
- Table 56: Global Industrial Tablets Volume K Forecast, by Application 2020 & 2033
- Table 57: Global Industrial Tablets Revenue million Forecast, by Types 2020 & 2033
- Table 58: Global Industrial Tablets Volume K Forecast, by Types 2020 & 2033
- Table 59: Global Industrial Tablets Revenue million Forecast, by Country 2020 & 2033
- Table 60: Global Industrial Tablets Volume K Forecast, by Country 2020 & 2033
- Table 61: Turkey Industrial Tablets Revenue (million) Forecast, by Application 2020 & 2033
- Table 62: Turkey Industrial Tablets Volume (K) Forecast, by Application 2020 & 2033
- Table 63: Israel Industrial Tablets Revenue (million) Forecast, by Application 2020 & 2033
- Table 64: Israel Industrial Tablets Volume (K) Forecast, by Application 2020 & 2033
- Table 65: GCC Industrial Tablets Revenue (million) Forecast, by Application 2020 & 2033
- Table 66: GCC Industrial Tablets Volume (K) Forecast, by Application 2020 & 2033
- Table 67: North Africa Industrial Tablets Revenue (million) Forecast, by Application 2020 & 2033
- Table 68: North Africa Industrial Tablets Volume (K) Forecast, by Application 2020 & 2033
- Table 69: South Africa Industrial Tablets Revenue (million) Forecast, by Application 2020 & 2033
- Table 70: South Africa Industrial Tablets Volume (K) Forecast, by Application 2020 & 2033
- Table 71: Rest of Middle East & Africa Industrial Tablets Revenue (million) Forecast, by Application 2020 & 2033
- Table 72: Rest of Middle East & Africa Industrial Tablets Volume (K) Forecast, by Application 2020 & 2033
- Table 73: Global Industrial Tablets Revenue million Forecast, by Application 2020 & 2033
- Table 74: Global Industrial Tablets Volume K Forecast, by Application 2020 & 2033
- Table 75: Global Industrial Tablets Revenue million Forecast, by Types 2020 & 2033
- Table 76: Global Industrial Tablets Volume K Forecast, by Types 2020 & 2033
- Table 77: Global Industrial Tablets Revenue million Forecast, by Country 2020 & 2033
- Table 78: Global Industrial Tablets Volume K Forecast, by Country 2020 & 2033
- Table 79: China Industrial Tablets Revenue (million) Forecast, by Application 2020 & 2033
- Table 80: China Industrial Tablets Volume (K) Forecast, by Application 2020 & 2033
- Table 81: India Industrial Tablets Revenue (million) Forecast, by Application 2020 & 2033
- Table 82: India Industrial Tablets Volume (K) Forecast, by Application 2020 & 2033
- Table 83: Japan Industrial Tablets Revenue (million) Forecast, by Application 2020 & 2033
- Table 84: Japan Industrial Tablets Volume (K) Forecast, by Application 2020 & 2033
- Table 85: South Korea Industrial Tablets Revenue (million) Forecast, by Application 2020 & 2033
- Table 86: South Korea Industrial Tablets Volume (K) Forecast, by Application 2020 & 2033
- Table 87: ASEAN Industrial Tablets Revenue (million) Forecast, by Application 2020 & 2033
- Table 88: ASEAN Industrial Tablets Volume (K) Forecast, by Application 2020 & 2033
- Table 89: Oceania Industrial Tablets Revenue (million) Forecast, by Application 2020 & 2033
- Table 90: Oceania Industrial Tablets Volume (K) Forecast, by Application 2020 & 2033
- Table 91: Rest of Asia Pacific Industrial Tablets Revenue (million) Forecast, by Application 2020 & 2033
- Table 92: Rest of Asia Pacific Industrial Tablets Volume (K) Forecast, by Application 2020 & 2033
Frequently Asked Questions
1. What is the projected Compound Annual Growth Rate (CAGR) of the Industrial Tablets?
The projected CAGR is approximately XX%.
2. Which companies are prominent players in the Industrial Tablets?
Key companies in the market include Panasonic, Dell, Getac, Zebra(Xplore), Winmate, Leonardo DRS, HP, AAEON, NEXCOM, RuggON, DT Research, Xenarc Technologies, MobileDemand, Kontron, MilDef, Trimble, Samsung, JLT Mobile Computers, Conker, Bright Alliance Technology, Estone Technology, Logic Instrument (ARCHOS).
3. What are the main segments of the Industrial Tablets?
The market segments include Application, Types.
4. Can you provide details about the market size?
The market size is estimated to be USD XXX million as of 2022.
5. What are some drivers contributing to market growth?
N/A
6. What are the notable trends driving market growth?
N/A
7. Are there any restraints impacting market growth?
N/A
8. Can you provide examples of recent developments in the market?
N/A
9. What pricing options are available for accessing the report?
Pricing options include single-user, multi-user, and enterprise licenses priced at USD 3950.00, USD 5925.00, and USD 7900.00 respectively.
10. Is the market size provided in terms of value or volume?
The market size is provided in terms of value, measured in million and volume, measured in K.
11. Are there any specific market keywords associated with the report?
Yes, the market keyword associated with the report is "Industrial Tablets," which aids in identifying and referencing the specific market segment covered.
12. How do I determine which pricing option suits my needs best?
The pricing options vary based on user requirements and access needs. Individual users may opt for single-user licenses, while businesses requiring broader access may choose multi-user or enterprise licenses for cost-effective access to the report.
13. Are there any additional resources or data provided in the Industrial Tablets report?
While the report offers comprehensive insights, it's advisable to review the specific contents or supplementary materials provided to ascertain if additional resources or data are available.
14. How can I stay updated on further developments or reports in the Industrial Tablets?
To stay informed about further developments, trends, and reports in the Industrial Tablets, consider subscribing to industry newsletters, following relevant companies and organizations, or regularly checking reputable industry news sources and publications.
Methodology
Step 1 - Identification of Relevant Samples Size from Population Database


Step 2 - Approaches for Defining Global Market Size (Value, Volume* & Price*)

Note*: In applicable scenarios
Step 3 - Data Sources
Primary Research
- Web Analytics
- Survey Reports
- Research Institute
- Latest Research Reports
- Opinion Leaders
Secondary Research
- Annual Reports
- White Paper
- Latest Press Release
- Industry Association
- Paid Database
- Investor Presentations

Step 4 - Data Triangulation
Involves using different sources of information in order to increase the validity of a study
These sources are likely to be stakeholders in a program - participants, other researchers, program staff, other community members, and so on.
Then we put all data in single framework & apply various statistical tools to find out the dynamic on the market.
During the analysis stage, feedback from the stakeholder groups would be compared to determine areas of agreement as well as areas of divergence