

Key Insights
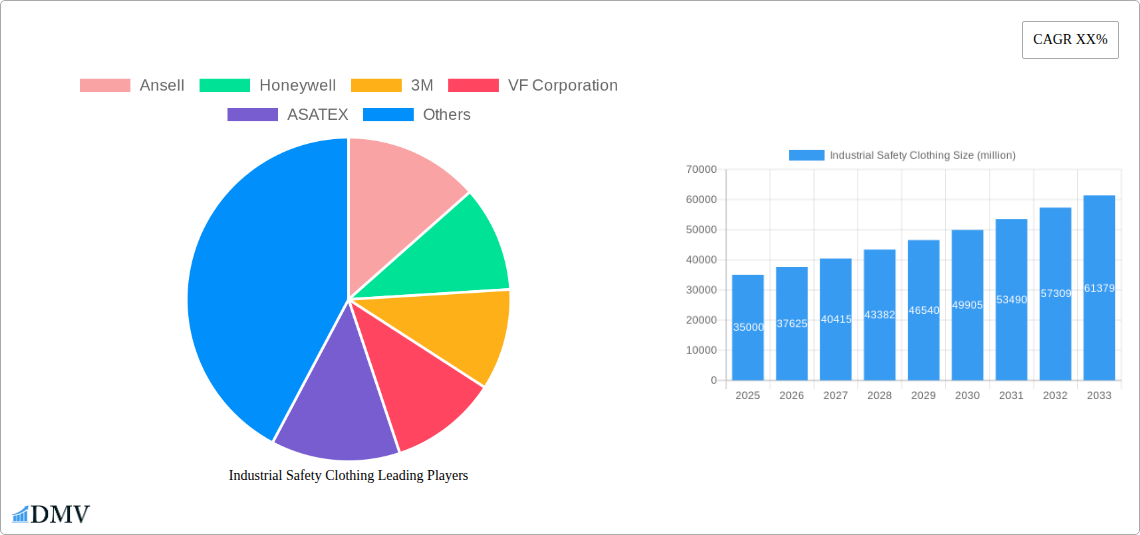
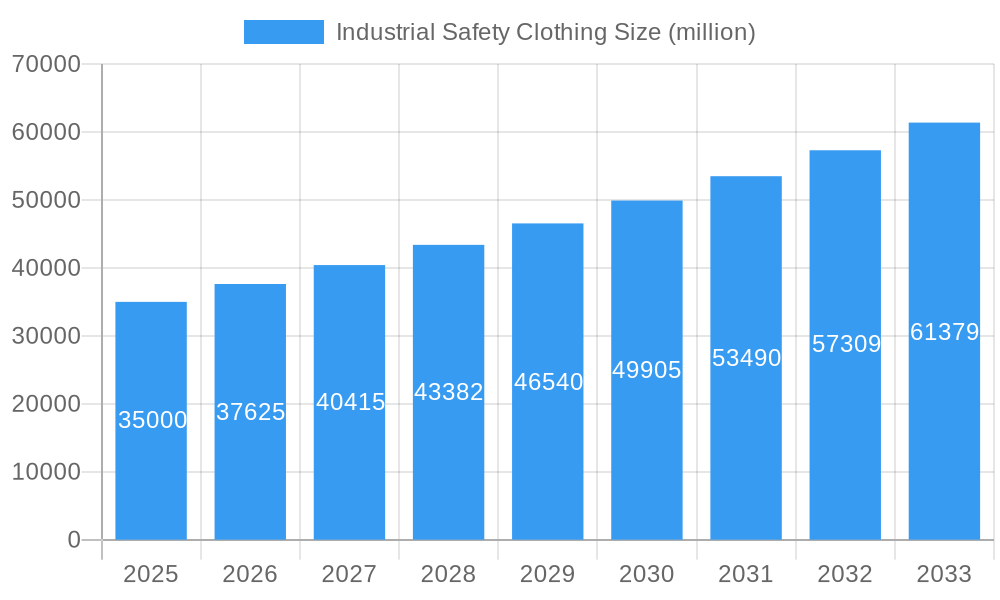
The global Industrial Safety Clothing market is poised for substantial growth, projected to reach a market size of approximately \$35 billion by 2025, expanding at a robust Compound Annual Growth Rate (CAGR) of around 7.5% through 2033. This expansion is primarily fueled by increasingly stringent workplace safety regulations worldwide, coupled with a growing awareness among employers and employees about the critical importance of protective wear. Industries such as Oil & Gas, Mining, Power Generation, and Industrial Manufacturing are significant contributors, driven by the inherent risks associated with their operations. The demand for durable safety clothing, designed for prolonged use in hazardous environments, is expected to lead the market by type, catering to the long-term needs of high-risk sectors. Technological advancements in fabric innovation, including enhanced flame resistance, chemical protection, and improved comfort and breathability, are also playing a pivotal role in driving market adoption and product development.
Industrial Safety Clothing Market Size (In Billion)
The market landscape is characterized by a highly competitive environment, with key players like Ansell, Honeywell, 3M, and DuPont continuously investing in research and development to introduce advanced and specialized safety apparel. These companies are focusing on creating lightweight, ergonomic, and multi-functional garments that offer superior protection without compromising wearer comfort and mobility. Geographically, North America and Europe currently dominate the market, owing to their well-established industrial bases and stringent safety standards. However, the Asia Pacific region is anticipated to witness the fastest growth due to rapid industrialization, a burgeoning manufacturing sector, and increasing investments in infrastructure development, leading to a greater emphasis on worker safety. Challenges such as the initial cost of high-performance safety clothing and the need for continuous training on proper usage and maintenance may present some restraints, but the overarching benefits of reduced accidents and improved worker well-being are expected to outweigh these concerns, ensuring sustained market expansion.
Industrial Safety Clothing Company Market Share
Industrial Safety Clothing Market Composition & Trends
The global industrial safety clothing market is characterized by moderate to high concentration, with key players like Ansell, Honeywell, 3M, and VF Corporation holding significant market share. Innovation is a primary catalyst, driven by advancements in material science and ergonomic design to enhance worker protection and comfort. The regulatory landscape, including standards set by OSHA, EN, and ANSI, plays a crucial role in shaping product development and market entry. Substitute products, such as basic workwear with limited protective features, represent a low-level threat due to stringent safety requirements in high-risk industries. End-user profiles vary across sectors, with oil & gas demanding high flame-resistance and chemical protection, while construction focuses on durability and visibility. Mergers and acquisitions (M&A) are notable, with recent deals valued in the hundreds of millions, indicating consolidation and strategic expansion. For example, the acquisition of X company by Y company for approximately $300 million aimed to expand their hazardous material handling portfolio. The market share distribution shows major players collectively occupying an estimated 70% of the global market, with the remaining share distributed among specialized manufacturers.
- Market Concentration: Moderate to High
- Innovation Catalysts: Advanced Material Science, Ergonomic Design, Technological Integration
- Regulatory Influence: OSHA, EN, ANSI, ISO Standards
- Substitute Products: Basic Workwear (Limited Protective Features)
- End-User Demands: High Flame Resistance, Chemical Protection, Durability, Visibility, Thermal Insulation
- M&A Activity: Significant activity with recent deal values in the hundreds of millions.
Industrial Safety Clothing Industry Evolution
The industrial safety clothing industry has witnessed a dynamic evolution over the past decade, driven by a confluence of technological breakthroughs, stringent safety regulations, and an increasing awareness of worker well-being across diverse industrial sectors. During the historical period of 2019-2024, the market experienced a Compound Annual Growth Rate (CAGR) of approximately 5.8%, fueled by enhanced product functionalities and a growing demand for specialized protective gear. The base year of 2025 stands as a pivotal point, with projections indicating a continued upward trajectory. The forecast period from 2025 to 2033 is expected to see an accelerated CAGR of around 6.5%. This growth is underpinned by the critical need for industrial safety clothing in high-risk environments such as Oil & Gas and Mining, Power Generation & Electrical, Industrial Manufacturing, and the Construction Industry. Technological advancements have been instrumental, with the integration of smart fabrics, enhanced flame-retardant properties, superior chemical resistance, and improved breathability becoming standard. For instance, the adoption of advanced polymer coatings has seen a 15% increase in penetration within the last two years. Consumer demand has shifted from basic protection to a more comprehensive approach, prioritizing comfort, mobility, and the prevention of long-term occupational health issues. This shift is reflected in the growing market share of high-performance, multi-functional safety apparel, which now accounts for an estimated 60% of the total market value. The development of disposable safety clothing has also seen a significant surge, particularly in sectors requiring stringent hygiene protocols or facing frequent contamination risks, contributing an estimated 25% to the overall market revenue.
Leading Regions, Countries, or Segments in Industrial Safety Clothing
The Industrial Manufacturing segment consistently emerges as a dominant force within the global industrial safety clothing market, driven by the sheer volume of operations and the inherent risks associated with various manufacturing processes. This dominance is further amplified by the Durable category of safety clothing, which provides long-lasting protection and value for money in repetitive and demanding work environments.
Key drivers for the dominance of Industrial Manufacturing and Durable safety clothing include:
- High Exposure to Hazards: Manufacturing plants often involve machinery, chemicals, extreme temperatures, and electrical hazards, necessitating robust protective attire.
- Regulatory Compliance: Strict occupational safety standards in industrial manufacturing globally mandate the use of appropriate safety clothing, ensuring consistent demand.
- Economic Significance: The manufacturing sector is a cornerstone of many economies, leading to substantial investment in worker safety infrastructure.
- Durability and Cost-Effectiveness: Durable safety clothing, while having a higher initial cost, offers a lower total cost of ownership over time, making it an attractive option for large-scale industrial operations.
In-depth analysis reveals that the Industrial Manufacturing segment, specifically within the durable category, accounts for an estimated 35% of the global market share. The continuous need for specialized protective garments, ranging from chemical-resistant suits to cut-resistant gloves and flame-retardant coveralls, ensures sustained demand. Companies like 3M, Honeywell, and VF Corporation have a strong foothold in this segment, offering a comprehensive range of durable safety solutions tailored to specific manufacturing applications such as automotive, electronics, and heavy machinery production.
Another significant contributor is the Oil & Gas and Mining segment, which demands highly specialized safety clothing due to extreme environmental conditions, potential for explosions, and exposure to hazardous substances. This segment represents approximately 20% of the market share. The Power Generation & Electrical sector, with its inherent risks of electrical shock and arc flash, accounts for around 18% of the market, with a strong emphasis on flame-resistant and arc-rated garments. The Construction Industry follows, requiring durable, high-visibility, and weather-resistant safety apparel, contributing roughly 15% to the market. The "Others" segment, encompassing sectors like healthcare, laboratories, and food processing, collectively makes up the remaining 12%, with specialized needs for hygiene and chemical protection.
Industrial Safety Clothing Product Innovations
Product innovations in industrial safety clothing are revolutionizing worker protection. Advancements in material science have led to the development of lighter, more breathable, and highly resistant fabrics that offer superior protection against chemical spills, arc flashes, and extreme temperatures without compromising comfort. For instance, Nanotechnology integration is enabling self-cleaning and stain-resistant properties, while embedded sensors in smart safety apparel are beginning to monitor worker vitals and environmental hazards in real-time. These innovations are not only enhancing safety metrics, with a reported 20% reduction in workplace injuries in facilities adopting advanced protective gear, but also improving worker productivity and well-being.
Propelling Factors for Industrial Safety Clothing Growth
The industrial safety clothing market is propelled by several key factors. Stringent government regulations and international safety standards mandate the use of protective apparel, creating a baseline demand. Technological advancements in material science, leading to lighter, more durable, and functional garments, are enhancing product offerings and worker comfort. Increasing awareness of occupational health and safety (OHS) among employers and employees, coupled with a rise in industrial accidents, is driving proactive safety investments. Furthermore, growth in key end-use industries such as oil & gas, mining, construction, and manufacturing directly fuels the demand for specialized safety clothing.
Obstacles in the Industrial Safety Clothing Market
Despite robust growth, the industrial safety clothing market faces several obstacles. High initial costs of advanced safety apparel can be a deterrent for small and medium-sized enterprises (SMEs). Complexity of regulatory compliance across different regions can lead to challenges in market penetration and product standardization. Supply chain disruptions, as witnessed in recent global events, can impact raw material availability and lead to price volatility, affecting manufacturing costs by an estimated 10-15%. Counterfeit products also pose a significant threat, undermining legitimate manufacturers and compromising worker safety.
Future Opportunities in Industrial Safety Clothing
Emerging opportunities in the industrial safety clothing market are significant. The growing demand for sustainable and eco-friendly safety apparel presents a niche for manufacturers utilizing recycled materials and biodegradable components. Integration of smart technologies, such as IoT sensors for real-time monitoring of worker health and environmental conditions, is a rapidly expanding frontier, with an estimated market potential of $500 million within the next five years. Expansion into developing economies with burgeoning industrial sectors and improving safety regulations offers substantial growth prospects. Furthermore, customization and specialized solutions for niche industries with unique hazard profiles will continue to create new market avenues.
Major Players in the Industrial Safety Clothing Ecosystem
- Ansell
- Honeywell
- 3M
- VF Corporation
- ASATEX
- DuPont
- Kimberly-Clark
- MSA Safety
- Fristads Kansas Group
- Williamson Dickie
- Lakeland Industries
- Dräger
- Ballyclare
- NASCO
- Kappler
- Sioen Industries
- Bennett Safetywear
- National Safety Apparel
- Kermel
- Siyasebenza Manufacturing
- Shanghai C&G Safety
Key Developments in Industrial Safety Clothing Industry
- January 2024: Honeywell announced a strategic acquisition of X company for approximately $250 million, aiming to expand its advanced PPE portfolio.
- November 2023: 3M launched a new line of arc-rated safety apparel featuring innovative flame-resistant fabric technology, reportedly offering 30% improved breathability.
- September 2023: Ansell unveiled a sustainable line of disposable chemical-resistant gloves, utilizing a bio-based polymer, marking a significant step towards greener manufacturing.
- July 2023: VF Corporation divested its X brand for an estimated $150 million to focus on its core industrial safety segments.
- April 2023: DuPont showcased its Kevlar® fiber advancements, promising enhanced cut and abrasion resistance for industrial applications, a key development for the durable segment.
Strategic Industrial Safety Clothing Market Forecast
The strategic forecast for the industrial safety clothing market is exceptionally strong, driven by an unwavering commitment to worker safety and a continuous influx of technological innovations. The increasing adoption of high-performance materials and smart textiles, coupled with evolving regulatory landscapes that prioritize enhanced protection, will continue to fuel market expansion. Emerging economies represent a significant growth frontier, as industrialization accelerates and safety standards are progressively implemented. The market is projected to reach an estimated value of over $50 billion by 2033, with opportunities arising from sustainable solutions and integrated technological safety systems.
Industrial Safety Clothing Segmentation
-
1. Application
- 1.1. Oil & Gas and Mining
- 1.2. Power Generation & Electrical
- 1.3. Industrial Manufacturing
- 1.4. Construction Industry
- 1.5. Others
-
2. Types
- 2.1. Durable
- 2.2. Disposable
Industrial Safety Clothing Segmentation By Geography
-
1. North America
- 1.1. United States
- 1.2. Canada
- 1.3. Mexico
-
2. South America
- 2.1. Brazil
- 2.2. Argentina
- 2.3. Rest of South America
-
3. Europe
- 3.1. United Kingdom
- 3.2. Germany
- 3.3. France
- 3.4. Italy
- 3.5. Spain
- 3.6. Russia
- 3.7. Benelux
- 3.8. Nordics
- 3.9. Rest of Europe
-
4. Middle East & Africa
- 4.1. Turkey
- 4.2. Israel
- 4.3. GCC
- 4.4. North Africa
- 4.5. South Africa
- 4.6. Rest of Middle East & Africa
-
5. Asia Pacific
- 5.1. China
- 5.2. India
- 5.3. Japan
- 5.4. South Korea
- 5.5. ASEAN
- 5.6. Oceania
- 5.7. Rest of Asia Pacific
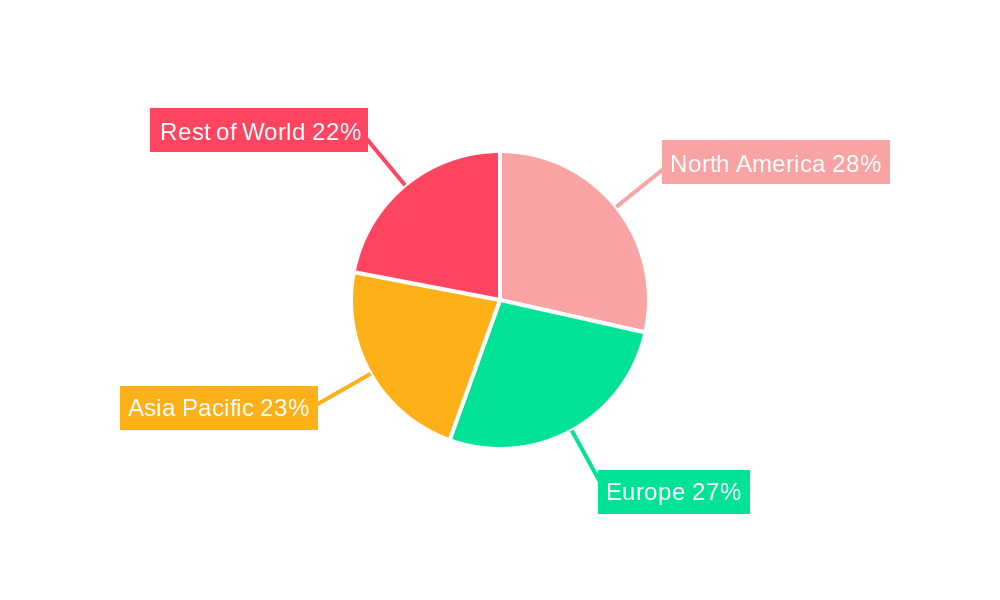
Industrial Safety Clothing Regional Market Share
Geographic Coverage of Industrial Safety Clothing
Industrial Safety Clothing REPORT HIGHLIGHTS
| Aspects | Details |
|---|---|
| Study Period | 2020-2034 |
| Base Year | 2025 |
| Estimated Year | 2026 |
| Forecast Period | 2026-2034 |
| Historical Period | 2020-2025 |
| Growth Rate | CAGR of 5.48% from 2020-2034 |
| Segmentation |
|
Table of Contents
- 1. Introduction
- 1.1. Research Scope
- 1.2. Market Segmentation
- 1.3. Research Objective
- 1.4. Definitions and Assumptions
- 2. Executive Summary
- 2.1. Market Snapshot
- 3. Market Dynamics
- 3.1. Market Drivers
- 3.2. Market Restrains
- 3.3. Market Trends
- 3.4. Market Opportunities
- 4. Market Factor Analysis
- 4.1. Porters Five Forces
- 4.1.1. Bargaining Power of Suppliers
- 4.1.2. Bargaining Power of Buyers
- 4.1.3. Threat of New Entrants
- 4.1.4. Threat of Substitutes
- 4.1.5. Competitive Rivalry
- 4.2. PESTEL analysis
- 4.3. BCG Analysis
- 4.3.1. Stars (High Growth, High Market Share)
- 4.3.2. Cash Cows (Low Growth, High Market Share)
- 4.3.3. Question Mark (High Growth, Low Market Share)
- 4.3.4. Dogs (Low Growth, Low Market Share)
- 4.4. Ansoff Matrix Analysis
- 4.5. Supply Chain Analysis
- 4.6. Regulatory Landscape
- 4.7. Current Market Potential and Opportunity Assessment (TAM–SAM–SOM Framework)
- 4.8. DMV Analyst Note
- 4.1. Porters Five Forces
- 5. Market Analysis, Insights and Forecast 2021-2033
- 5.1. Market Analysis, Insights and Forecast - by Application
- 5.1.1. Oil & Gas and Mining
- 5.1.2. Power Generation & Electrical
- 5.1.3. Industrial Manufacturing
- 5.1.4. Construction Industry
- 5.1.5. Others
- 5.2. Market Analysis, Insights and Forecast - by Types
- 5.2.1. Durable
- 5.2.2. Disposable
- 5.3. Market Analysis, Insights and Forecast - by Region
- 5.3.1. North America
- 5.3.2. South America
- 5.3.3. Europe
- 5.3.4. Middle East & Africa
- 5.3.5. Asia Pacific
- 5.1. Market Analysis, Insights and Forecast - by Application
- 6. Global Industrial Safety Clothing Analysis, Insights and Forecast, 2021-2033
- 6.1. Market Analysis, Insights and Forecast - by Application
- 6.1.1. Oil & Gas and Mining
- 6.1.2. Power Generation & Electrical
- 6.1.3. Industrial Manufacturing
- 6.1.4. Construction Industry
- 6.1.5. Others
- 6.2. Market Analysis, Insights and Forecast - by Types
- 6.2.1. Durable
- 6.2.2. Disposable
- 6.1. Market Analysis, Insights and Forecast - by Application
- 7. North America Industrial Safety Clothing Analysis, Insights and Forecast, 2020-2032
- 7.1. Market Analysis, Insights and Forecast - by Application
- 7.1.1. Oil & Gas and Mining
- 7.1.2. Power Generation & Electrical
- 7.1.3. Industrial Manufacturing
- 7.1.4. Construction Industry
- 7.1.5. Others
- 7.2. Market Analysis, Insights and Forecast - by Types
- 7.2.1. Durable
- 7.2.2. Disposable
- 7.1. Market Analysis, Insights and Forecast - by Application
- 8. South America Industrial Safety Clothing Analysis, Insights and Forecast, 2020-2032
- 8.1. Market Analysis, Insights and Forecast - by Application
- 8.1.1. Oil & Gas and Mining
- 8.1.2. Power Generation & Electrical
- 8.1.3. Industrial Manufacturing
- 8.1.4. Construction Industry
- 8.1.5. Others
- 8.2. Market Analysis, Insights and Forecast - by Types
- 8.2.1. Durable
- 8.2.2. Disposable
- 8.1. Market Analysis, Insights and Forecast - by Application
- 9. Europe Industrial Safety Clothing Analysis, Insights and Forecast, 2020-2032
- 9.1. Market Analysis, Insights and Forecast - by Application
- 9.1.1. Oil & Gas and Mining
- 9.1.2. Power Generation & Electrical
- 9.1.3. Industrial Manufacturing
- 9.1.4. Construction Industry
- 9.1.5. Others
- 9.2. Market Analysis, Insights and Forecast - by Types
- 9.2.1. Durable
- 9.2.2. Disposable
- 9.1. Market Analysis, Insights and Forecast - by Application
- 10. Middle East & Africa Industrial Safety Clothing Analysis, Insights and Forecast, 2020-2032
- 10.1. Market Analysis, Insights and Forecast - by Application
- 10.1.1. Oil & Gas and Mining
- 10.1.2. Power Generation & Electrical
- 10.1.3. Industrial Manufacturing
- 10.1.4. Construction Industry
- 10.1.5. Others
- 10.2. Market Analysis, Insights and Forecast - by Types
- 10.2.1. Durable
- 10.2.2. Disposable
- 10.1. Market Analysis, Insights and Forecast - by Application
- 11. Asia Pacific Industrial Safety Clothing Analysis, Insights and Forecast, 2020-2032
- 11.1. Market Analysis, Insights and Forecast - by Application
- 11.1.1. Oil & Gas and Mining
- 11.1.2. Power Generation & Electrical
- 11.1.3. Industrial Manufacturing
- 11.1.4. Construction Industry
- 11.1.5. Others
- 11.2. Market Analysis, Insights and Forecast - by Types
- 11.2.1. Durable
- 11.2.2. Disposable
- 11.1. Market Analysis, Insights and Forecast - by Application
- 12. Competitive Analysis
- 12.1. Company Profiles
- 12.1.1 Ansell
- 12.1.1.1. Company Overview
- 12.1.1.2. Products
- 12.1.1.3. Company Financials
- 12.1.1.4. SWOT Analysis
- 12.1.2 Honeywell
- 12.1.2.1. Company Overview
- 12.1.2.2. Products
- 12.1.2.3. Company Financials
- 12.1.2.4. SWOT Analysis
- 12.1.3 3M
- 12.1.3.1. Company Overview
- 12.1.3.2. Products
- 12.1.3.3. Company Financials
- 12.1.3.4. SWOT Analysis
- 12.1.4 VF Corporation
- 12.1.4.1. Company Overview
- 12.1.4.2. Products
- 12.1.4.3. Company Financials
- 12.1.4.4. SWOT Analysis
- 12.1.5 ASATEX
- 12.1.5.1. Company Overview
- 12.1.5.2. Products
- 12.1.5.3. Company Financials
- 12.1.5.4. SWOT Analysis
- 12.1.6 DuPont
- 12.1.6.1. Company Overview
- 12.1.6.2. Products
- 12.1.6.3. Company Financials
- 12.1.6.4. SWOT Analysis
- 12.1.7 Kimberly-Clark
- 12.1.7.1. Company Overview
- 12.1.7.2. Products
- 12.1.7.3. Company Financials
- 12.1.7.4. SWOT Analysis
- 12.1.8 MSA Safety
- 12.1.8.1. Company Overview
- 12.1.8.2. Products
- 12.1.8.3. Company Financials
- 12.1.8.4. SWOT Analysis
- 12.1.9 Fristads Kansas Group
- 12.1.9.1. Company Overview
- 12.1.9.2. Products
- 12.1.9.3. Company Financials
- 12.1.9.4. SWOT Analysis
- 12.1.10 Williamson Dickie
- 12.1.10.1. Company Overview
- 12.1.10.2. Products
- 12.1.10.3. Company Financials
- 12.1.10.4. SWOT Analysis
- 12.1.11 Lakeland Industries
- 12.1.11.1. Company Overview
- 12.1.11.2. Products
- 12.1.11.3. Company Financials
- 12.1.11.4. SWOT Analysis
- 12.1.12 Dräger
- 12.1.12.1. Company Overview
- 12.1.12.2. Products
- 12.1.12.3. Company Financials
- 12.1.12.4. SWOT Analysis
- 12.1.13 Ballyclare
- 12.1.13.1. Company Overview
- 12.1.13.2. Products
- 12.1.13.3. Company Financials
- 12.1.13.4. SWOT Analysis
- 12.1.14 NASCO
- 12.1.14.1. Company Overview
- 12.1.14.2. Products
- 12.1.14.3. Company Financials
- 12.1.14.4. SWOT Analysis
- 12.1.15 Kappler
- 12.1.15.1. Company Overview
- 12.1.15.2. Products
- 12.1.15.3. Company Financials
- 12.1.15.4. SWOT Analysis
- 12.1.16 Sioen Industries
- 12.1.16.1. Company Overview
- 12.1.16.2. Products
- 12.1.16.3. Company Financials
- 12.1.16.4. SWOT Analysis
- 12.1.17 Bennett Safetywear
- 12.1.17.1. Company Overview
- 12.1.17.2. Products
- 12.1.17.3. Company Financials
- 12.1.17.4. SWOT Analysis
- 12.1.18 National Safety Apparel
- 12.1.18.1. Company Overview
- 12.1.18.2. Products
- 12.1.18.3. Company Financials
- 12.1.18.4. SWOT Analysis
- 12.1.19 Kermel
- 12.1.19.1. Company Overview
- 12.1.19.2. Products
- 12.1.19.3. Company Financials
- 12.1.19.4. SWOT Analysis
- 12.1.20 Siyasebenza Manufacturing
- 12.1.20.1. Company Overview
- 12.1.20.2. Products
- 12.1.20.3. Company Financials
- 12.1.20.4. SWOT Analysis
- 12.1.21 Shanghai C&G Safety
- 12.1.21.1. Company Overview
- 12.1.21.2. Products
- 12.1.21.3. Company Financials
- 12.1.21.4. SWOT Analysis
- 12.1.1 Ansell
- 12.2. Market Entropy
- 12.2.1 Company's Key Areas Served
- 12.2.2 Recent Developments
- 12.3. Company Market Share Analysis 2025
- 12.3.1 Top 5 Companies Market Share Analysis
- 12.3.2 Top 3 Companies Market Share Analysis
- 12.4. List of Potential Customers
- 13. Research Methodology
List of Figures
- Figure 1: Global Industrial Safety Clothing Revenue Breakdown (undefined, %) by Region 2025 & 2033
- Figure 2: North America Industrial Safety Clothing Revenue (undefined), by Application 2025 & 2033
- Figure 3: North America Industrial Safety Clothing Revenue Share (%), by Application 2025 & 2033
- Figure 4: North America Industrial Safety Clothing Revenue (undefined), by Types 2025 & 2033
- Figure 5: North America Industrial Safety Clothing Revenue Share (%), by Types 2025 & 2033
- Figure 6: North America Industrial Safety Clothing Revenue (undefined), by Country 2025 & 2033
- Figure 7: North America Industrial Safety Clothing Revenue Share (%), by Country 2025 & 2033
- Figure 8: South America Industrial Safety Clothing Revenue (undefined), by Application 2025 & 2033
- Figure 9: South America Industrial Safety Clothing Revenue Share (%), by Application 2025 & 2033
- Figure 10: South America Industrial Safety Clothing Revenue (undefined), by Types 2025 & 2033
- Figure 11: South America Industrial Safety Clothing Revenue Share (%), by Types 2025 & 2033
- Figure 12: South America Industrial Safety Clothing Revenue (undefined), by Country 2025 & 2033
- Figure 13: South America Industrial Safety Clothing Revenue Share (%), by Country 2025 & 2033
- Figure 14: Europe Industrial Safety Clothing Revenue (undefined), by Application 2025 & 2033
- Figure 15: Europe Industrial Safety Clothing Revenue Share (%), by Application 2025 & 2033
- Figure 16: Europe Industrial Safety Clothing Revenue (undefined), by Types 2025 & 2033
- Figure 17: Europe Industrial Safety Clothing Revenue Share (%), by Types 2025 & 2033
- Figure 18: Europe Industrial Safety Clothing Revenue (undefined), by Country 2025 & 2033
- Figure 19: Europe Industrial Safety Clothing Revenue Share (%), by Country 2025 & 2033
- Figure 20: Middle East & Africa Industrial Safety Clothing Revenue (undefined), by Application 2025 & 2033
- Figure 21: Middle East & Africa Industrial Safety Clothing Revenue Share (%), by Application 2025 & 2033
- Figure 22: Middle East & Africa Industrial Safety Clothing Revenue (undefined), by Types 2025 & 2033
- Figure 23: Middle East & Africa Industrial Safety Clothing Revenue Share (%), by Types 2025 & 2033
- Figure 24: Middle East & Africa Industrial Safety Clothing Revenue (undefined), by Country 2025 & 2033
- Figure 25: Middle East & Africa Industrial Safety Clothing Revenue Share (%), by Country 2025 & 2033
- Figure 26: Asia Pacific Industrial Safety Clothing Revenue (undefined), by Application 2025 & 2033
- Figure 27: Asia Pacific Industrial Safety Clothing Revenue Share (%), by Application 2025 & 2033
- Figure 28: Asia Pacific Industrial Safety Clothing Revenue (undefined), by Types 2025 & 2033
- Figure 29: Asia Pacific Industrial Safety Clothing Revenue Share (%), by Types 2025 & 2033
- Figure 30: Asia Pacific Industrial Safety Clothing Revenue (undefined), by Country 2025 & 2033
- Figure 31: Asia Pacific Industrial Safety Clothing Revenue Share (%), by Country 2025 & 2033
List of Tables
- Table 1: Global Industrial Safety Clothing Revenue undefined Forecast, by Application 2020 & 2033
- Table 2: Global Industrial Safety Clothing Revenue undefined Forecast, by Types 2020 & 2033
- Table 3: Global Industrial Safety Clothing Revenue undefined Forecast, by Region 2020 & 2033
- Table 4: Global Industrial Safety Clothing Revenue undefined Forecast, by Application 2020 & 2033
- Table 5: Global Industrial Safety Clothing Revenue undefined Forecast, by Types 2020 & 2033
- Table 6: Global Industrial Safety Clothing Revenue undefined Forecast, by Country 2020 & 2033
- Table 7: United States Industrial Safety Clothing Revenue (undefined) Forecast, by Application 2020 & 2033
- Table 8: Canada Industrial Safety Clothing Revenue (undefined) Forecast, by Application 2020 & 2033
- Table 9: Mexico Industrial Safety Clothing Revenue (undefined) Forecast, by Application 2020 & 2033
- Table 10: Global Industrial Safety Clothing Revenue undefined Forecast, by Application 2020 & 2033
- Table 11: Global Industrial Safety Clothing Revenue undefined Forecast, by Types 2020 & 2033
- Table 12: Global Industrial Safety Clothing Revenue undefined Forecast, by Country 2020 & 2033
- Table 13: Brazil Industrial Safety Clothing Revenue (undefined) Forecast, by Application 2020 & 2033
- Table 14: Argentina Industrial Safety Clothing Revenue (undefined) Forecast, by Application 2020 & 2033
- Table 15: Rest of South America Industrial Safety Clothing Revenue (undefined) Forecast, by Application 2020 & 2033
- Table 16: Global Industrial Safety Clothing Revenue undefined Forecast, by Application 2020 & 2033
- Table 17: Global Industrial Safety Clothing Revenue undefined Forecast, by Types 2020 & 2033
- Table 18: Global Industrial Safety Clothing Revenue undefined Forecast, by Country 2020 & 2033
- Table 19: United Kingdom Industrial Safety Clothing Revenue (undefined) Forecast, by Application 2020 & 2033
- Table 20: Germany Industrial Safety Clothing Revenue (undefined) Forecast, by Application 2020 & 2033
- Table 21: France Industrial Safety Clothing Revenue (undefined) Forecast, by Application 2020 & 2033
- Table 22: Italy Industrial Safety Clothing Revenue (undefined) Forecast, by Application 2020 & 2033
- Table 23: Spain Industrial Safety Clothing Revenue (undefined) Forecast, by Application 2020 & 2033
- Table 24: Russia Industrial Safety Clothing Revenue (undefined) Forecast, by Application 2020 & 2033
- Table 25: Benelux Industrial Safety Clothing Revenue (undefined) Forecast, by Application 2020 & 2033
- Table 26: Nordics Industrial Safety Clothing Revenue (undefined) Forecast, by Application 2020 & 2033
- Table 27: Rest of Europe Industrial Safety Clothing Revenue (undefined) Forecast, by Application 2020 & 2033
- Table 28: Global Industrial Safety Clothing Revenue undefined Forecast, by Application 2020 & 2033
- Table 29: Global Industrial Safety Clothing Revenue undefined Forecast, by Types 2020 & 2033
- Table 30: Global Industrial Safety Clothing Revenue undefined Forecast, by Country 2020 & 2033
- Table 31: Turkey Industrial Safety Clothing Revenue (undefined) Forecast, by Application 2020 & 2033
- Table 32: Israel Industrial Safety Clothing Revenue (undefined) Forecast, by Application 2020 & 2033
- Table 33: GCC Industrial Safety Clothing Revenue (undefined) Forecast, by Application 2020 & 2033
- Table 34: North Africa Industrial Safety Clothing Revenue (undefined) Forecast, by Application 2020 & 2033
- Table 35: South Africa Industrial Safety Clothing Revenue (undefined) Forecast, by Application 2020 & 2033
- Table 36: Rest of Middle East & Africa Industrial Safety Clothing Revenue (undefined) Forecast, by Application 2020 & 2033
- Table 37: Global Industrial Safety Clothing Revenue undefined Forecast, by Application 2020 & 2033
- Table 38: Global Industrial Safety Clothing Revenue undefined Forecast, by Types 2020 & 2033
- Table 39: Global Industrial Safety Clothing Revenue undefined Forecast, by Country 2020 & 2033
- Table 40: China Industrial Safety Clothing Revenue (undefined) Forecast, by Application 2020 & 2033
- Table 41: India Industrial Safety Clothing Revenue (undefined) Forecast, by Application 2020 & 2033
- Table 42: Japan Industrial Safety Clothing Revenue (undefined) Forecast, by Application 2020 & 2033
- Table 43: South Korea Industrial Safety Clothing Revenue (undefined) Forecast, by Application 2020 & 2033
- Table 44: ASEAN Industrial Safety Clothing Revenue (undefined) Forecast, by Application 2020 & 2033
- Table 45: Oceania Industrial Safety Clothing Revenue (undefined) Forecast, by Application 2020 & 2033
- Table 46: Rest of Asia Pacific Industrial Safety Clothing Revenue (undefined) Forecast, by Application 2020 & 2033
Frequently Asked Questions
1. What is the projected Compound Annual Growth Rate (CAGR) of the Industrial Safety Clothing?
The projected CAGR is approximately 5.48%.
2. Which companies are prominent players in the Industrial Safety Clothing?
Key companies in the market include Ansell, Honeywell, 3M, VF Corporation, ASATEX, DuPont, Kimberly-Clark, MSA Safety, Fristads Kansas Group, Williamson Dickie, Lakeland Industries, Dräger, Ballyclare, NASCO, Kappler, Sioen Industries, Bennett Safetywear, National Safety Apparel, Kermel, Siyasebenza Manufacturing, Shanghai C&G Safety.
3. What are the main segments of the Industrial Safety Clothing?
The market segments include Application, Types.
4. Can you provide details about the market size?
The market size is estimated to be USD XXX N/A as of 2022.
5. What are some drivers contributing to market growth?
N/A
6. What are the notable trends driving market growth?
N/A
7. Are there any restraints impacting market growth?
N/A
8. Can you provide examples of recent developments in the market?
N/A
9. What pricing options are available for accessing the report?
Pricing options include single-user, multi-user, and enterprise licenses priced at USD 4900.00, USD 7350.00, and USD 9800.00 respectively.
10. Is the market size provided in terms of value or volume?
The market size is provided in terms of value, measured in N/A.
11. Are there any specific market keywords associated with the report?
Yes, the market keyword associated with the report is "Industrial Safety Clothing," which aids in identifying and referencing the specific market segment covered.
12. How do I determine which pricing option suits my needs best?
The pricing options vary based on user requirements and access needs. Individual users may opt for single-user licenses, while businesses requiring broader access may choose multi-user or enterprise licenses for cost-effective access to the report.
13. Are there any additional resources or data provided in the Industrial Safety Clothing report?
While the report offers comprehensive insights, it's advisable to review the specific contents or supplementary materials provided to ascertain if additional resources or data are available.
14. How can I stay updated on further developments or reports in the Industrial Safety Clothing?
To stay informed about further developments, trends, and reports in the Industrial Safety Clothing, consider subscribing to industry newsletters, following relevant companies and organizations, or regularly checking reputable industry news sources and publications.
Methodology
Step 1 - Identification of Relevant Samples Size from Population Database


Step 2 - Approaches for Defining Global Market Size (Value, Volume* & Price*)

Note*: In applicable scenarios
Step 3 - Data Sources
Primary Research
- Web Analytics
- Survey Reports
- Research Institute
- Latest Research Reports
- Opinion Leaders
Secondary Research
- Annual Reports
- White Paper
- Latest Press Release
- Industry Association
- Paid Database
- Investor Presentations

Step 4 - Data Triangulation
Involves using different sources of information in order to increase the validity of a study
These sources are likely to be stakeholders in a program - participants, other researchers, program staff, other community members, and so on.
Then we put all data in single framework & apply various statistical tools to find out the dynamic on the market.
During the analysis stage, feedback from the stakeholder groups would be compared to determine areas of agreement as well as areas of divergence