

Key Insights
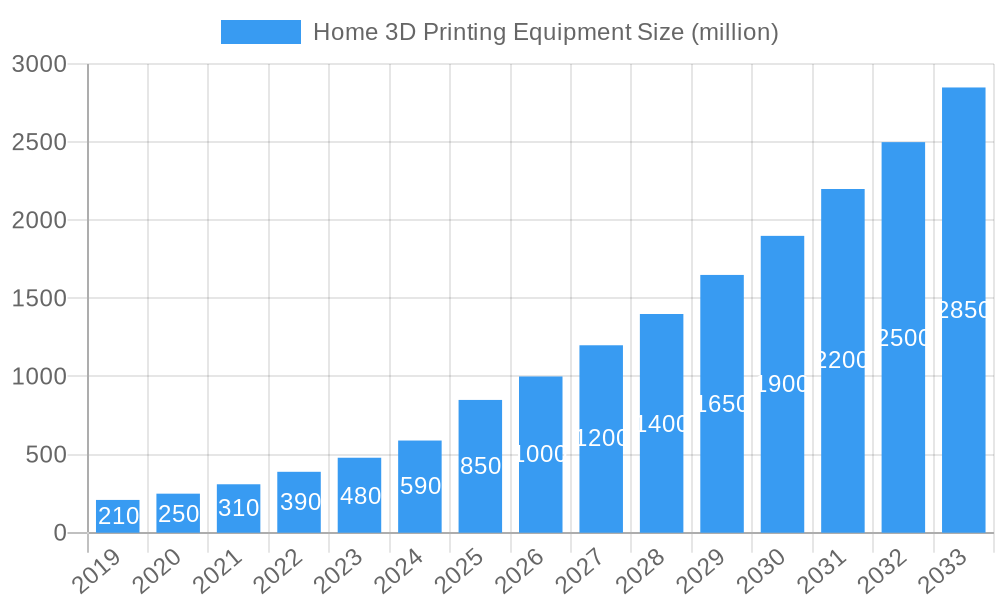
The Home 3D Printing Equipment market is poised for significant expansion, projected to reach an estimated market size of $850 million in 2025. This robust growth is fueled by a Compound Annual Growth Rate (CAGR) of 18.5% over the forecast period of 2025-2033. A key driver for this surge is the increasing affordability and user-friendliness of desktop 3D printers, making them accessible to a wider consumer base. The burgeoning interest in DIY projects, personalized product creation, and educational applications within households further propels market demand. Moreover, advancements in printing technologies, such as improved FDM (Fused Deposition Modeling) for intricate designs and more accessible SLA (Stereolithography) for detailed prototypes, are expanding the creative possibilities for home users. The growing adoption of 3D printing for hobbies, crafts, and even functional household item production underscores its transition from a niche technology to a mainstream consumer tool.
Home 3D Printing Equipment Market Size (In Million)
The market is characterized by several influential trends, including the integration of smart features for enhanced user experience and connectivity, and the development of more sustainable and biodegradable filament materials, aligning with growing environmental consciousness. The growing popularity of online communities and readily available design repositories also empowers individuals to create and share their 3D printed projects, fostering a collaborative ecosystem. While the market is experiencing rapid growth, potential restraints include the initial cost of higher-end machines, the learning curve associated with advanced functionalities, and the need for ongoing maintenance and material replenishment. Despite these challenges, the inherent flexibility, customization potential, and the sheer joy of bringing digital designs to life are expected to outweigh these hurdles, solidifying the home 3D printing equipment market's upward trajectory.
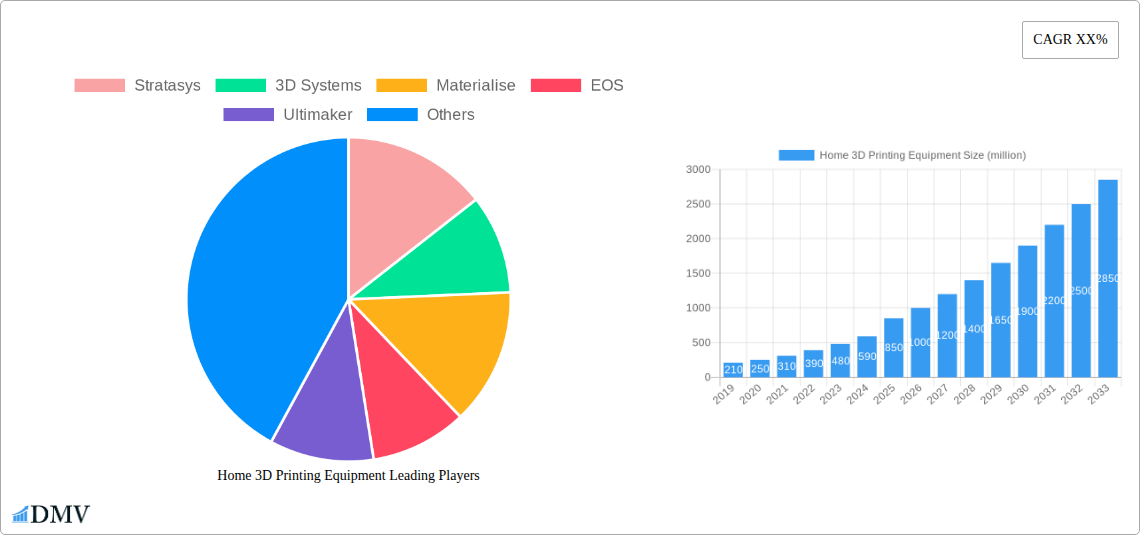
Home 3D Printing Equipment Company Market Share
Home 3D Printing Equipment Market Composition & Trends
The home 3D printing equipment market is characterized by a dynamic interplay of innovation, evolving consumer needs, and a nascent but growing regulatory landscape. While not as consolidated as some mature industries, key players like Stratasys, 3D Systems, Ultimaker, and Prusa Research hold significant influence, shaping market concentration through their product portfolios and technological advancements. The market exhibits a healthy level of innovation, driven by the pursuit of enhanced print quality, speed, and material versatility, alongside a growing demand for user-friendly, affordable 3D printers for hobbyist and educational purposes. Substitute products, such as traditional manufacturing methods and pre-fabricated items, still present a considerable challenge, yet the unique customization and rapid prototyping capabilities of 3D printing continue to carve out its niche. End-user profiles are diversifying, ranging from dedicated hobbyists and educators to small businesses seeking on-demand production. Mergers and acquisitions (M&A) activity, while not yet reaching monumental scales, are observed as companies seek to expand their technological capabilities or market reach. For instance, a hypothetical M&A deal value of xx million could represent strategic consolidation. The market share distribution shows a gradual shift, with specialized FDM and SLA printers for home use gaining traction.
- Market Concentration: Moderate, with key players like Stratasys, 3D Systems, Ultimaker, and Prusa Research driving innovation.
- Innovation Catalysts: Demand for improved print quality, speed, material options, and user-friendliness.
- Regulatory Landscapes: Emerging, with a focus on safety standards and intellectual property protection.
- Substitute Products: Traditional manufacturing, pre-fabricated items.
- End-User Profiles: Hobbyists, educators, DIY enthusiasts, small businesses.
- M&A Activities: Emerging, focusing on technological integration and market expansion.
- Estimated Market Share Distribution: FDM printers (approx. 60%), SLA printers (approx. 30%), SLS printers (approx. 10%).
Home 3D Printing Equipment Industry Evolution
The home 3D printing equipment industry has undergone a significant evolution, transforming from a niche technology for early adopters to an increasingly accessible tool for a broader consumer base. Over the study period of 2019–2033, the market has witnessed substantial growth trajectories fueled by continuous technological advancements and shifting consumer demands. In the historical period (2019–2024), we observed a steady rise in adoption rates, with an estimated average annual growth rate of 15%, driven primarily by the increasing affordability and user-friendliness of Fused Deposition Modeling (FDM) printers. As the base year of 2025 arrives, the market is poised for accelerated expansion, projected to experience a robust compound annual growth rate (CAGR) of 20% during the forecast period (2025–2033). This surge is attributed to several key factors. Firstly, ongoing technological breakthroughs are enhancing print speeds, precision, and the variety of printable materials, opening up new application possibilities for consumers. Innovations in extruder technology and material science are enabling the creation of more durable, flexible, and even food-safe prints, broadening the appeal beyond basic prototyping. Secondly, consumer demand is evolving. With the growing popularity of DIY projects, personalized products, and the increasing integration of 3D printing into educational curricula, the desire for accessible and intuitive 3D printing solutions at home is palpable. Educational institutions are increasingly incorporating 3D printing into STEM education, creating a sustained demand for reliable and cost-effective desktop printers. Furthermore, the entertainment sector is also becoming a significant driver, with hobbyists and enthusiasts utilizing 3D printing for creating custom figurines, cosplay props, and intricate models. The market is also seeing a push towards more sophisticated technologies like Stereolithography (SLA) and Selective Laser Sintering (SLS) finding their way into higher-end home setups, offering superior resolution and material properties, albeit at a higher price point. The estimated adoption metric for 3D printers in households has risen from xx% in 2019 to an estimated xx% in 2025, with projections indicating a reach of xx% by 2033. The industry's evolution is a testament to its adaptability and its growing indispensability in the modern, digitally-connected home.
Leading Regions, Countries, or Segments in Home 3D Printing Equipment
Within the dynamic landscape of home 3D printing equipment, several regions, countries, and specific technology segments stand out as dominant forces, shaping market trends and driving adoption. In terms of application, the Education segment is a significant growth engine, underscoring the increasing integration of 3D printing into learning environments globally. Countries that have prioritized STEM education and invested in technological infrastructure are naturally leading this charge. For instance, North America, particularly the United States, and parts of Europe, such as Germany and the United Kingdom, have seen widespread adoption of 3D printers in schools and universities. This dominance is fueled by government initiatives, grant programs supporting educational technology, and a proactive approach to preparing students for future careers in technology and manufacturing. Regulatory support, through curriculum development guidelines that encourage hands-on learning and innovation, plays a crucial role. Investment trends in educational technology are consistently high, indicating a sustained commitment to incorporating 3D printing into pedagogical practices.
Technologically, the FDM (Fused Deposition Modeling) segment continues to hold a commanding lead in the home 3D printing equipment market. Its widespread adoption is driven by its cost-effectiveness, ease of use, and the availability of a vast array of printable materials. The simplicity of the FDM process, where thermoplastic filament is heated and extruded layer by layer, makes it an ideal entry point for hobbyists and educational users. Key drivers for FDM's dominance include its affordability, with entry-level FDM printers available for under $500, and the continuous improvements in print quality and reliability by manufacturers like Ultimaker, Prusa Research, and MakerBot. The accessibility of filament materials, ranging from PLA and ABS to more advanced composites, further solidifies its position. While SLA and SLS technologies offer higher resolution and superior material properties, their current higher price points and more complex post-processing requirements limit their widespread adoption in the general home market. However, as these technologies become more affordable and user-friendly, their market share is expected to grow. The sheer volume of FDM printers sold annually, estimated to be in the millions, highlights its unparalleled penetration into homes and educational institutions worldwide.
Dominant Application Segment: Education
- Key Drivers: Government initiatives in STEM education, grant programs for educational technology, proactive curriculum development.
- Leading Regions/Countries: North America (USA), Europe (Germany, UK).
- Investment Trends: Consistently high investment in educational technology.
- Regulatory Support: Curriculum guidelines encouraging innovation and hands-on learning.
Dominant Technology Segment: FDM (Fused Deposition Modeling)
- Key Drivers: Affordability, ease of use, wide material availability, continuous technological improvements.
- Leading Manufacturers: Ultimaker, Prusa Research, MakerBot, XYZprinting.
- Adoption Metrics: Estimated millions of units sold annually, growing household penetration.
- Price Point: Entry-level printers available for under $500.
Home 3D Printing Equipment Product Innovations
The home 3D printing equipment market is abuzz with innovative product development, aimed at enhancing user experience and expanding application possibilities. Manufacturers are increasingly focusing on creating printers that are not only more precise and faster but also significantly easier to operate. Recent innovations include advancements in auto-calibration systems, reducing setup time and complexity for users. Furthermore, the development of multi-material printing capabilities, allowing for the creation of objects with diverse properties within a single print, is a notable leap. Enhanced print speeds, achieved through more efficient stepper motors and optimized motion systems, are also a key focus, enabling users to bring their ideas to life more quickly. The integration of user-friendly software interfaces and cloud connectivity further streamlines the design-to-print workflow. For instance, Formlabs' resin printers are pushing the boundaries of detail and surface finish, making professional-grade results accessible at home, while LulzBot continues to emphasize open-source flexibility and robust build quality.
Propelling Factors for Home 3D Printing Equipment Growth
Several key factors are propelling the growth of the home 3D printing equipment market. Technologically, continuous improvements in printer resolution, speed, and material diversity are making the technology more appealing and capable for a wider range of applications. The introduction of more affordable and user-friendly FDM and SLA printers is a significant economic driver, lowering the barrier to entry for consumers. Furthermore, the increasing integration of 3D printing into educational curricula, driven by government initiatives to foster STEM skills, is creating a consistent demand from schools and households alike. The growing popularity of DIY culture, personalized products, and the desire for rapid prototyping of creative ideas also contribute significantly to market expansion.
Obstacles in the Home 3D Printing Equipment Market
Despite its growth potential, the home 3D printing equipment market faces several obstacles. Regulatory challenges, particularly concerning material safety and product standards for consumer-grade devices, can slow down innovation and adoption. Supply chain disruptions, as witnessed globally in recent years, can impact the availability and cost of components and finished printers. Competitive pressures from established manufacturers and emerging players constantly drive down prices, potentially impacting profit margins for some companies. Additionally, the technical learning curve associated with some advanced 3D printing technologies and the ongoing need for maintenance and troubleshooting can deter less tech-savvy consumers. The estimated impact of these challenges on market growth is projected to be around xx% over the next few years.
Future Opportunities in Home 3D Printing Equipment
The future of home 3D printing equipment is ripe with opportunities. Emerging markets in developing economies present significant untapped potential as disposable incomes rise and access to technology improves. New material innovations, such as biodegradable filaments and advanced composites, will unlock novel applications in areas like sustainable product design and specialized hobbyist creations. The growing trend towards personalization and on-demand manufacturing in consumer goods also bodes well for home 3D printing. Furthermore, advancements in AI-powered design software and integrated scanning technologies will further democratize the design process, making it more accessible to a broader audience. The integration of 3D printing into the metaverse and virtual reality environments also presents an exciting avenue for future expansion.
Major Players in the Home 3D Printing Equipment Ecosystem
- Stratasys
- 3D Systems
- Materialise
- EOS
- Ultimaker
- Prusa Research
- Formlabs
- MakerBot
- XYZprinting
- LulzBot
Key Developments in Home 3D Printing Equipment Industry
- 2023: Introduction of enhanced auto-calibration features in consumer-grade FDM printers, simplifying setup for beginners.
- 2023: Increased availability of high-resolution SLA printers for home use, offering professional-grade surface finishes.
- 2022: Growth in multi-material printing capabilities for desktop FDM printers, enabling more complex designs.
- 2022: Expansion of cloud-connected 3D printing ecosystems, offering remote monitoring and file management.
- 2021: Significant price reductions in entry-level FDM printers, making them more accessible to a wider consumer base.
- 2020: Increased focus on user-friendly software interfaces and intuitive workflow design for home users.
- 2019: Growing adoption of 3D printing in educational institutions, driving demand for classroom-ready solutions.
Strategic Home 3D Printing Equipment Market Forecast
The strategic outlook for the home 3D printing equipment market is exceptionally positive, driven by a confluence of technological advancements and burgeoning consumer interest. The forecast period (2025–2033) is expected to witness substantial growth, propelled by ongoing innovation in printer speed, precision, and material versatility, which will unlock new consumer applications. The increasing affordability and ease of use of FDM and SLA technologies will continue to be key growth catalysts, lowering the entry barrier for hobbyists, students, and small-scale creators. The expanding integration of 3D printing into educational frameworks globally will further solidify a sustained demand. Emerging opportunities in personalization, on-demand manufacturing, and integration with digital platforms like the metaverse present exciting avenues for market expansion, positioning the home 3D printing equipment sector for significant and sustained growth.
Home 3D Printing Equipment Segmentation
-
1. Application
- 1.1. Entertainment
- 1.2. Education
-
2. Types
- 2.1. FDM (Fused Deposition Modeling)
- 2.2. SLA (Stereolithography)
- 2.3. SLS (Selective Laser Sintering)
Home 3D Printing Equipment Segmentation By Geography
-
1. North America
- 1.1. United States
- 1.2. Canada
- 1.3. Mexico
-
2. South America
- 2.1. Brazil
- 2.2. Argentina
- 2.3. Rest of South America
-
3. Europe
- 3.1. United Kingdom
- 3.2. Germany
- 3.3. France
- 3.4. Italy
- 3.5. Spain
- 3.6. Russia
- 3.7. Benelux
- 3.8. Nordics
- 3.9. Rest of Europe
-
4. Middle East & Africa
- 4.1. Turkey
- 4.2. Israel
- 4.3. GCC
- 4.4. North Africa
- 4.5. South Africa
- 4.6. Rest of Middle East & Africa
-
5. Asia Pacific
- 5.1. China
- 5.2. India
- 5.3. Japan
- 5.4. South Korea
- 5.5. ASEAN
- 5.6. Oceania
- 5.7. Rest of Asia Pacific
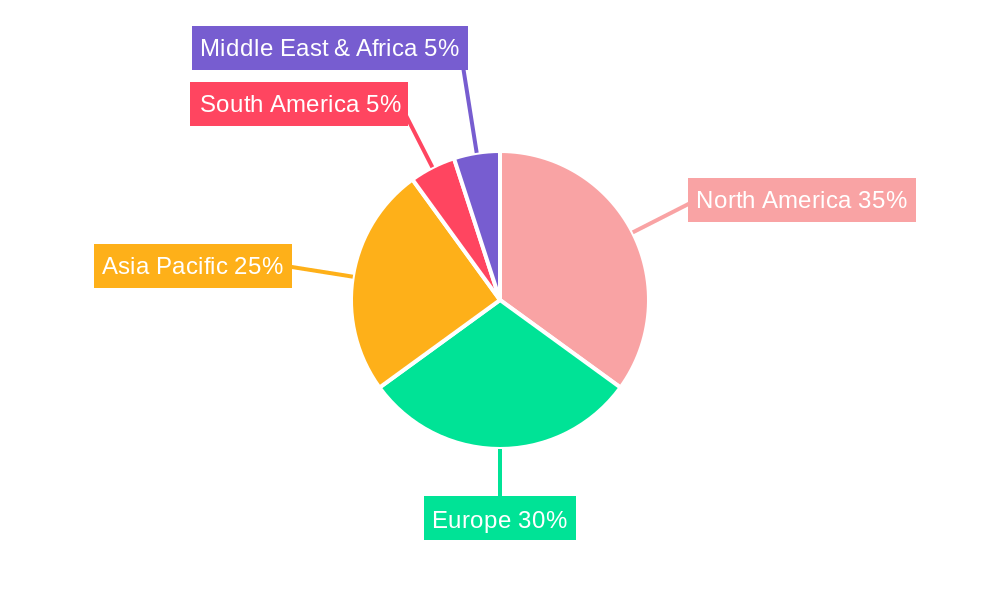
Home 3D Printing Equipment Regional Market Share
Geographic Coverage of Home 3D Printing Equipment
Home 3D Printing Equipment REPORT HIGHLIGHTS
| Aspects | Details |
|---|---|
| Study Period | 2020-2034 |
| Base Year | 2025 |
| Estimated Year | 2026 |
| Forecast Period | 2026-2034 |
| Historical Period | 2020-2025 |
| Growth Rate | CAGR of 23.9% from 2020-2034 |
| Segmentation |
|
Table of Contents
- 1. Introduction
- 1.1. Research Scope
- 1.2. Market Segmentation
- 1.3. Research Objective
- 1.4. Definitions and Assumptions
- 2. Executive Summary
- 2.1. Market Snapshot
- 3. Market Dynamics
- 3.1. Market Drivers
- 3.2. Market Restrains
- 3.3. Market Trends
- 3.4. Market Opportunities
- 4. Market Factor Analysis
- 4.1. Porters Five Forces
- 4.1.1. Bargaining Power of Suppliers
- 4.1.2. Bargaining Power of Buyers
- 4.1.3. Threat of New Entrants
- 4.1.4. Threat of Substitutes
- 4.1.5. Competitive Rivalry
- 4.2. PESTEL analysis
- 4.3. BCG Analysis
- 4.3.1. Stars (High Growth, High Market Share)
- 4.3.2. Cash Cows (Low Growth, High Market Share)
- 4.3.3. Question Mark (High Growth, Low Market Share)
- 4.3.4. Dogs (Low Growth, Low Market Share)
- 4.4. Ansoff Matrix Analysis
- 4.5. Supply Chain Analysis
- 4.6. Regulatory Landscape
- 4.7. Current Market Potential and Opportunity Assessment (TAM–SAM–SOM Framework)
- 4.8. DMV Analyst Note
- 4.1. Porters Five Forces
- 5. Market Analysis, Insights and Forecast 2021-2033
- 5.1. Market Analysis, Insights and Forecast - by Application
- 5.1.1. Entertainment
- 5.1.2. Education
- 5.2. Market Analysis, Insights and Forecast - by Types
- 5.2.1. FDM (Fused Deposition Modeling)
- 5.2.2. SLA (Stereolithography)
- 5.2.3. SLS (Selective Laser Sintering)
- 5.3. Market Analysis, Insights and Forecast - by Region
- 5.3.1. North America
- 5.3.2. South America
- 5.3.3. Europe
- 5.3.4. Middle East & Africa
- 5.3.5. Asia Pacific
- 5.1. Market Analysis, Insights and Forecast - by Application
- 6. Global Home 3D Printing Equipment Analysis, Insights and Forecast, 2021-2033
- 6.1. Market Analysis, Insights and Forecast - by Application
- 6.1.1. Entertainment
- 6.1.2. Education
- 6.2. Market Analysis, Insights and Forecast - by Types
- 6.2.1. FDM (Fused Deposition Modeling)
- 6.2.2. SLA (Stereolithography)
- 6.2.3. SLS (Selective Laser Sintering)
- 6.1. Market Analysis, Insights and Forecast - by Application
- 7. North America Home 3D Printing Equipment Analysis, Insights and Forecast, 2020-2032
- 7.1. Market Analysis, Insights and Forecast - by Application
- 7.1.1. Entertainment
- 7.1.2. Education
- 7.2. Market Analysis, Insights and Forecast - by Types
- 7.2.1. FDM (Fused Deposition Modeling)
- 7.2.2. SLA (Stereolithography)
- 7.2.3. SLS (Selective Laser Sintering)
- 7.1. Market Analysis, Insights and Forecast - by Application
- 8. South America Home 3D Printing Equipment Analysis, Insights and Forecast, 2020-2032
- 8.1. Market Analysis, Insights and Forecast - by Application
- 8.1.1. Entertainment
- 8.1.2. Education
- 8.2. Market Analysis, Insights and Forecast - by Types
- 8.2.1. FDM (Fused Deposition Modeling)
- 8.2.2. SLA (Stereolithography)
- 8.2.3. SLS (Selective Laser Sintering)
- 8.1. Market Analysis, Insights and Forecast - by Application
- 9. Europe Home 3D Printing Equipment Analysis, Insights and Forecast, 2020-2032
- 9.1. Market Analysis, Insights and Forecast - by Application
- 9.1.1. Entertainment
- 9.1.2. Education
- 9.2. Market Analysis, Insights and Forecast - by Types
- 9.2.1. FDM (Fused Deposition Modeling)
- 9.2.2. SLA (Stereolithography)
- 9.2.3. SLS (Selective Laser Sintering)
- 9.1. Market Analysis, Insights and Forecast - by Application
- 10. Middle East & Africa Home 3D Printing Equipment Analysis, Insights and Forecast, 2020-2032
- 10.1. Market Analysis, Insights and Forecast - by Application
- 10.1.1. Entertainment
- 10.1.2. Education
- 10.2. Market Analysis, Insights and Forecast - by Types
- 10.2.1. FDM (Fused Deposition Modeling)
- 10.2.2. SLA (Stereolithography)
- 10.2.3. SLS (Selective Laser Sintering)
- 10.1. Market Analysis, Insights and Forecast - by Application
- 11. Asia Pacific Home 3D Printing Equipment Analysis, Insights and Forecast, 2020-2032
- 11.1. Market Analysis, Insights and Forecast - by Application
- 11.1.1. Entertainment
- 11.1.2. Education
- 11.2. Market Analysis, Insights and Forecast - by Types
- 11.2.1. FDM (Fused Deposition Modeling)
- 11.2.2. SLA (Stereolithography)
- 11.2.3. SLS (Selective Laser Sintering)
- 11.1. Market Analysis, Insights and Forecast - by Application
- 12. Competitive Analysis
- 12.1. Company Profiles
- 12.1.1 Stratasys
- 12.1.1.1. Company Overview
- 12.1.1.2. Products
- 12.1.1.3. Company Financials
- 12.1.1.4. SWOT Analysis
- 12.1.2 3D Systems
- 12.1.2.1. Company Overview
- 12.1.2.2. Products
- 12.1.2.3. Company Financials
- 12.1.2.4. SWOT Analysis
- 12.1.3 Materialise
- 12.1.3.1. Company Overview
- 12.1.3.2. Products
- 12.1.3.3. Company Financials
- 12.1.3.4. SWOT Analysis
- 12.1.4 EOS
- 12.1.4.1. Company Overview
- 12.1.4.2. Products
- 12.1.4.3. Company Financials
- 12.1.4.4. SWOT Analysis
- 12.1.5 Ultimaker
- 12.1.5.1. Company Overview
- 12.1.5.2. Products
- 12.1.5.3. Company Financials
- 12.1.5.4. SWOT Analysis
- 12.1.6 Prusa Research
- 12.1.6.1. Company Overview
- 12.1.6.2. Products
- 12.1.6.3. Company Financials
- 12.1.6.4. SWOT Analysis
- 12.1.7 Formlabs
- 12.1.7.1. Company Overview
- 12.1.7.2. Products
- 12.1.7.3. Company Financials
- 12.1.7.4. SWOT Analysis
- 12.1.8 MakerBot
- 12.1.8.1. Company Overview
- 12.1.8.2. Products
- 12.1.8.3. Company Financials
- 12.1.8.4. SWOT Analysis
- 12.1.9 XYZprinting
- 12.1.9.1. Company Overview
- 12.1.9.2. Products
- 12.1.9.3. Company Financials
- 12.1.9.4. SWOT Analysis
- 12.1.10 LulzBot
- 12.1.10.1. Company Overview
- 12.1.10.2. Products
- 12.1.10.3. Company Financials
- 12.1.10.4. SWOT Analysis
- 12.1.1 Stratasys
- 12.2. Market Entropy
- 12.2.1 Company's Key Areas Served
- 12.2.2 Recent Developments
- 12.3. Company Market Share Analysis 2025
- 12.3.1 Top 5 Companies Market Share Analysis
- 12.3.2 Top 3 Companies Market Share Analysis
- 12.4. List of Potential Customers
- 13. Research Methodology
List of Figures
- Figure 1: Global Home 3D Printing Equipment Revenue Breakdown (undefined, %) by Region 2025 & 2033
- Figure 2: North America Home 3D Printing Equipment Revenue (undefined), by Application 2025 & 2033
- Figure 3: North America Home 3D Printing Equipment Revenue Share (%), by Application 2025 & 2033
- Figure 4: North America Home 3D Printing Equipment Revenue (undefined), by Types 2025 & 2033
- Figure 5: North America Home 3D Printing Equipment Revenue Share (%), by Types 2025 & 2033
- Figure 6: North America Home 3D Printing Equipment Revenue (undefined), by Country 2025 & 2033
- Figure 7: North America Home 3D Printing Equipment Revenue Share (%), by Country 2025 & 2033
- Figure 8: South America Home 3D Printing Equipment Revenue (undefined), by Application 2025 & 2033
- Figure 9: South America Home 3D Printing Equipment Revenue Share (%), by Application 2025 & 2033
- Figure 10: South America Home 3D Printing Equipment Revenue (undefined), by Types 2025 & 2033
- Figure 11: South America Home 3D Printing Equipment Revenue Share (%), by Types 2025 & 2033
- Figure 12: South America Home 3D Printing Equipment Revenue (undefined), by Country 2025 & 2033
- Figure 13: South America Home 3D Printing Equipment Revenue Share (%), by Country 2025 & 2033
- Figure 14: Europe Home 3D Printing Equipment Revenue (undefined), by Application 2025 & 2033
- Figure 15: Europe Home 3D Printing Equipment Revenue Share (%), by Application 2025 & 2033
- Figure 16: Europe Home 3D Printing Equipment Revenue (undefined), by Types 2025 & 2033
- Figure 17: Europe Home 3D Printing Equipment Revenue Share (%), by Types 2025 & 2033
- Figure 18: Europe Home 3D Printing Equipment Revenue (undefined), by Country 2025 & 2033
- Figure 19: Europe Home 3D Printing Equipment Revenue Share (%), by Country 2025 & 2033
- Figure 20: Middle East & Africa Home 3D Printing Equipment Revenue (undefined), by Application 2025 & 2033
- Figure 21: Middle East & Africa Home 3D Printing Equipment Revenue Share (%), by Application 2025 & 2033
- Figure 22: Middle East & Africa Home 3D Printing Equipment Revenue (undefined), by Types 2025 & 2033
- Figure 23: Middle East & Africa Home 3D Printing Equipment Revenue Share (%), by Types 2025 & 2033
- Figure 24: Middle East & Africa Home 3D Printing Equipment Revenue (undefined), by Country 2025 & 2033
- Figure 25: Middle East & Africa Home 3D Printing Equipment Revenue Share (%), by Country 2025 & 2033
- Figure 26: Asia Pacific Home 3D Printing Equipment Revenue (undefined), by Application 2025 & 2033
- Figure 27: Asia Pacific Home 3D Printing Equipment Revenue Share (%), by Application 2025 & 2033
- Figure 28: Asia Pacific Home 3D Printing Equipment Revenue (undefined), by Types 2025 & 2033
- Figure 29: Asia Pacific Home 3D Printing Equipment Revenue Share (%), by Types 2025 & 2033
- Figure 30: Asia Pacific Home 3D Printing Equipment Revenue (undefined), by Country 2025 & 2033
- Figure 31: Asia Pacific Home 3D Printing Equipment Revenue Share (%), by Country 2025 & 2033
List of Tables
- Table 1: Global Home 3D Printing Equipment Revenue undefined Forecast, by Application 2020 & 2033
- Table 2: Global Home 3D Printing Equipment Revenue undefined Forecast, by Types 2020 & 2033
- Table 3: Global Home 3D Printing Equipment Revenue undefined Forecast, by Region 2020 & 2033
- Table 4: Global Home 3D Printing Equipment Revenue undefined Forecast, by Application 2020 & 2033
- Table 5: Global Home 3D Printing Equipment Revenue undefined Forecast, by Types 2020 & 2033
- Table 6: Global Home 3D Printing Equipment Revenue undefined Forecast, by Country 2020 & 2033
- Table 7: United States Home 3D Printing Equipment Revenue (undefined) Forecast, by Application 2020 & 2033
- Table 8: Canada Home 3D Printing Equipment Revenue (undefined) Forecast, by Application 2020 & 2033
- Table 9: Mexico Home 3D Printing Equipment Revenue (undefined) Forecast, by Application 2020 & 2033
- Table 10: Global Home 3D Printing Equipment Revenue undefined Forecast, by Application 2020 & 2033
- Table 11: Global Home 3D Printing Equipment Revenue undefined Forecast, by Types 2020 & 2033
- Table 12: Global Home 3D Printing Equipment Revenue undefined Forecast, by Country 2020 & 2033
- Table 13: Brazil Home 3D Printing Equipment Revenue (undefined) Forecast, by Application 2020 & 2033
- Table 14: Argentina Home 3D Printing Equipment Revenue (undefined) Forecast, by Application 2020 & 2033
- Table 15: Rest of South America Home 3D Printing Equipment Revenue (undefined) Forecast, by Application 2020 & 2033
- Table 16: Global Home 3D Printing Equipment Revenue undefined Forecast, by Application 2020 & 2033
- Table 17: Global Home 3D Printing Equipment Revenue undefined Forecast, by Types 2020 & 2033
- Table 18: Global Home 3D Printing Equipment Revenue undefined Forecast, by Country 2020 & 2033
- Table 19: United Kingdom Home 3D Printing Equipment Revenue (undefined) Forecast, by Application 2020 & 2033
- Table 20: Germany Home 3D Printing Equipment Revenue (undefined) Forecast, by Application 2020 & 2033
- Table 21: France Home 3D Printing Equipment Revenue (undefined) Forecast, by Application 2020 & 2033
- Table 22: Italy Home 3D Printing Equipment Revenue (undefined) Forecast, by Application 2020 & 2033
- Table 23: Spain Home 3D Printing Equipment Revenue (undefined) Forecast, by Application 2020 & 2033
- Table 24: Russia Home 3D Printing Equipment Revenue (undefined) Forecast, by Application 2020 & 2033
- Table 25: Benelux Home 3D Printing Equipment Revenue (undefined) Forecast, by Application 2020 & 2033
- Table 26: Nordics Home 3D Printing Equipment Revenue (undefined) Forecast, by Application 2020 & 2033
- Table 27: Rest of Europe Home 3D Printing Equipment Revenue (undefined) Forecast, by Application 2020 & 2033
- Table 28: Global Home 3D Printing Equipment Revenue undefined Forecast, by Application 2020 & 2033
- Table 29: Global Home 3D Printing Equipment Revenue undefined Forecast, by Types 2020 & 2033
- Table 30: Global Home 3D Printing Equipment Revenue undefined Forecast, by Country 2020 & 2033
- Table 31: Turkey Home 3D Printing Equipment Revenue (undefined) Forecast, by Application 2020 & 2033
- Table 32: Israel Home 3D Printing Equipment Revenue (undefined) Forecast, by Application 2020 & 2033
- Table 33: GCC Home 3D Printing Equipment Revenue (undefined) Forecast, by Application 2020 & 2033
- Table 34: North Africa Home 3D Printing Equipment Revenue (undefined) Forecast, by Application 2020 & 2033
- Table 35: South Africa Home 3D Printing Equipment Revenue (undefined) Forecast, by Application 2020 & 2033
- Table 36: Rest of Middle East & Africa Home 3D Printing Equipment Revenue (undefined) Forecast, by Application 2020 & 2033
- Table 37: Global Home 3D Printing Equipment Revenue undefined Forecast, by Application 2020 & 2033
- Table 38: Global Home 3D Printing Equipment Revenue undefined Forecast, by Types 2020 & 2033
- Table 39: Global Home 3D Printing Equipment Revenue undefined Forecast, by Country 2020 & 2033
- Table 40: China Home 3D Printing Equipment Revenue (undefined) Forecast, by Application 2020 & 2033
- Table 41: India Home 3D Printing Equipment Revenue (undefined) Forecast, by Application 2020 & 2033
- Table 42: Japan Home 3D Printing Equipment Revenue (undefined) Forecast, by Application 2020 & 2033
- Table 43: South Korea Home 3D Printing Equipment Revenue (undefined) Forecast, by Application 2020 & 2033
- Table 44: ASEAN Home 3D Printing Equipment Revenue (undefined) Forecast, by Application 2020 & 2033
- Table 45: Oceania Home 3D Printing Equipment Revenue (undefined) Forecast, by Application 2020 & 2033
- Table 46: Rest of Asia Pacific Home 3D Printing Equipment Revenue (undefined) Forecast, by Application 2020 & 2033
Frequently Asked Questions
1. What is the projected Compound Annual Growth Rate (CAGR) of the Home 3D Printing Equipment?
The projected CAGR is approximately 23.9%.
2. Which companies are prominent players in the Home 3D Printing Equipment?
Key companies in the market include Stratasys, 3D Systems, Materialise, EOS, Ultimaker, Prusa Research, Formlabs, MakerBot, XYZprinting, LulzBot.
3. What are the main segments of the Home 3D Printing Equipment?
The market segments include Application, Types.
4. Can you provide details about the market size?
The market size is estimated to be USD XXX N/A as of 2022.
5. What are some drivers contributing to market growth?
N/A
6. What are the notable trends driving market growth?
N/A
7. Are there any restraints impacting market growth?
N/A
8. Can you provide examples of recent developments in the market?
N/A
9. What pricing options are available for accessing the report?
Pricing options include single-user, multi-user, and enterprise licenses priced at USD 4900.00, USD 7350.00, and USD 9800.00 respectively.
10. Is the market size provided in terms of value or volume?
The market size is provided in terms of value, measured in N/A.
11. Are there any specific market keywords associated with the report?
Yes, the market keyword associated with the report is "Home 3D Printing Equipment," which aids in identifying and referencing the specific market segment covered.
12. How do I determine which pricing option suits my needs best?
The pricing options vary based on user requirements and access needs. Individual users may opt for single-user licenses, while businesses requiring broader access may choose multi-user or enterprise licenses for cost-effective access to the report.
13. Are there any additional resources or data provided in the Home 3D Printing Equipment report?
While the report offers comprehensive insights, it's advisable to review the specific contents or supplementary materials provided to ascertain if additional resources or data are available.
14. How can I stay updated on further developments or reports in the Home 3D Printing Equipment?
To stay informed about further developments, trends, and reports in the Home 3D Printing Equipment, consider subscribing to industry newsletters, following relevant companies and organizations, or regularly checking reputable industry news sources and publications.
Methodology
Step 1 - Identification of Relevant Samples Size from Population Database


Step 2 - Approaches for Defining Global Market Size (Value, Volume* & Price*)

Note*: In applicable scenarios
Step 3 - Data Sources
Primary Research
- Web Analytics
- Survey Reports
- Research Institute
- Latest Research Reports
- Opinion Leaders
Secondary Research
- Annual Reports
- White Paper
- Latest Press Release
- Industry Association
- Paid Database
- Investor Presentations

Step 4 - Data Triangulation
Involves using different sources of information in order to increase the validity of a study
These sources are likely to be stakeholders in a program - participants, other researchers, program staff, other community members, and so on.
Then we put all data in single framework & apply various statistical tools to find out the dynamic on the market.
During the analysis stage, feedback from the stakeholder groups would be compared to determine areas of agreement as well as areas of divergence