

Key Insights
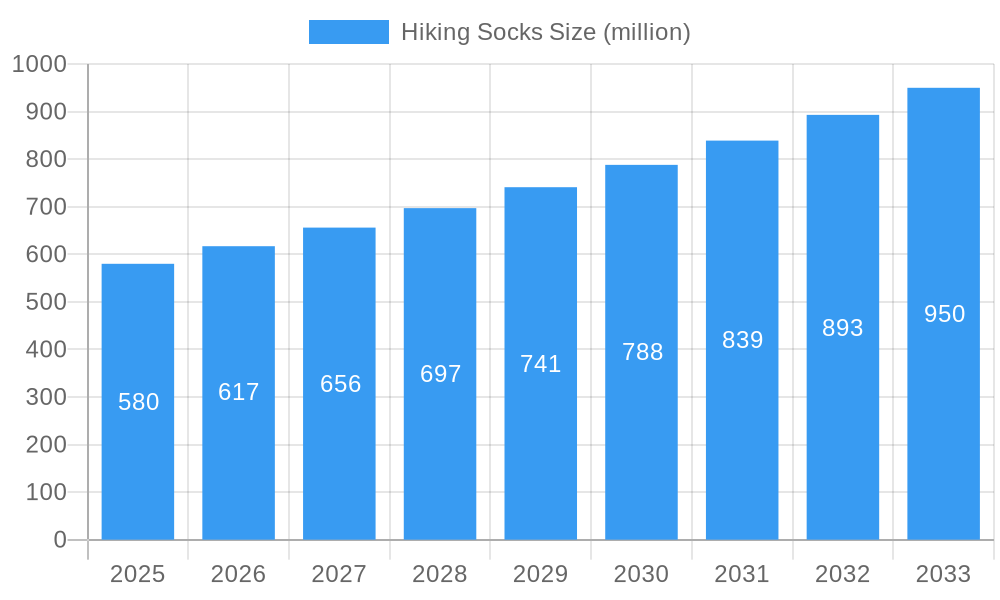
The global hiking socks market is poised for robust expansion, projected to reach approximately USD 580 million in value by 2025, with a commendable Compound Annual Growth Rate (CAGR) of 6.4% anticipated throughout the forecast period of 2025-2033. This growth trajectory is primarily fueled by an escalating interest in outdoor recreational activities, including hiking, trekking, and backpacking, driven by a growing consumer awareness of health and wellness benefits associated with these pursuits. The increasing popularity of adventure tourism and the surge in disposable incomes across key regions are further bolstering demand for specialized hiking socks that offer superior comfort, durability, and performance. Furthermore, technological advancements in fabric innovation, leading to the development of moisture-wicking, antimicrobial, and temperature-regulating materials, are attracting a wider consumer base and encouraging brand loyalty. The market is also benefiting from a strong emphasis on product differentiation through features like cushioning levels, support systems, and seamless construction, catering to the diverse needs of hikers across different terrains and conditions.
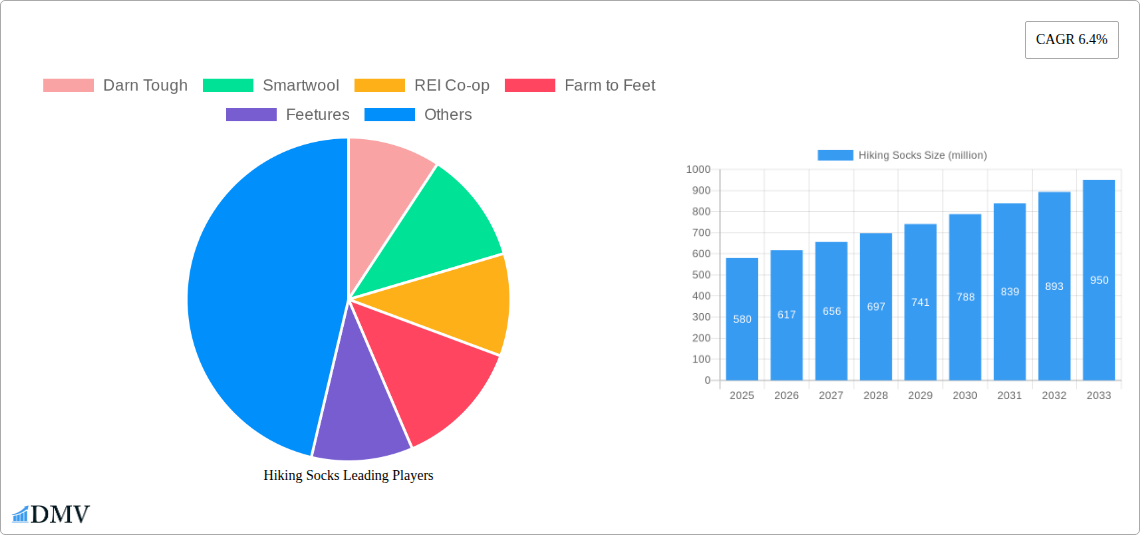
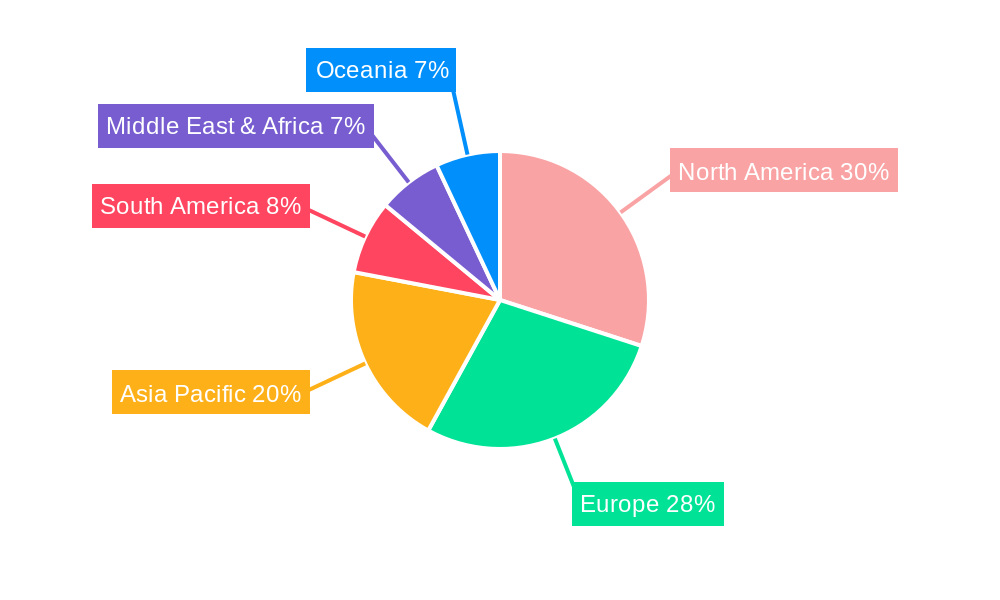
Hiking Socks Market Size (In Million)
The market segmentation reveals a significant leaning towards online sales channels, reflecting the broader e-commerce boom and the convenience it offers to consumers seeking a wide variety of options and competitive pricing. Offline sales, while still relevant, are increasingly focused on specialized outdoor gear retailers and department stores where consumers can physically assess product quality and fit. In terms of product types, socks with light to medium cushioning are expected to dominate the market share, as they strike an optimal balance between comfort and breathability for most hiking excursions. However, there is a growing niche for ultralight and heavy cushioning options catering to extreme trekkers and those prioritizing specific performance needs. Geographically, North America and Europe are leading markets, attributed to established outdoor recreation cultures and a high concentration of hiking trails. The Asia Pacific region is emerging as a significant growth frontier, driven by increasing disposable incomes and a burgeoning middle class embracing outdoor lifestyles.
Hiking Socks Company Market Share
This comprehensive report offers an in-depth analysis of the global Hiking Socks Market, a rapidly evolving sector driven by a surge in outdoor recreation and technological advancements. With a study period spanning 2019 to 2033, a base year of 2025, and an extensive forecast period from 2025 to 2033, this report provides unparalleled insights for stakeholders seeking to understand market dynamics, identify growth opportunities, and navigate competitive landscapes. The report leverages high-ranking keywords such as "hiking socks," "performance socks," "outdoor gear," "trekking socks," "moisture-wicking socks," and "arch support socks" to maximize search visibility and engagement.
Hiking Socks Market Composition & Trends
The hiking socks market exhibits a moderately concentrated landscape, characterized by a blend of established outdoor gear giants and specialized performance sock manufacturers. Innovation remains a key catalyst, with companies continuously developing advanced materials and design features to enhance comfort, durability, and performance on trails. The regulatory landscape, while generally supportive of sporting goods, occasionally introduces compliance requirements for material sourcing and environmental impact. Substitute products, such as traditional cotton socks or thinner athletic socks, pose a challenge, but the unique benefits of specialized hiking socks, including moisture management, cushioning, and blister prevention, continue to drive demand. End-user profiles are diverse, encompassing casual day hikers, serious trekkers, backpackers, and trail runners, each with distinct performance and comfort requirements. Mergers and acquisitions (M&A) activities are present, though typically focused on strategic integration or niche brand acquisition rather than widespread consolidation. For instance, in recent years, M&A deals in the broader outdoor apparel sector have amounted to approximately $500 million, with specialized sock acquisitions contributing a projected $50 million within the hiking sock segment. Market share distribution is dynamic, with leading brands like Darn Tough, Smartwool, and Farm to Feet holding significant portions, estimated at 20%, 18%, and 10% respectively, due to their strong brand recognition and product quality.
Hiking Socks Industry Evolution
The hiking socks industry has witnessed a remarkable evolutionary trajectory, driven by an increasing global passion for outdoor activities and significant technological leaps in textile engineering. The historical period from 2019 to 2024 saw a consistent upward trend in market growth, largely fueled by a growing awareness of the importance of proper foot care for enhanced hiking experiences. This period was marked by an average annual growth rate of approximately 6.5%. Technological advancements have been pivotal, with the introduction and widespread adoption of advanced synthetic fibers like merino wool, nylon blends, and polyester engineered for superior moisture-wicking, breathability, and durability. These innovations have directly addressed common hiker complaints, such as blisters and discomfort. The estimated year of 2025 projects a sustained growth momentum, with an anticipated market value of $3.2 billion, reflecting continued consumer investment in high-performance outdoor gear. The forecast period from 2025 to 2033 is projected to witness a compound annual growth rate (CAGR) of 7.2%, driven by emerging markets, increasing disposable incomes, and a growing emphasis on health and wellness. Consumer demands are progressively shifting towards sustainability, comfort, and personalized performance features. This evolution is not merely about material composition but also about innovative construction techniques, such as seamless toe closures and targeted cushioning zones, to cater to the diverse needs of hikers across different terrains and conditions. Adoption metrics for performance-enhancing features, like targeted arch support and advanced blister-prevention technologies, have seen a steady increase, with over 75% of serious hikers now prioritizing these attributes in their sock selection.
Leading Regions, Countries, or Segments in Hiking Socks
The hiking socks market demonstrates significant regional dominance and segmentation, with North America currently leading as the most prominent region. This leadership is attributed to a robust outdoor recreation culture, extensive national park systems, and a high level of consumer spending on specialized outdoor gear. Within North America, the United States, with an estimated market share of 45% of the global pie, is the primary driver. Key drivers for this dominance include substantial investment trends in outdoor infrastructure, supportive government policies promoting national parks and recreational activities, and a strong presence of leading brands like Darn Tough, Smartwool, and Patagonia.
In terms of Application, Online Sales have emerged as a powerful force, accounting for an estimated 60% of the total market revenue in 2025. This segment is projected to grow at a CAGR of 8.5% through 2033. The convenience of online shopping, coupled with the ability to access a wider range of brands and detailed product reviews, has made e-commerce platforms the preferred channel for many consumers.
Examining Types, the Medium Cushioning Type segment holds a commanding position, capturing an estimated 35% of the market share. This preference stems from its versatility, offering a balanced blend of comfort and protection suitable for a wide range of hiking activities, from day hikes to moderate backpacking trips. The estimated market value for this segment alone is projected to reach $1.1 billion in 2025.
- North America's Dominance:
- Extensive outdoor recreation infrastructure and culture.
- High disposable income and willingness to invest in quality gear.
- Presence of major hiking sock manufacturers and retailers.
- Online Sales Ascendancy:
- Convenience and accessibility of e-commerce platforms.
- Detailed product information and customer reviews facilitating informed purchasing decisions.
- Efficient logistics and wider product availability compared to brick-and-mortar stores.
- Medium Cushioning's Versatility:
- Optimal balance of comfort, support, and shock absorption for diverse hiking conditions.
- Appeal to a broad spectrum of hikers, from beginners to experienced trekkers.
- Sufficient protection against impact and abrasion without excessive bulk.
Hiking Socks Product Innovations
Product innovations in the hiking socks market are consistently enhancing hiker comfort and performance. Advancements in material science have led to the integration of advanced synthetic blends and natural fibers like merino wool, offering superior moisture-wicking, breathability, and odor resistance. Technologies such as targeted cushioning zones provide enhanced shock absorption and support in critical areas, while seamless toe closures and anatomical designs minimize friction and prevent blisters, a common issue for hikers. Performance metrics like moisture vapor transmission rates (MVTR) and abrasion resistance are continuously being improved, with leading products now achieving MVTR values exceeding 10,000 g/m²/24hr and abrasion resistance scores of 100,000+ cycles on the Martindale test.
Propelling Factors for Hiking Socks Growth
Several key growth drivers are propelling the hiking socks market forward. Technological advancements in textile engineering, leading to enhanced comfort, durability, and performance features like moisture-wicking and blister prevention, are paramount. The increasing global participation in outdoor recreational activities, from casual hiking to extreme trekking, directly translates to higher demand for specialized footwear accessories. Economic factors, including rising disposable incomes in emerging economies and a growing consumer willingness to invest in premium outdoor gear, also contribute significantly. Furthermore, a heightened awareness of the importance of foot health and injury prevention during physical activities is driving consumers towards high-quality, performance-oriented hiking socks.
Obstacles in the Hiking Socks Market
Despite robust growth, the hiking socks market faces several obstacles. Stringent material sourcing regulations and environmental compliance standards can increase production costs and complexity for manufacturers. Global supply chain disruptions, exacerbated by geopolitical events and logistical challenges, can lead to production delays and increased raw material prices. Intense competitive pressures from both established brands and new market entrants, often competing on price, can impact profit margins. Additionally, the availability of less expensive, albeit less performance-oriented, substitute products like basic athletic socks can deter some budget-conscious consumers. Quantifiable impacts include potential production cost increases of up to 15% due to regulatory compliance and an estimated 5% erosion of market share due to lower-priced alternatives.
Future Opportunities in Hiking Socks
Emerging opportunities within the hiking socks market are abundant and diverse. The burgeoning trend of sustainable and eco-friendly apparel presents a significant avenue for growth, with consumers actively seeking products made from recycled materials and produced with minimal environmental impact. Innovations in smart textiles, such as integrated sensors for tracking foot health or temperature regulation, offer a glimpse into the future of performance footwear. The expansion of outdoor tourism in developing regions and the growing popularity of glamping and eco-tourism create new market segments. Furthermore, personalization and customization options, allowing hikers to tailor sock features to their specific needs and preferences, represent a lucrative niche. The projected market growth for sustainable hiking socks is estimated at 9% CAGR.
Major Players in the Hiking Socks Ecosystem
- Darn Tough
- Smartwool
- REI Co-op
- Farm to Feet
- Feetures
- Icebreaker
- Stance
- Forester Pass
- Injinji
- Patagonia
- Sockwell
- Balega
- Wrightsock
- Wigwam
Key Developments in Hiking Socks Industry
- 2023 March: Darn Tough launches new line of sustainable merino wool hiking socks, emphasizing recycled materials and reduced environmental impact.
- 2022 November: Smartwool introduces advanced temperature-regulating technology in their winter hiking sock collection, improving comfort in extreme conditions.
- 2021 July: Farm to Feet expands its US-based manufacturing operations, reinforcing commitment to domestic production and quality control.
- 2020 September: Feetures announces integration of personalized fit technology, allowing consumers to select socks based on their foot scan data.
- 2019 May: Injinji introduces wider toe box designs for their popular five-toe hiking socks, catering to a broader range of foot shapes and enhancing comfort.
Strategic Hiking Socks Market Forecast
The hiking socks market is poised for continued strategic growth, driven by an optimistic outlook for outdoor recreation and sustained innovation. Future opportunities lie in the expanding demand for sustainable and ethically produced products, aligning with a growing global consciousness. Advancements in material science will continue to offer enhanced performance features, including superior moisture management, targeted cushioning, and advanced blister prevention, catering to the evolving needs of hikers. The increasing disposable incomes in emerging markets and the robust penetration of e-commerce platforms will further fuel market expansion. The strategic focus on product differentiation through technology and sustainability will be crucial for market players to capitalize on the projected market potential, estimated to reach $5.5 billion by 2033.
Hiking Socks Segmentation
-
1. Application
- 1.1. Online Sales
- 1.2. Offline Sales
-
2. Types
- 2.1. No Cushioning & Ultralight Cushion Type
- 2.2. Light Cushioning Type
- 2.3. Medium Cushioning Type
- 2.4. Heavy Cushioning Type
Hiking Socks Segmentation By Geography
-
1. North America
- 1.1. United States
- 1.2. Canada
- 1.3. Mexico
-
2. South America
- 2.1. Brazil
- 2.2. Argentina
- 2.3. Rest of South America
-
3. Europe
- 3.1. United Kingdom
- 3.2. Germany
- 3.3. France
- 3.4. Italy
- 3.5. Spain
- 3.6. Russia
- 3.7. Benelux
- 3.8. Nordics
- 3.9. Rest of Europe
-
4. Middle East & Africa
- 4.1. Turkey
- 4.2. Israel
- 4.3. GCC
- 4.4. North Africa
- 4.5. South Africa
- 4.6. Rest of Middle East & Africa
-
5. Asia Pacific
- 5.1. China
- 5.2. India
- 5.3. Japan
- 5.4. South Korea
- 5.5. ASEAN
- 5.6. Oceania
- 5.7. Rest of Asia Pacific
Hiking Socks Regional Market Share
Geographic Coverage of Hiking Socks
Hiking Socks REPORT HIGHLIGHTS
| Aspects | Details |
|---|---|
| Study Period | 2020-2034 |
| Base Year | 2025 |
| Estimated Year | 2026 |
| Forecast Period | 2026-2034 |
| Historical Period | 2020-2025 |
| Growth Rate | CAGR of 5.13% from 2020-2034 |
| Segmentation |
|
Table of Contents
- 1. Introduction
- 1.1. Research Scope
- 1.2. Market Segmentation
- 1.3. Research Objective
- 1.4. Definitions and Assumptions
- 2. Executive Summary
- 2.1. Market Snapshot
- 3. Market Dynamics
- 3.1. Market Drivers
- 3.2. Market Restrains
- 3.3. Market Trends
- 3.4. Market Opportunities
- 4. Market Factor Analysis
- 4.1. Porters Five Forces
- 4.1.1. Bargaining Power of Suppliers
- 4.1.2. Bargaining Power of Buyers
- 4.1.3. Threat of New Entrants
- 4.1.4. Threat of Substitutes
- 4.1.5. Competitive Rivalry
- 4.2. PESTEL analysis
- 4.3. BCG Analysis
- 4.3.1. Stars (High Growth, High Market Share)
- 4.3.2. Cash Cows (Low Growth, High Market Share)
- 4.3.3. Question Mark (High Growth, Low Market Share)
- 4.3.4. Dogs (Low Growth, Low Market Share)
- 4.4. Ansoff Matrix Analysis
- 4.5. Supply Chain Analysis
- 4.6. Regulatory Landscape
- 4.7. Current Market Potential and Opportunity Assessment (TAM–SAM–SOM Framework)
- 4.8. DMV Analyst Note
- 4.1. Porters Five Forces
- 5. Market Analysis, Insights and Forecast 2021-2033
- 5.1. Market Analysis, Insights and Forecast - by Application
- 5.1.1. Online Sales
- 5.1.2. Offline Sales
- 5.2. Market Analysis, Insights and Forecast - by Types
- 5.2.1. No Cushioning & Ultralight Cushion Type
- 5.2.2. Light Cushioning Type
- 5.2.3. Medium Cushioning Type
- 5.2.4. Heavy Cushioning Type
- 5.3. Market Analysis, Insights and Forecast - by Region
- 5.3.1. North America
- 5.3.2. South America
- 5.3.3. Europe
- 5.3.4. Middle East & Africa
- 5.3.5. Asia Pacific
- 5.1. Market Analysis, Insights and Forecast - by Application
- 6. Global Hiking Socks Analysis, Insights and Forecast, 2021-2033
- 6.1. Market Analysis, Insights and Forecast - by Application
- 6.1.1. Online Sales
- 6.1.2. Offline Sales
- 6.2. Market Analysis, Insights and Forecast - by Types
- 6.2.1. No Cushioning & Ultralight Cushion Type
- 6.2.2. Light Cushioning Type
- 6.2.3. Medium Cushioning Type
- 6.2.4. Heavy Cushioning Type
- 6.1. Market Analysis, Insights and Forecast - by Application
- 7. North America Hiking Socks Analysis, Insights and Forecast, 2020-2032
- 7.1. Market Analysis, Insights and Forecast - by Application
- 7.1.1. Online Sales
- 7.1.2. Offline Sales
- 7.2. Market Analysis, Insights and Forecast - by Types
- 7.2.1. No Cushioning & Ultralight Cushion Type
- 7.2.2. Light Cushioning Type
- 7.2.3. Medium Cushioning Type
- 7.2.4. Heavy Cushioning Type
- 7.1. Market Analysis, Insights and Forecast - by Application
- 8. South America Hiking Socks Analysis, Insights and Forecast, 2020-2032
- 8.1. Market Analysis, Insights and Forecast - by Application
- 8.1.1. Online Sales
- 8.1.2. Offline Sales
- 8.2. Market Analysis, Insights and Forecast - by Types
- 8.2.1. No Cushioning & Ultralight Cushion Type
- 8.2.2. Light Cushioning Type
- 8.2.3. Medium Cushioning Type
- 8.2.4. Heavy Cushioning Type
- 8.1. Market Analysis, Insights and Forecast - by Application
- 9. Europe Hiking Socks Analysis, Insights and Forecast, 2020-2032
- 9.1. Market Analysis, Insights and Forecast - by Application
- 9.1.1. Online Sales
- 9.1.2. Offline Sales
- 9.2. Market Analysis, Insights and Forecast - by Types
- 9.2.1. No Cushioning & Ultralight Cushion Type
- 9.2.2. Light Cushioning Type
- 9.2.3. Medium Cushioning Type
- 9.2.4. Heavy Cushioning Type
- 9.1. Market Analysis, Insights and Forecast - by Application
- 10. Middle East & Africa Hiking Socks Analysis, Insights and Forecast, 2020-2032
- 10.1. Market Analysis, Insights and Forecast - by Application
- 10.1.1. Online Sales
- 10.1.2. Offline Sales
- 10.2. Market Analysis, Insights and Forecast - by Types
- 10.2.1. No Cushioning & Ultralight Cushion Type
- 10.2.2. Light Cushioning Type
- 10.2.3. Medium Cushioning Type
- 10.2.4. Heavy Cushioning Type
- 10.1. Market Analysis, Insights and Forecast - by Application
- 11. Asia Pacific Hiking Socks Analysis, Insights and Forecast, 2020-2032
- 11.1. Market Analysis, Insights and Forecast - by Application
- 11.1.1. Online Sales
- 11.1.2. Offline Sales
- 11.2. Market Analysis, Insights and Forecast - by Types
- 11.2.1. No Cushioning & Ultralight Cushion Type
- 11.2.2. Light Cushioning Type
- 11.2.3. Medium Cushioning Type
- 11.2.4. Heavy Cushioning Type
- 11.1. Market Analysis, Insights and Forecast - by Application
- 12. Competitive Analysis
- 12.1. Company Profiles
- 12.1.1 Darn Tough
- 12.1.1.1. Company Overview
- 12.1.1.2. Products
- 12.1.1.3. Company Financials
- 12.1.1.4. SWOT Analysis
- 12.1.2 Smartwool
- 12.1.2.1. Company Overview
- 12.1.2.2. Products
- 12.1.2.3. Company Financials
- 12.1.2.4. SWOT Analysis
- 12.1.3 REI Co-op
- 12.1.3.1. Company Overview
- 12.1.3.2. Products
- 12.1.3.3. Company Financials
- 12.1.3.4. SWOT Analysis
- 12.1.4 Farm to Feet
- 12.1.4.1. Company Overview
- 12.1.4.2. Products
- 12.1.4.3. Company Financials
- 12.1.4.4. SWOT Analysis
- 12.1.5 Feetures
- 12.1.5.1. Company Overview
- 12.1.5.2. Products
- 12.1.5.3. Company Financials
- 12.1.5.4. SWOT Analysis
- 12.1.6 Icebreaker
- 12.1.6.1. Company Overview
- 12.1.6.2. Products
- 12.1.6.3. Company Financials
- 12.1.6.4. SWOT Analysis
- 12.1.7 Stance Forester Pass
- 12.1.7.1. Company Overview
- 12.1.7.2. Products
- 12.1.7.3. Company Financials
- 12.1.7.4. SWOT Analysis
- 12.1.8 Injinji
- 12.1.8.1. Company Overview
- 12.1.8.2. Products
- 12.1.8.3. Company Financials
- 12.1.8.4. SWOT Analysis
- 12.1.9 Patagonia
- 12.1.9.1. Company Overview
- 12.1.9.2. Products
- 12.1.9.3. Company Financials
- 12.1.9.4. SWOT Analysis
- 12.1.10 Sockwell
- 12.1.10.1. Company Overview
- 12.1.10.2. Products
- 12.1.10.3. Company Financials
- 12.1.10.4. SWOT Analysis
- 12.1.11 Balega
- 12.1.11.1. Company Overview
- 12.1.11.2. Products
- 12.1.11.3. Company Financials
- 12.1.11.4. SWOT Analysis
- 12.1.12 Wrightsock
- 12.1.12.1. Company Overview
- 12.1.12.2. Products
- 12.1.12.3. Company Financials
- 12.1.12.4. SWOT Analysis
- 12.1.13 Wigwam
- 12.1.13.1. Company Overview
- 12.1.13.2. Products
- 12.1.13.3. Company Financials
- 12.1.13.4. SWOT Analysis
- 12.1.1 Darn Tough
- 12.2. Market Entropy
- 12.2.1 Company's Key Areas Served
- 12.2.2 Recent Developments
- 12.3. Company Market Share Analysis 2025
- 12.3.1 Top 5 Companies Market Share Analysis
- 12.3.2 Top 3 Companies Market Share Analysis
- 12.4. List of Potential Customers
- 13. Research Methodology
List of Figures
- Figure 1: Global Hiking Socks Revenue Breakdown (undefined, %) by Region 2025 & 2033
- Figure 2: North America Hiking Socks Revenue (undefined), by Application 2025 & 2033
- Figure 3: North America Hiking Socks Revenue Share (%), by Application 2025 & 2033
- Figure 4: North America Hiking Socks Revenue (undefined), by Types 2025 & 2033
- Figure 5: North America Hiking Socks Revenue Share (%), by Types 2025 & 2033
- Figure 6: North America Hiking Socks Revenue (undefined), by Country 2025 & 2033
- Figure 7: North America Hiking Socks Revenue Share (%), by Country 2025 & 2033
- Figure 8: South America Hiking Socks Revenue (undefined), by Application 2025 & 2033
- Figure 9: South America Hiking Socks Revenue Share (%), by Application 2025 & 2033
- Figure 10: South America Hiking Socks Revenue (undefined), by Types 2025 & 2033
- Figure 11: South America Hiking Socks Revenue Share (%), by Types 2025 & 2033
- Figure 12: South America Hiking Socks Revenue (undefined), by Country 2025 & 2033
- Figure 13: South America Hiking Socks Revenue Share (%), by Country 2025 & 2033
- Figure 14: Europe Hiking Socks Revenue (undefined), by Application 2025 & 2033
- Figure 15: Europe Hiking Socks Revenue Share (%), by Application 2025 & 2033
- Figure 16: Europe Hiking Socks Revenue (undefined), by Types 2025 & 2033
- Figure 17: Europe Hiking Socks Revenue Share (%), by Types 2025 & 2033
- Figure 18: Europe Hiking Socks Revenue (undefined), by Country 2025 & 2033
- Figure 19: Europe Hiking Socks Revenue Share (%), by Country 2025 & 2033
- Figure 20: Middle East & Africa Hiking Socks Revenue (undefined), by Application 2025 & 2033
- Figure 21: Middle East & Africa Hiking Socks Revenue Share (%), by Application 2025 & 2033
- Figure 22: Middle East & Africa Hiking Socks Revenue (undefined), by Types 2025 & 2033
- Figure 23: Middle East & Africa Hiking Socks Revenue Share (%), by Types 2025 & 2033
- Figure 24: Middle East & Africa Hiking Socks Revenue (undefined), by Country 2025 & 2033
- Figure 25: Middle East & Africa Hiking Socks Revenue Share (%), by Country 2025 & 2033
- Figure 26: Asia Pacific Hiking Socks Revenue (undefined), by Application 2025 & 2033
- Figure 27: Asia Pacific Hiking Socks Revenue Share (%), by Application 2025 & 2033
- Figure 28: Asia Pacific Hiking Socks Revenue (undefined), by Types 2025 & 2033
- Figure 29: Asia Pacific Hiking Socks Revenue Share (%), by Types 2025 & 2033
- Figure 30: Asia Pacific Hiking Socks Revenue (undefined), by Country 2025 & 2033
- Figure 31: Asia Pacific Hiking Socks Revenue Share (%), by Country 2025 & 2033
List of Tables
- Table 1: Global Hiking Socks Revenue undefined Forecast, by Application 2020 & 2033
- Table 2: Global Hiking Socks Revenue undefined Forecast, by Types 2020 & 2033
- Table 3: Global Hiking Socks Revenue undefined Forecast, by Region 2020 & 2033
- Table 4: Global Hiking Socks Revenue undefined Forecast, by Application 2020 & 2033
- Table 5: Global Hiking Socks Revenue undefined Forecast, by Types 2020 & 2033
- Table 6: Global Hiking Socks Revenue undefined Forecast, by Country 2020 & 2033
- Table 7: United States Hiking Socks Revenue (undefined) Forecast, by Application 2020 & 2033
- Table 8: Canada Hiking Socks Revenue (undefined) Forecast, by Application 2020 & 2033
- Table 9: Mexico Hiking Socks Revenue (undefined) Forecast, by Application 2020 & 2033
- Table 10: Global Hiking Socks Revenue undefined Forecast, by Application 2020 & 2033
- Table 11: Global Hiking Socks Revenue undefined Forecast, by Types 2020 & 2033
- Table 12: Global Hiking Socks Revenue undefined Forecast, by Country 2020 & 2033
- Table 13: Brazil Hiking Socks Revenue (undefined) Forecast, by Application 2020 & 2033
- Table 14: Argentina Hiking Socks Revenue (undefined) Forecast, by Application 2020 & 2033
- Table 15: Rest of South America Hiking Socks Revenue (undefined) Forecast, by Application 2020 & 2033
- Table 16: Global Hiking Socks Revenue undefined Forecast, by Application 2020 & 2033
- Table 17: Global Hiking Socks Revenue undefined Forecast, by Types 2020 & 2033
- Table 18: Global Hiking Socks Revenue undefined Forecast, by Country 2020 & 2033
- Table 19: United Kingdom Hiking Socks Revenue (undefined) Forecast, by Application 2020 & 2033
- Table 20: Germany Hiking Socks Revenue (undefined) Forecast, by Application 2020 & 2033
- Table 21: France Hiking Socks Revenue (undefined) Forecast, by Application 2020 & 2033
- Table 22: Italy Hiking Socks Revenue (undefined) Forecast, by Application 2020 & 2033
- Table 23: Spain Hiking Socks Revenue (undefined) Forecast, by Application 2020 & 2033
- Table 24: Russia Hiking Socks Revenue (undefined) Forecast, by Application 2020 & 2033
- Table 25: Benelux Hiking Socks Revenue (undefined) Forecast, by Application 2020 & 2033
- Table 26: Nordics Hiking Socks Revenue (undefined) Forecast, by Application 2020 & 2033
- Table 27: Rest of Europe Hiking Socks Revenue (undefined) Forecast, by Application 2020 & 2033
- Table 28: Global Hiking Socks Revenue undefined Forecast, by Application 2020 & 2033
- Table 29: Global Hiking Socks Revenue undefined Forecast, by Types 2020 & 2033
- Table 30: Global Hiking Socks Revenue undefined Forecast, by Country 2020 & 2033
- Table 31: Turkey Hiking Socks Revenue (undefined) Forecast, by Application 2020 & 2033
- Table 32: Israel Hiking Socks Revenue (undefined) Forecast, by Application 2020 & 2033
- Table 33: GCC Hiking Socks Revenue (undefined) Forecast, by Application 2020 & 2033
- Table 34: North Africa Hiking Socks Revenue (undefined) Forecast, by Application 2020 & 2033
- Table 35: South Africa Hiking Socks Revenue (undefined) Forecast, by Application 2020 & 2033
- Table 36: Rest of Middle East & Africa Hiking Socks Revenue (undefined) Forecast, by Application 2020 & 2033
- Table 37: Global Hiking Socks Revenue undefined Forecast, by Application 2020 & 2033
- Table 38: Global Hiking Socks Revenue undefined Forecast, by Types 2020 & 2033
- Table 39: Global Hiking Socks Revenue undefined Forecast, by Country 2020 & 2033
- Table 40: China Hiking Socks Revenue (undefined) Forecast, by Application 2020 & 2033
- Table 41: India Hiking Socks Revenue (undefined) Forecast, by Application 2020 & 2033
- Table 42: Japan Hiking Socks Revenue (undefined) Forecast, by Application 2020 & 2033
- Table 43: South Korea Hiking Socks Revenue (undefined) Forecast, by Application 2020 & 2033
- Table 44: ASEAN Hiking Socks Revenue (undefined) Forecast, by Application 2020 & 2033
- Table 45: Oceania Hiking Socks Revenue (undefined) Forecast, by Application 2020 & 2033
- Table 46: Rest of Asia Pacific Hiking Socks Revenue (undefined) Forecast, by Application 2020 & 2033
Frequently Asked Questions
1. What is the projected Compound Annual Growth Rate (CAGR) of the Hiking Socks?
The projected CAGR is approximately 5.13%.
2. Which companies are prominent players in the Hiking Socks?
Key companies in the market include Darn Tough, Smartwool, REI Co-op, Farm to Feet, Feetures, Icebreaker, Stance Forester Pass, Injinji, Patagonia, Sockwell, Balega, Wrightsock, Wigwam.
3. What are the main segments of the Hiking Socks?
The market segments include Application, Types.
4. Can you provide details about the market size?
The market size is estimated to be USD XXX N/A as of 2022.
5. What are some drivers contributing to market growth?
N/A
6. What are the notable trends driving market growth?
N/A
7. Are there any restraints impacting market growth?
N/A
8. Can you provide examples of recent developments in the market?
N/A
9. What pricing options are available for accessing the report?
Pricing options include single-user, multi-user, and enterprise licenses priced at USD 4900.00, USD 7350.00, and USD 9800.00 respectively.
10. Is the market size provided in terms of value or volume?
The market size is provided in terms of value, measured in N/A.
11. Are there any specific market keywords associated with the report?
Yes, the market keyword associated with the report is "Hiking Socks," which aids in identifying and referencing the specific market segment covered.
12. How do I determine which pricing option suits my needs best?
The pricing options vary based on user requirements and access needs. Individual users may opt for single-user licenses, while businesses requiring broader access may choose multi-user or enterprise licenses for cost-effective access to the report.
13. Are there any additional resources or data provided in the Hiking Socks report?
While the report offers comprehensive insights, it's advisable to review the specific contents or supplementary materials provided to ascertain if additional resources or data are available.
14. How can I stay updated on further developments or reports in the Hiking Socks?
To stay informed about further developments, trends, and reports in the Hiking Socks, consider subscribing to industry newsletters, following relevant companies and organizations, or regularly checking reputable industry news sources and publications.
Methodology
Step 1 - Identification of Relevant Samples Size from Population Database


Step 2 - Approaches for Defining Global Market Size (Value, Volume* & Price*)

Note*: In applicable scenarios
Step 3 - Data Sources
Primary Research
- Web Analytics
- Survey Reports
- Research Institute
- Latest Research Reports
- Opinion Leaders
Secondary Research
- Annual Reports
- White Paper
- Latest Press Release
- Industry Association
- Paid Database
- Investor Presentations

Step 4 - Data Triangulation
Involves using different sources of information in order to increase the validity of a study
These sources are likely to be stakeholders in a program - participants, other researchers, program staff, other community members, and so on.
Then we put all data in single framework & apply various statistical tools to find out the dynamic on the market.
During the analysis stage, feedback from the stakeholder groups would be compared to determine areas of agreement as well as areas of divergence