

Key Insights
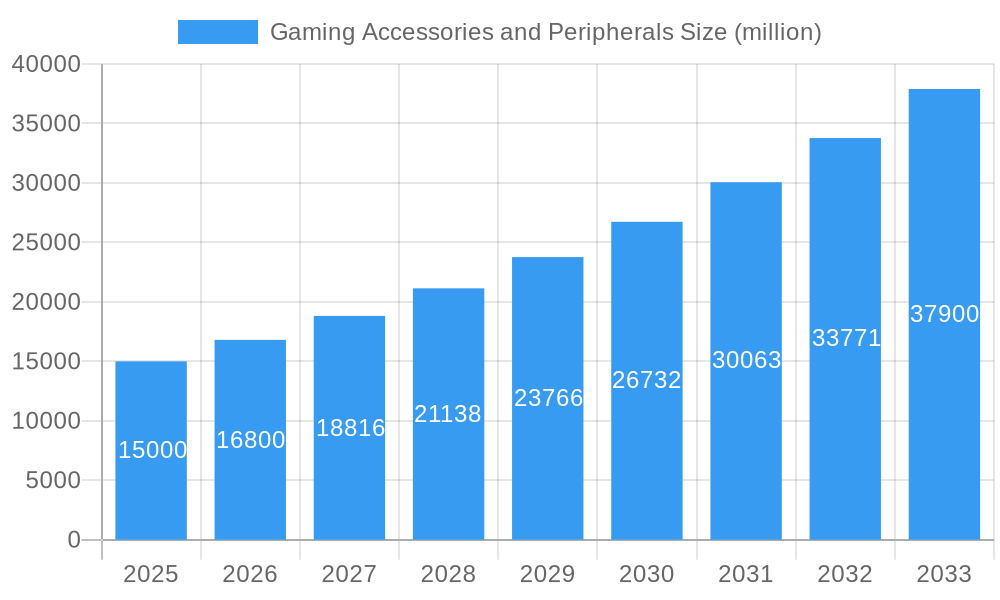
The gaming accessories and peripherals market is experiencing robust growth, driven by the increasing popularity of esports, the rise of cloud gaming, and the continued advancement of gaming technology. The market, estimated at $15 billion in 2025, is projected to witness a Compound Annual Growth Rate (CAGR) of 12% from 2025 to 2033, reaching approximately $40 billion by 2033. Key drivers include the demand for high-performance peripherals enhancing gameplay, the increasing adoption of virtual reality (VR) and augmented reality (AR) gaming, and the growing preference for personalized gaming setups. Emerging trends such as haptic feedback technology, advanced ergonomic designs, and integration with smart home ecosystems are shaping the market landscape. However, factors such as the high cost of premium accessories and the potential for market saturation in certain segments could act as restraints on overall growth. The market is segmented by product type (keyboards, mice, headsets, controllers, etc.), platform (PC, console, mobile), and price range, offering diverse opportunities for manufacturers. Leading players like Razer, Logitech G, and Corsair are leveraging innovation and brand recognition to maintain their market leadership, while smaller players focus on niche segments and specialized features.
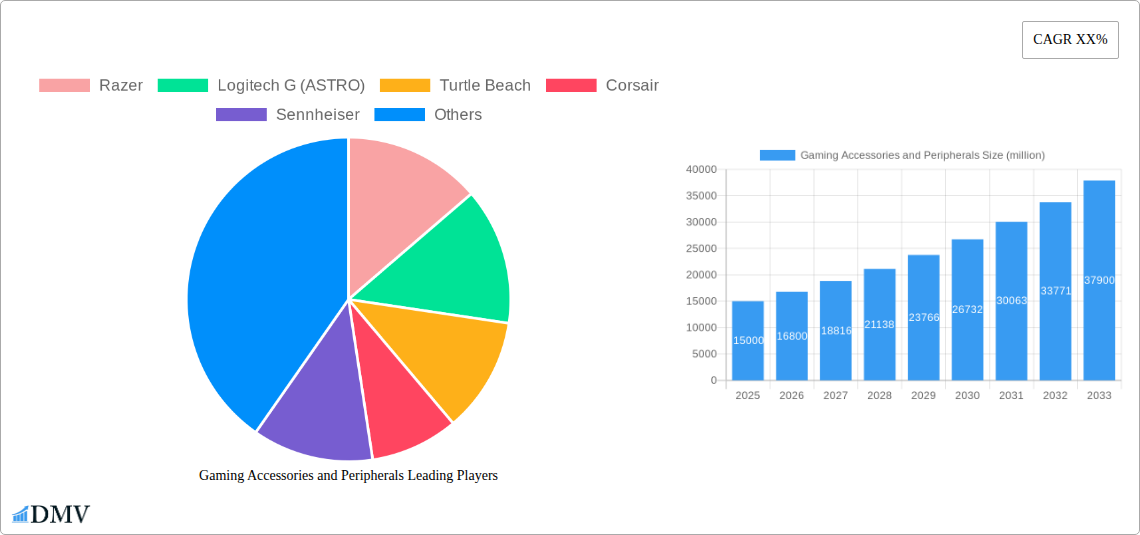
Gaming Accessories and Peripherals Market Size (In Billion)
The competitive landscape is characterized by intense innovation and marketing efforts, as companies strive to differentiate their offerings through technological advancements, improved ergonomics, and customized features. The growth is particularly noticeable in regions with a large and engaged gaming community, including North America, Europe, and Asia-Pacific. Strategic partnerships, mergers, and acquisitions are anticipated to reshape the competitive dynamics further. The increasing demand for customized gaming setups, incorporating peripherals and accessories designed for specific gaming genres, presents a significant opportunity for growth. The focus on sustainable and environmentally friendly manufacturing practices is also gaining traction, reflecting a growing consumer awareness and demand for responsible production.
Gaming Accessories and Peripherals Company Market Share
Gaming Accessories and Peripherals Market: A Comprehensive Report (2019-2033)
This insightful report delivers a comprehensive analysis of the global Gaming Accessories and Peripherals market, projecting a market value exceeding $XX million by 2033. Covering the historical period (2019-2024), base year (2025), and forecast period (2025-2033), this study provides crucial insights for stakeholders seeking to navigate this dynamic market. The report meticulously examines market composition, technological advancements, leading players, and future growth opportunities, empowering informed strategic decision-making.
Gaming Accessories and Peripherals Market Composition & Trends
This section analyzes the competitive landscape, evaluating market concentration, innovation drivers, regulatory factors, substitute products, end-user profiles, and merger & acquisition (M&A) activities within the gaming accessories and peripherals market. The report reveals a moderately concentrated market, with key players like Razer, Logitech G (ASTRO), and Corsair holding significant market share. Innovation in areas such as haptic feedback, advanced ergonomics, and AI-powered personalization are driving growth. Stringent regulatory compliance concerning product safety and data privacy presents both challenges and opportunities. Substitute products, such as mobile gaming, pose a competitive threat, while the growing esports industry fuels demand.
- Market Share Distribution (2025): Razer (XX%), Logitech G (ASTRO) (XX%), Corsair (XX%), Others (XX%). (Note: XX represents estimated percentages.)
- M&A Activity (2019-2024): A total of XX million USD in M&A deals were recorded during this period, signifying significant industry consolidation. Specific deal values are detailed within the full report.
- End-User Segmentation: This report details the diverse end-user segments, ranging from casual gamers to professional esports athletes, influencing product design and pricing strategies.
Gaming Accessories and Peripherals Industry Evolution
This in-depth analysis charts the evolution of the gaming accessories and peripherals market from 2019 to 2033, focusing on growth trajectories, technological breakthroughs, and evolving consumer preferences. The market experienced a Compound Annual Growth Rate (CAGR) of XX% during the historical period (2019-2024), driven primarily by the increasing popularity of esports, advancements in gaming technology (e.g., VR/AR integration), and rising disposable incomes in key markets. The report projects a CAGR of XX% during the forecast period (2025-2033). Key technological advancements such as improved sensor technology, wireless connectivity, and personalized customization options are reshaping consumer expectations.
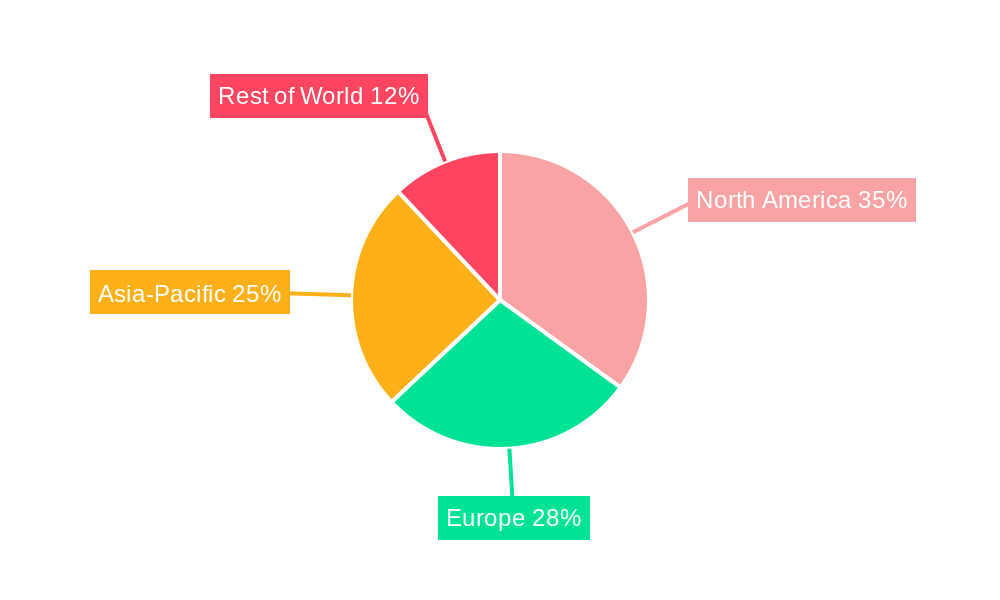
Leading Regions, Countries, or Segments in Gaming Accessories and Peripherals
North America currently dominates the gaming accessories and peripherals market, followed by Asia-Pacific and Europe. The report identifies key drivers behind this regional dominance:
- North America: Strong consumer spending on gaming, well-established esports culture, and high adoption rates of advanced gaming technology.
- Asia-Pacific: Rapid growth in the gaming community, rising disposable income, and increasing investment in the esports sector.
- Europe: Expanding gaming market fueled by increasing penetration of high-speed internet and a growing preference for PC gaming.
The report provides detailed country-level analysis of market dynamics, pinpointing specific factors that contribute to the success of each key region.
Gaming Accessories and Peripherals Product Innovations
Recent innovations in gaming accessories include advanced mice with adjustable DPI settings and customizable weight configurations, keyboards with mechanical switches providing enhanced responsiveness and durability, and headsets featuring high-fidelity audio and noise cancellation technologies. The integration of AI and haptic feedback enhances the immersive gaming experience. These advancements offer superior performance, comfort, and personalization.
Propelling Factors for Gaming Accessories and Peripherals Growth
Several factors propel the growth of the gaming accessories and peripherals market:
- Technological Advancements: Continuous innovation in areas like haptic feedback, AI integration, and wireless connectivity are driving product demand.
- Rising Esports Popularity: The surge in popularity of esports fuels investment in high-performance gaming equipment.
- Increasing Disposable Incomes: Greater disposable income, particularly among younger demographics, allows for increased spending on gaming accessories.
Obstacles in the Gaming Accessories and Peripherals Market
The market faces challenges such as:
- Supply Chain Disruptions: Global supply chain disruptions can lead to increased production costs and reduced availability.
- Intense Competition: The market is highly competitive, with established players and new entrants vying for market share.
- Economic Downturns: Economic downturns can negatively impact consumer spending on discretionary items like gaming accessories.
Future Opportunities in Gaming Accessories and Peripherals
Future opportunities include:
- Expansion into Emerging Markets: Untapped markets in developing economies present substantial growth potential.
- Development of New Technologies: Innovations such as brain-computer interfaces and advanced haptic feedback systems offer exciting prospects.
- Growth of Cloud Gaming: The rise of cloud gaming could influence demand for specific accessories optimized for this platform.
Major Players in the Gaming Accessories and Peripherals Ecosystem
- Razer
- Logitech G (ASTRO)
- Turtle Beach
- Corsair
- Sennheiser
- Plantronics
- SteelSeries
- Mad Catz
- ROCCAT
- QPAD
- Thrustmaster
- HyperX
- Tt eSPORTS
- Cooler Master
- ZOWIE
Key Developments in Gaming Accessories and Peripherals Industry
- 2022-Q4: Razer launched its new advanced haptic feedback technology for its gaming mice.
- 2023-Q1: Logitech G acquired a smaller gaming headset manufacturer, expanding its product portfolio.
- 2023-Q3: Corsair released a new line of high-performance gaming keyboards with customizable RGB lighting.
(Further key developments are listed in the complete report.)
Strategic Gaming Accessories and Peripherals Market Forecast
The gaming accessories and peripherals market is poised for significant growth, driven by sustained demand from both casual and professional gamers, technological innovations, and the expansion of the esports industry. Continued innovation, strategic partnerships, and successful market penetration in emerging economies are key to realizing this substantial market potential. This report provides a robust forecast, offering invaluable insights for strategic planning and investment decisions.
Gaming Accessories and Peripherals Segmentation
-
1. Application
- 1.1. Online Sales
- 1.2. Offline Sales
-
2. Types
- 2.1. Mice
- 2.2. Keyboards
- 2.3. Headsets
- 2.4. Monitors
- 2.5. Others
Gaming Accessories and Peripherals Segmentation By Geography
-
1. North America
- 1.1. United States
- 1.2. Canada
- 1.3. Mexico
-
2. South America
- 2.1. Brazil
- 2.2. Argentina
- 2.3. Rest of South America
-
3. Europe
- 3.1. United Kingdom
- 3.2. Germany
- 3.3. France
- 3.4. Italy
- 3.5. Spain
- 3.6. Russia
- 3.7. Benelux
- 3.8. Nordics
- 3.9. Rest of Europe
-
4. Middle East & Africa
- 4.1. Turkey
- 4.2. Israel
- 4.3. GCC
- 4.4. North Africa
- 4.5. South Africa
- 4.6. Rest of Middle East & Africa
-
5. Asia Pacific
- 5.1. China
- 5.2. India
- 5.3. Japan
- 5.4. South Korea
- 5.5. ASEAN
- 5.6. Oceania
- 5.7. Rest of Asia Pacific
Gaming Accessories and Peripherals Regional Market Share
Geographic Coverage of Gaming Accessories and Peripherals
Gaming Accessories and Peripherals REPORT HIGHLIGHTS
| Aspects | Details |
|---|---|
| Study Period | 2020-2034 |
| Base Year | 2025 |
| Estimated Year | 2026 |
| Forecast Period | 2026-2034 |
| Historical Period | 2020-2025 |
| Growth Rate | CAGR of 7.02% from 2020-2034 |
| Segmentation |
|
Table of Contents
- 1. Introduction
- 1.1. Research Scope
- 1.2. Market Segmentation
- 1.3. Research Objective
- 1.4. Definitions and Assumptions
- 2. Executive Summary
- 2.1. Market Snapshot
- 3. Market Dynamics
- 3.1. Market Drivers
- 3.2. Market Restrains
- 3.3. Market Trends
- 3.4. Market Opportunities
- 4. Market Factor Analysis
- 4.1. Porters Five Forces
- 4.1.1. Bargaining Power of Suppliers
- 4.1.2. Bargaining Power of Buyers
- 4.1.3. Threat of New Entrants
- 4.1.4. Threat of Substitutes
- 4.1.5. Competitive Rivalry
- 4.2. PESTEL analysis
- 4.3. BCG Analysis
- 4.3.1. Stars (High Growth, High Market Share)
- 4.3.2. Cash Cows (Low Growth, High Market Share)
- 4.3.3. Question Mark (High Growth, Low Market Share)
- 4.3.4. Dogs (Low Growth, Low Market Share)
- 4.4. Ansoff Matrix Analysis
- 4.5. Supply Chain Analysis
- 4.6. Regulatory Landscape
- 4.7. Current Market Potential and Opportunity Assessment (TAM–SAM–SOM Framework)
- 4.8. DMV Analyst Note
- 4.1. Porters Five Forces
- 5. Market Analysis, Insights and Forecast 2021-2033
- 5.1. Market Analysis, Insights and Forecast - by Application
- 5.1.1. Online Sales
- 5.1.2. Offline Sales
- 5.2. Market Analysis, Insights and Forecast - by Types
- 5.2.1. Mice
- 5.2.2. Keyboards
- 5.2.3. Headsets
- 5.2.4. Monitors
- 5.2.5. Others
- 5.3. Market Analysis, Insights and Forecast - by Region
- 5.3.1. North America
- 5.3.2. South America
- 5.3.3. Europe
- 5.3.4. Middle East & Africa
- 5.3.5. Asia Pacific
- 5.1. Market Analysis, Insights and Forecast - by Application
- 6. Global Gaming Accessories and Peripherals Analysis, Insights and Forecast, 2021-2033
- 6.1. Market Analysis, Insights and Forecast - by Application
- 6.1.1. Online Sales
- 6.1.2. Offline Sales
- 6.2. Market Analysis, Insights and Forecast - by Types
- 6.2.1. Mice
- 6.2.2. Keyboards
- 6.2.3. Headsets
- 6.2.4. Monitors
- 6.2.5. Others
- 6.1. Market Analysis, Insights and Forecast - by Application
- 7. North America Gaming Accessories and Peripherals Analysis, Insights and Forecast, 2020-2032
- 7.1. Market Analysis, Insights and Forecast - by Application
- 7.1.1. Online Sales
- 7.1.2. Offline Sales
- 7.2. Market Analysis, Insights and Forecast - by Types
- 7.2.1. Mice
- 7.2.2. Keyboards
- 7.2.3. Headsets
- 7.2.4. Monitors
- 7.2.5. Others
- 7.1. Market Analysis, Insights and Forecast - by Application
- 8. South America Gaming Accessories and Peripherals Analysis, Insights and Forecast, 2020-2032
- 8.1. Market Analysis, Insights and Forecast - by Application
- 8.1.1. Online Sales
- 8.1.2. Offline Sales
- 8.2. Market Analysis, Insights and Forecast - by Types
- 8.2.1. Mice
- 8.2.2. Keyboards
- 8.2.3. Headsets
- 8.2.4. Monitors
- 8.2.5. Others
- 8.1. Market Analysis, Insights and Forecast - by Application
- 9. Europe Gaming Accessories and Peripherals Analysis, Insights and Forecast, 2020-2032
- 9.1. Market Analysis, Insights and Forecast - by Application
- 9.1.1. Online Sales
- 9.1.2. Offline Sales
- 9.2. Market Analysis, Insights and Forecast - by Types
- 9.2.1. Mice
- 9.2.2. Keyboards
- 9.2.3. Headsets
- 9.2.4. Monitors
- 9.2.5. Others
- 9.1. Market Analysis, Insights and Forecast - by Application
- 10. Middle East & Africa Gaming Accessories and Peripherals Analysis, Insights and Forecast, 2020-2032
- 10.1. Market Analysis, Insights and Forecast - by Application
- 10.1.1. Online Sales
- 10.1.2. Offline Sales
- 10.2. Market Analysis, Insights and Forecast - by Types
- 10.2.1. Mice
- 10.2.2. Keyboards
- 10.2.3. Headsets
- 10.2.4. Monitors
- 10.2.5. Others
- 10.1. Market Analysis, Insights and Forecast - by Application
- 11. Asia Pacific Gaming Accessories and Peripherals Analysis, Insights and Forecast, 2020-2032
- 11.1. Market Analysis, Insights and Forecast - by Application
- 11.1.1. Online Sales
- 11.1.2. Offline Sales
- 11.2. Market Analysis, Insights and Forecast - by Types
- 11.2.1. Mice
- 11.2.2. Keyboards
- 11.2.3. Headsets
- 11.2.4. Monitors
- 11.2.5. Others
- 11.1. Market Analysis, Insights and Forecast - by Application
- 12. Competitive Analysis
- 12.1. Company Profiles
- 12.1.1 Razer
- 12.1.1.1. Company Overview
- 12.1.1.2. Products
- 12.1.1.3. Company Financials
- 12.1.1.4. SWOT Analysis
- 12.1.2 Logitech G (ASTRO)
- 12.1.2.1. Company Overview
- 12.1.2.2. Products
- 12.1.2.3. Company Financials
- 12.1.2.4. SWOT Analysis
- 12.1.3 Turtle Beach
- 12.1.3.1. Company Overview
- 12.1.3.2. Products
- 12.1.3.3. Company Financials
- 12.1.3.4. SWOT Analysis
- 12.1.4 Corsair
- 12.1.4.1. Company Overview
- 12.1.4.2. Products
- 12.1.4.3. Company Financials
- 12.1.4.4. SWOT Analysis
- 12.1.5 Sennheiser
- 12.1.5.1. Company Overview
- 12.1.5.2. Products
- 12.1.5.3. Company Financials
- 12.1.5.4. SWOT Analysis
- 12.1.6 Plantronics
- 12.1.6.1. Company Overview
- 12.1.6.2. Products
- 12.1.6.3. Company Financials
- 12.1.6.4. SWOT Analysis
- 12.1.7 SteelSeries
- 12.1.7.1. Company Overview
- 12.1.7.2. Products
- 12.1.7.3. Company Financials
- 12.1.7.4. SWOT Analysis
- 12.1.8 Mad Catz
- 12.1.8.1. Company Overview
- 12.1.8.2. Products
- 12.1.8.3. Company Financials
- 12.1.8.4. SWOT Analysis
- 12.1.9 ROCCAT
- 12.1.9.1. Company Overview
- 12.1.9.2. Products
- 12.1.9.3. Company Financials
- 12.1.9.4. SWOT Analysis
- 12.1.10 QPAD
- 12.1.10.1. Company Overview
- 12.1.10.2. Products
- 12.1.10.3. Company Financials
- 12.1.10.4. SWOT Analysis
- 12.1.11 Thrustmaster
- 12.1.11.1. Company Overview
- 12.1.11.2. Products
- 12.1.11.3. Company Financials
- 12.1.11.4. SWOT Analysis
- 12.1.12 HyperX
- 12.1.12.1. Company Overview
- 12.1.12.2. Products
- 12.1.12.3. Company Financials
- 12.1.12.4. SWOT Analysis
- 12.1.13 Tt eSPORTS
- 12.1.13.1. Company Overview
- 12.1.13.2. Products
- 12.1.13.3. Company Financials
- 12.1.13.4. SWOT Analysis
- 12.1.14 Cooler Master
- 12.1.14.1. Company Overview
- 12.1.14.2. Products
- 12.1.14.3. Company Financials
- 12.1.14.4. SWOT Analysis
- 12.1.15 ZOWIE
- 12.1.15.1. Company Overview
- 12.1.15.2. Products
- 12.1.15.3. Company Financials
- 12.1.15.4. SWOT Analysis
- 12.1.1 Razer
- 12.2. Market Entropy
- 12.2.1 Company's Key Areas Served
- 12.2.2 Recent Developments
- 12.3. Company Market Share Analysis 2025
- 12.3.1 Top 5 Companies Market Share Analysis
- 12.3.2 Top 3 Companies Market Share Analysis
- 12.4. List of Potential Customers
- 13. Research Methodology
List of Figures
- Figure 1: Global Gaming Accessories and Peripherals Revenue Breakdown (undefined, %) by Region 2025 & 2033
- Figure 2: North America Gaming Accessories and Peripherals Revenue (undefined), by Application 2025 & 2033
- Figure 3: North America Gaming Accessories and Peripherals Revenue Share (%), by Application 2025 & 2033
- Figure 4: North America Gaming Accessories and Peripherals Revenue (undefined), by Types 2025 & 2033
- Figure 5: North America Gaming Accessories and Peripherals Revenue Share (%), by Types 2025 & 2033
- Figure 6: North America Gaming Accessories and Peripherals Revenue (undefined), by Country 2025 & 2033
- Figure 7: North America Gaming Accessories and Peripherals Revenue Share (%), by Country 2025 & 2033
- Figure 8: South America Gaming Accessories and Peripherals Revenue (undefined), by Application 2025 & 2033
- Figure 9: South America Gaming Accessories and Peripherals Revenue Share (%), by Application 2025 & 2033
- Figure 10: South America Gaming Accessories and Peripherals Revenue (undefined), by Types 2025 & 2033
- Figure 11: South America Gaming Accessories and Peripherals Revenue Share (%), by Types 2025 & 2033
- Figure 12: South America Gaming Accessories and Peripherals Revenue (undefined), by Country 2025 & 2033
- Figure 13: South America Gaming Accessories and Peripherals Revenue Share (%), by Country 2025 & 2033
- Figure 14: Europe Gaming Accessories and Peripherals Revenue (undefined), by Application 2025 & 2033
- Figure 15: Europe Gaming Accessories and Peripherals Revenue Share (%), by Application 2025 & 2033
- Figure 16: Europe Gaming Accessories and Peripherals Revenue (undefined), by Types 2025 & 2033
- Figure 17: Europe Gaming Accessories and Peripherals Revenue Share (%), by Types 2025 & 2033
- Figure 18: Europe Gaming Accessories and Peripherals Revenue (undefined), by Country 2025 & 2033
- Figure 19: Europe Gaming Accessories and Peripherals Revenue Share (%), by Country 2025 & 2033
- Figure 20: Middle East & Africa Gaming Accessories and Peripherals Revenue (undefined), by Application 2025 & 2033
- Figure 21: Middle East & Africa Gaming Accessories and Peripherals Revenue Share (%), by Application 2025 & 2033
- Figure 22: Middle East & Africa Gaming Accessories and Peripherals Revenue (undefined), by Types 2025 & 2033
- Figure 23: Middle East & Africa Gaming Accessories and Peripherals Revenue Share (%), by Types 2025 & 2033
- Figure 24: Middle East & Africa Gaming Accessories and Peripherals Revenue (undefined), by Country 2025 & 2033
- Figure 25: Middle East & Africa Gaming Accessories and Peripherals Revenue Share (%), by Country 2025 & 2033
- Figure 26: Asia Pacific Gaming Accessories and Peripherals Revenue (undefined), by Application 2025 & 2033
- Figure 27: Asia Pacific Gaming Accessories and Peripherals Revenue Share (%), by Application 2025 & 2033
- Figure 28: Asia Pacific Gaming Accessories and Peripherals Revenue (undefined), by Types 2025 & 2033
- Figure 29: Asia Pacific Gaming Accessories and Peripherals Revenue Share (%), by Types 2025 & 2033
- Figure 30: Asia Pacific Gaming Accessories and Peripherals Revenue (undefined), by Country 2025 & 2033
- Figure 31: Asia Pacific Gaming Accessories and Peripherals Revenue Share (%), by Country 2025 & 2033
List of Tables
- Table 1: Global Gaming Accessories and Peripherals Revenue undefined Forecast, by Application 2020 & 2033
- Table 2: Global Gaming Accessories and Peripherals Revenue undefined Forecast, by Types 2020 & 2033
- Table 3: Global Gaming Accessories and Peripherals Revenue undefined Forecast, by Region 2020 & 2033
- Table 4: Global Gaming Accessories and Peripherals Revenue undefined Forecast, by Application 2020 & 2033
- Table 5: Global Gaming Accessories and Peripherals Revenue undefined Forecast, by Types 2020 & 2033
- Table 6: Global Gaming Accessories and Peripherals Revenue undefined Forecast, by Country 2020 & 2033
- Table 7: United States Gaming Accessories and Peripherals Revenue (undefined) Forecast, by Application 2020 & 2033
- Table 8: Canada Gaming Accessories and Peripherals Revenue (undefined) Forecast, by Application 2020 & 2033
- Table 9: Mexico Gaming Accessories and Peripherals Revenue (undefined) Forecast, by Application 2020 & 2033
- Table 10: Global Gaming Accessories and Peripherals Revenue undefined Forecast, by Application 2020 & 2033
- Table 11: Global Gaming Accessories and Peripherals Revenue undefined Forecast, by Types 2020 & 2033
- Table 12: Global Gaming Accessories and Peripherals Revenue undefined Forecast, by Country 2020 & 2033
- Table 13: Brazil Gaming Accessories and Peripherals Revenue (undefined) Forecast, by Application 2020 & 2033
- Table 14: Argentina Gaming Accessories and Peripherals Revenue (undefined) Forecast, by Application 2020 & 2033
- Table 15: Rest of South America Gaming Accessories and Peripherals Revenue (undefined) Forecast, by Application 2020 & 2033
- Table 16: Global Gaming Accessories and Peripherals Revenue undefined Forecast, by Application 2020 & 2033
- Table 17: Global Gaming Accessories and Peripherals Revenue undefined Forecast, by Types 2020 & 2033
- Table 18: Global Gaming Accessories and Peripherals Revenue undefined Forecast, by Country 2020 & 2033
- Table 19: United Kingdom Gaming Accessories and Peripherals Revenue (undefined) Forecast, by Application 2020 & 2033
- Table 20: Germany Gaming Accessories and Peripherals Revenue (undefined) Forecast, by Application 2020 & 2033
- Table 21: France Gaming Accessories and Peripherals Revenue (undefined) Forecast, by Application 2020 & 2033
- Table 22: Italy Gaming Accessories and Peripherals Revenue (undefined) Forecast, by Application 2020 & 2033
- Table 23: Spain Gaming Accessories and Peripherals Revenue (undefined) Forecast, by Application 2020 & 2033
- Table 24: Russia Gaming Accessories and Peripherals Revenue (undefined) Forecast, by Application 2020 & 2033
- Table 25: Benelux Gaming Accessories and Peripherals Revenue (undefined) Forecast, by Application 2020 & 2033
- Table 26: Nordics Gaming Accessories and Peripherals Revenue (undefined) Forecast, by Application 2020 & 2033
- Table 27: Rest of Europe Gaming Accessories and Peripherals Revenue (undefined) Forecast, by Application 2020 & 2033
- Table 28: Global Gaming Accessories and Peripherals Revenue undefined Forecast, by Application 2020 & 2033
- Table 29: Global Gaming Accessories and Peripherals Revenue undefined Forecast, by Types 2020 & 2033
- Table 30: Global Gaming Accessories and Peripherals Revenue undefined Forecast, by Country 2020 & 2033
- Table 31: Turkey Gaming Accessories and Peripherals Revenue (undefined) Forecast, by Application 2020 & 2033
- Table 32: Israel Gaming Accessories and Peripherals Revenue (undefined) Forecast, by Application 2020 & 2033
- Table 33: GCC Gaming Accessories and Peripherals Revenue (undefined) Forecast, by Application 2020 & 2033
- Table 34: North Africa Gaming Accessories and Peripherals Revenue (undefined) Forecast, by Application 2020 & 2033
- Table 35: South Africa Gaming Accessories and Peripherals Revenue (undefined) Forecast, by Application 2020 & 2033
- Table 36: Rest of Middle East & Africa Gaming Accessories and Peripherals Revenue (undefined) Forecast, by Application 2020 & 2033
- Table 37: Global Gaming Accessories and Peripherals Revenue undefined Forecast, by Application 2020 & 2033
- Table 38: Global Gaming Accessories and Peripherals Revenue undefined Forecast, by Types 2020 & 2033
- Table 39: Global Gaming Accessories and Peripherals Revenue undefined Forecast, by Country 2020 & 2033
- Table 40: China Gaming Accessories and Peripherals Revenue (undefined) Forecast, by Application 2020 & 2033
- Table 41: India Gaming Accessories and Peripherals Revenue (undefined) Forecast, by Application 2020 & 2033
- Table 42: Japan Gaming Accessories and Peripherals Revenue (undefined) Forecast, by Application 2020 & 2033
- Table 43: South Korea Gaming Accessories and Peripherals Revenue (undefined) Forecast, by Application 2020 & 2033
- Table 44: ASEAN Gaming Accessories and Peripherals Revenue (undefined) Forecast, by Application 2020 & 2033
- Table 45: Oceania Gaming Accessories and Peripherals Revenue (undefined) Forecast, by Application 2020 & 2033
- Table 46: Rest of Asia Pacific Gaming Accessories and Peripherals Revenue (undefined) Forecast, by Application 2020 & 2033
Frequently Asked Questions
1. What is the projected Compound Annual Growth Rate (CAGR) of the Gaming Accessories and Peripherals?
The projected CAGR is approximately 7.02%.
2. Which companies are prominent players in the Gaming Accessories and Peripherals?
Key companies in the market include Razer, Logitech G (ASTRO), Turtle Beach, Corsair, Sennheiser, Plantronics, SteelSeries, Mad Catz, ROCCAT, QPAD, Thrustmaster, HyperX, Tt eSPORTS, Cooler Master, ZOWIE.
3. What are the main segments of the Gaming Accessories and Peripherals?
The market segments include Application, Types.
4. Can you provide details about the market size?
The market size is estimated to be USD XXX N/A as of 2022.
5. What are some drivers contributing to market growth?
N/A
6. What are the notable trends driving market growth?
N/A
7. Are there any restraints impacting market growth?
N/A
8. Can you provide examples of recent developments in the market?
N/A
9. What pricing options are available for accessing the report?
Pricing options include single-user, multi-user, and enterprise licenses priced at USD 4900.00, USD 7350.00, and USD 9800.00 respectively.
10. Is the market size provided in terms of value or volume?
The market size is provided in terms of value, measured in N/A.
11. Are there any specific market keywords associated with the report?
Yes, the market keyword associated with the report is "Gaming Accessories and Peripherals," which aids in identifying and referencing the specific market segment covered.
12. How do I determine which pricing option suits my needs best?
The pricing options vary based on user requirements and access needs. Individual users may opt for single-user licenses, while businesses requiring broader access may choose multi-user or enterprise licenses for cost-effective access to the report.
13. Are there any additional resources or data provided in the Gaming Accessories and Peripherals report?
While the report offers comprehensive insights, it's advisable to review the specific contents or supplementary materials provided to ascertain if additional resources or data are available.
14. How can I stay updated on further developments or reports in the Gaming Accessories and Peripherals?
To stay informed about further developments, trends, and reports in the Gaming Accessories and Peripherals, consider subscribing to industry newsletters, following relevant companies and organizations, or regularly checking reputable industry news sources and publications.
Methodology
Step 1 - Identification of Relevant Samples Size from Population Database


Step 2 - Approaches for Defining Global Market Size (Value, Volume* & Price*)

Note*: In applicable scenarios
Step 3 - Data Sources
Primary Research
- Web Analytics
- Survey Reports
- Research Institute
- Latest Research Reports
- Opinion Leaders
Secondary Research
- Annual Reports
- White Paper
- Latest Press Release
- Industry Association
- Paid Database
- Investor Presentations

Step 4 - Data Triangulation
Involves using different sources of information in order to increase the validity of a study
These sources are likely to be stakeholders in a program - participants, other researchers, program staff, other community members, and so on.
Then we put all data in single framework & apply various statistical tools to find out the dynamic on the market.
During the analysis stage, feedback from the stakeholder groups would be compared to determine areas of agreement as well as areas of divergence