

Key Insights
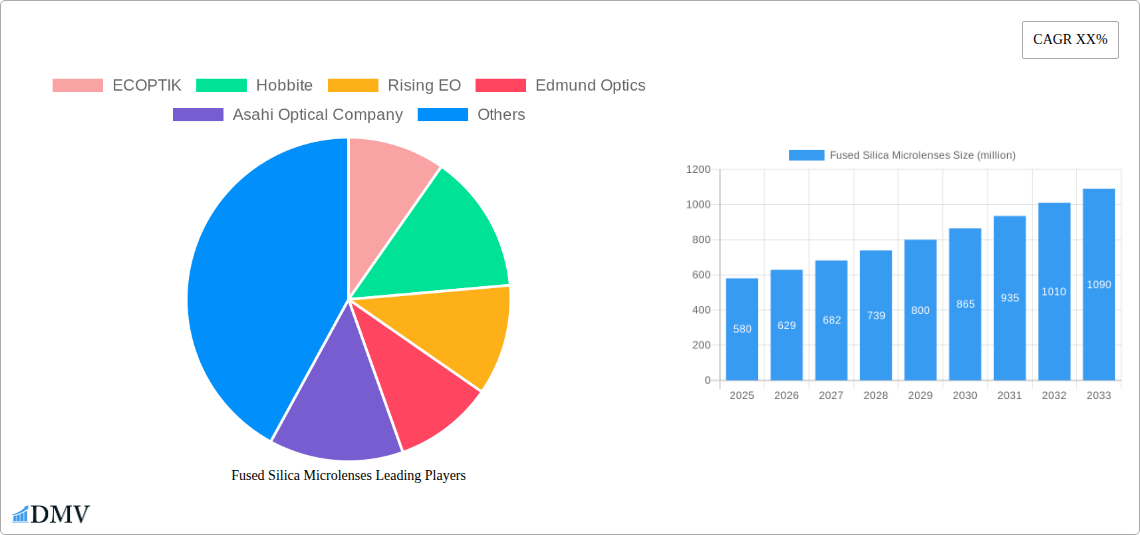
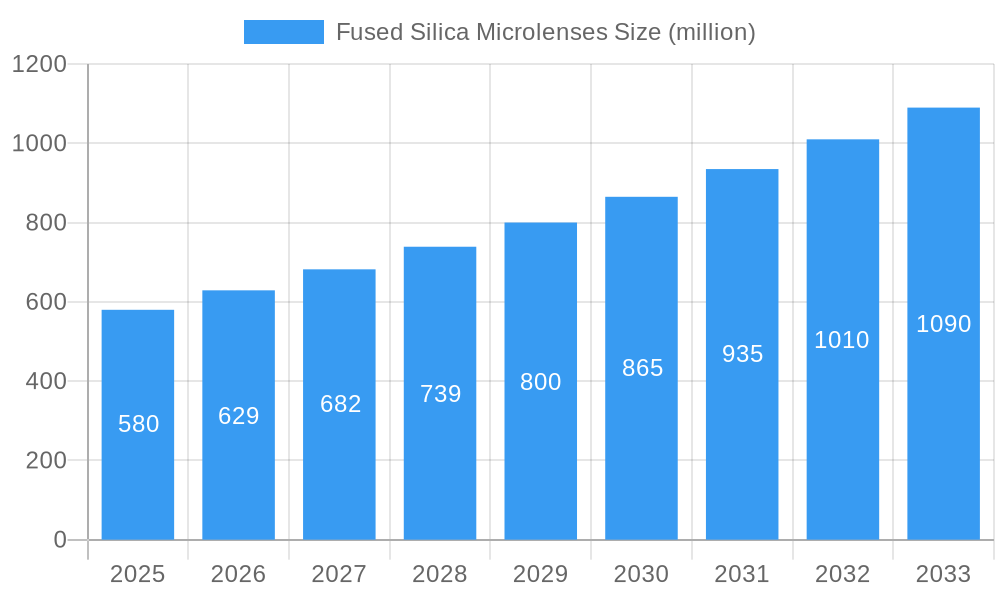
The global Fused Silica Microlenses market is poised for substantial growth, projected to reach an estimated market size of approximately $580 million by 2025, with a robust Compound Annual Growth Rate (CAGR) of 8.5% anticipated over the forecast period of 2025-2033. This expansion is primarily driven by the escalating demand for high-performance optical components across a spectrum of advanced industries. The electronics and semiconductor sector, a cornerstone of this market, is witnessing an unprecedented surge in miniaturization and complexity, necessitating the precise optical functionalities offered by fused silica microlenses in applications such as advanced lithography, intricate sensor systems, and high-density data storage. Similarly, the medical device industry is a significant growth catalyst, with the increasing adoption of minimally invasive surgical tools, advanced diagnostic equipment, and sophisticated imaging technologies relying heavily on the unique optical properties and biocompatibility of fused silica.
Fused Silica Microlenses Market Size (In Million)
Further fueling this market's trajectory are the burgeoning aerospace and defense sectors, where the demand for lightweight, durable, and radiation-resistant optical components for satellite systems, guidance systems, and advanced surveillance equipment is paramount. The inherent advantages of fused silica, including its excellent thermal stability, low thermal expansion, and high purity, make it an indispensable material for these demanding environments. Emerging trends such as the increasing integration of optical technologies in the Internet of Things (IoT) devices, the development of augmented reality (AR) and virtual reality (VR) headsets, and advancements in optical communication systems will continue to open new avenues for fused silica microlenses. However, certain restraints, such as the high manufacturing costs associated with producing these precision optics and the availability of alternative materials in less demanding applications, could temper the market's growth rate to some extent. Nonetheless, the undeniable performance benefits and the relentless pursuit of innovation across key end-user industries position the fused silica microlenses market for sustained and significant expansion.
Fused Silica Microlenses Company Market Share
Fused Silica Microlenses Market Report: In-depth Analysis and Future Outlook (2019–2033)
This comprehensive report offers a deep dive into the global Fused Silica Microlenses market, meticulously analyzing its current composition, historical evolution, and future trajectory. Covering the Study Period of 2019–2033, with a Base Year of 2025 and a Forecast Period from 2025–2033, this report provides actionable insights for stakeholders in the Electronics and Semiconductors, Medical Devices, and Aerospace industries, among others. We meticulously examine market dynamics, technological innovations, regional dominance, and growth drivers, equipping businesses with the intelligence needed to navigate this rapidly expanding landscape.
Fused Silica Microlenses Market Composition & Trends
The fused silica microlenses market is characterized by a moderate level of concentration, with a few key players holding significant market share. Innovation catalysts such as miniaturization demands in consumer electronics and the burgeoning field of advanced optics are driving significant research and development. Regulatory landscapes, particularly concerning medical device components and aerospace safety standards, are increasingly influencing product development and market entry. Substitute products, while present, often fall short in terms of the superior optical properties, thermal stability, and chemical inertness offered by fused silica. End-user profiles range from large-scale manufacturers in the electronics and semiconductors sector requiring high-volume, precision optics, to specialized firms in medical devices and aerospace demanding high reliability and performance. Mergers and acquisition (M&A) activities, with reported deal values in the tens of millions of USD, are a recurring theme, as companies seek to expand their portfolios and market reach. The market share distribution is dynamic, influenced by technological breakthroughs and the increasing adoption of fused silica microlenses in novel applications.
- Market Concentration: Moderate, with key players dominating specific niches.
- Innovation Catalysts: Miniaturization, advanced optics, emerging technologies like LiDAR.
- Regulatory Landscapes: Impacting medical device and aerospace applications.
- Substitute Products: Limited by fused silica's unique properties.
- End-User Profiles: Diverse, from high-volume electronics to specialized medical and aerospace.
- M&A Activities: Ongoing, with deal values reaching tens of millions of USD.
Fused Silica Microlenses Industry Evolution
The fused silica microlenses industry has witnessed a remarkable growth trajectory over the Historical Period of 2019–2024, driven by relentless technological advancements and evolving consumer demands. The increasing need for smaller, more efficient optical components across various sectors has fueled demand for the exceptional properties of fused silica. This evolution is marked by significant strides in manufacturing techniques, enabling the production of increasingly complex and precise microlens arrays. The adoption of fused silica microlenses in applications such as smartphone cameras, augmented reality (AR) and virtual reality (VR) devices, and advanced imaging systems has surged. Furthermore, the medical device sector's reliance on high-precision optics for minimally invasive procedures and diagnostic equipment has been a substantial growth driver. The aerospace industry, with its stringent requirements for radiation resistance and thermal stability, also represents a growing segment for these advanced optical components. Market growth rates have consistently been in the double digits, with projections indicating continued robust expansion. Adoption metrics show a clear upward trend, with new applications constantly emerging.
The electronics and semiconductors segment, in particular, has been a major beneficiary of fused silica microlens technology. The drive for smaller form factors and higher performance in devices like smartphones, wearables, and advanced sensors necessitates optical solutions that can meet these demands. The ability of fused silica to withstand harsh operating environments, including high temperatures and aggressive chemicals, makes it an ideal material for these applications. In the medical device arena, fused silica microlenses are crucial for endoscopic imaging, surgical microscopes, and laser-based therapeutic systems. Their biocompatibility and optical clarity are paramount in ensuring patient safety and diagnostic accuracy. The aerospace industry leverages fused silica microlenses for optical communication systems, navigation equipment, and scientific instruments, where extreme conditions and long-term reliability are non-negotiable. The Others segment, encompassing scientific research, industrial automation, and defense applications, also contributes significantly to the market's overall growth.
Technological advancements have played a pivotal role in this evolution. Innovations in lithography, etching, and diamond turning techniques have allowed for the fabrication of microlenses with sub-micron precision, meeting the ever-increasing resolution requirements of modern optical systems. The development of anti-reflective coatings tailored for fused silica further enhances their performance, minimizing light loss and maximizing signal integrity. Consumer demand for enhanced imaging capabilities, miniaturized electronics, and sophisticated medical treatments has created a fertile ground for the widespread adoption of fused silica microlenses. This symbiotic relationship between technological innovation and market demand continues to propel the industry forward, promising sustained growth and diversification in the coming years.
Leading Regions, Countries, or Segments in Fused Silica Microlenses
The Electronics and Semiconductors segment stands as the dominant force within the global fused silica microlenses market. This dominance is fueled by the insatiable demand for miniaturized, high-performance optical components essential for the continuous innovation in consumer electronics, mobile devices, and advanced computing. Countries leading in semiconductor manufacturing and electronic device production, such as the United States, China, South Korea, and Japan, are thus at the forefront of fused silica microlenses consumption. Investment trends within these regions are heavily skewed towards research and development in semiconductor fabrication and the integration of advanced optical systems into next-generation devices. Regulatory support for technological innovation and manufacturing excellence further bolsters the growth in these key economies.
The Spherical type of fused silica microlenses also commands a leading position due to its widespread applicability in standard imaging systems, laser focusing, and general optical assembly. Its versatility makes it a foundational component across numerous applications, from smartphone cameras to industrial inspection equipment.
Key Drivers of Dominance in Electronics and Semiconductors:
- Ubiquitous Integration: Fused silica microlenses are integral to the functioning of billions of electronic devices worldwide.
- Miniaturization Trends: The relentless pursuit of smaller, more powerful electronic gadgets directly drives the demand for micro-scale optics.
- High-Volume Manufacturing: The sheer scale of electronic device production necessitates high-volume manufacturing of fused silica microlenses.
- Technological Advancements: Innovations in semiconductor fabrication processes directly benefit from and necessitate advancements in microlens technology.
- Investment in R&D: Significant investments in research and development within the semiconductor and electronics sectors foster continuous adoption of cutting-edge optical solutions.
In-depth analysis of dominance factors reveals that the Electronics and Semiconductors segment's growth is intrinsically linked to global technology trends. The increasing complexity of integrated circuits and the development of advanced sensing technologies require optics with exceptional precision, minimal aberration, and robust durability – qualities that fused silica excels at providing. The market penetration of devices featuring augmented reality (AR) and virtual reality (VR) capabilities, which rely heavily on sophisticated optical engines, further solidifies this segment's leading position. While Medical Devices and Aerospace represent high-value niche markets with stringent performance requirements, the sheer volume and constant innovation cycles within the electronics sector ensure its continued dominance. The availability of advanced manufacturing infrastructure and a skilled workforce in leading Asian economies further contributes to their leading role in both production and consumption of fused silica microlenses.
Fused Silica Microlenses Product Innovations
Product innovations in fused silica microlenses are constantly pushing the boundaries of optical performance and application scope. Recent advancements include the development of ultra-low distortion microlenses for high-resolution imaging, multi-element microlens arrays for complex beam shaping, and specialized coatings for enhanced UV or IR transmission. These innovations enable unprecedented clarity, efficiency, and functionality in demanding applications, from advanced scientific instrumentation to compact camera modules. The ability to precisely control the refractive index and surface topography of fused silica allows for the creation of bespoke optical solutions tailored to specific performance metrics.
Propelling Factors for Fused Silica Microlenses Growth
Several key growth drivers are propelling the fused silica microlenses market forward. Firstly, the exponential growth of the Electronics and Semiconductors industry, particularly in consumer electronics and advanced computing, demands increasingly sophisticated and miniaturized optical components. Secondly, the burgeoning adoption of Medical Devices that rely on high-precision imaging and laser technology, such as endoscopes and surgical instruments, is creating significant demand. Thirdly, advancements in Aerospace technology, requiring robust and reliable optical solutions for navigation and communication, further contribute to market expansion. Finally, the continuous development of new applications in areas like LiDAR, AR/VR, and scientific research, where the superior optical properties of fused silica are indispensable, acts as a powerful catalyst for growth.
Obstacles in the Fused Silica Microlenses Market
Despite the strong growth trajectory, the fused silica microlenses market faces certain obstacles. High manufacturing costs associated with the precision required for fused silica fabrication can limit adoption in price-sensitive applications. Stringent quality control and potential supply chain disruptions for high-purity fused silica raw materials can impact production timelines and costs. Furthermore, the emergence of alternative materials or manufacturing techniques, while not yet fully competitive, poses a potential long-term threat. Intense competition among existing players and the need for continuous innovation to maintain a competitive edge also present challenges for market participants.
Future Opportunities in Fused Silica Microlenses
The future for fused silica microlenses is ripe with opportunities. The rapid expansion of the Internet of Things (IoT) ecosystem, with its demand for advanced sensors and imaging capabilities, presents a significant growth avenue. The increasing integration of AI and machine learning in various industries will further necessitate high-performance optical components for data acquisition and processing. Emerging markets in developing economies, as they advance their technological infrastructure, will also offer substantial new opportunities. Furthermore, continued research into novel applications in areas like quantum computing and advanced photonics will unlock new frontiers for fused silica microlenses.
Major Players in the Fused Silica Microlenses Ecosystem
- ECOPTIK
- Hobbite
- Rising EO
- Edmund Optics
- Asahi Optical Company
- Corning
Key Developments in Fused Silica Microlenses Industry
- 2023 Q4: Launch of new ultra-high precision fused silica microlens arrays for advanced semiconductor inspection.
- 2024 Q1: Acquisition of a specialized fused silica optics manufacturer by a leading optical component supplier, strengthening market presence.
- 2024 Q2: Introduction of advanced anti-reflective coatings for fused silica microlenses, enhancing performance in challenging environments.
- 2024 Q3: Significant investment in R&D for fused silica microlenses aimed at next-generation AR/VR displays.
- 2024 Q4: Collaboration announced between a major medical device company and a fused silica manufacturer to develop novel imaging components.
Strategic Fused Silica Microlenses Market Forecast
The strategic forecast for the fused silica microlenses market is overwhelmingly positive, driven by sustained innovation and expanding applications. The continued miniaturization and performance enhancement demands in the electronics and semiconductors sector, coupled with the critical role of fused silica in the advancement of medical devices and aerospace technologies, will ensure robust market growth. Emerging opportunities in IoT, AI-driven systems, and new photonics research will further solidify the market's upward trajectory. Stakeholders can anticipate a dynamic landscape with ongoing technological advancements and strategic collaborations shaping the future of this essential optical component.
Fused Silica Microlenses Segmentation
-
1. Application
- 1.1. Electronics and Semiconductors
- 1.2. Medical Devices
- 1.3. Aerospace
- 1.4. Others
-
2. Types
- 2.1. Spherical
- 2.2. Cylindrical
- 2.3. Others
Fused Silica Microlenses Segmentation By Geography
-
1. North America
- 1.1. United States
- 1.2. Canada
- 1.3. Mexico
-
2. South America
- 2.1. Brazil
- 2.2. Argentina
- 2.3. Rest of South America
-
3. Europe
- 3.1. United Kingdom
- 3.2. Germany
- 3.3. France
- 3.4. Italy
- 3.5. Spain
- 3.6. Russia
- 3.7. Benelux
- 3.8. Nordics
- 3.9. Rest of Europe
-
4. Middle East & Africa
- 4.1. Turkey
- 4.2. Israel
- 4.3. GCC
- 4.4. North Africa
- 4.5. South Africa
- 4.6. Rest of Middle East & Africa
-
5. Asia Pacific
- 5.1. China
- 5.2. India
- 5.3. Japan
- 5.4. South Korea
- 5.5. ASEAN
- 5.6. Oceania
- 5.7. Rest of Asia Pacific
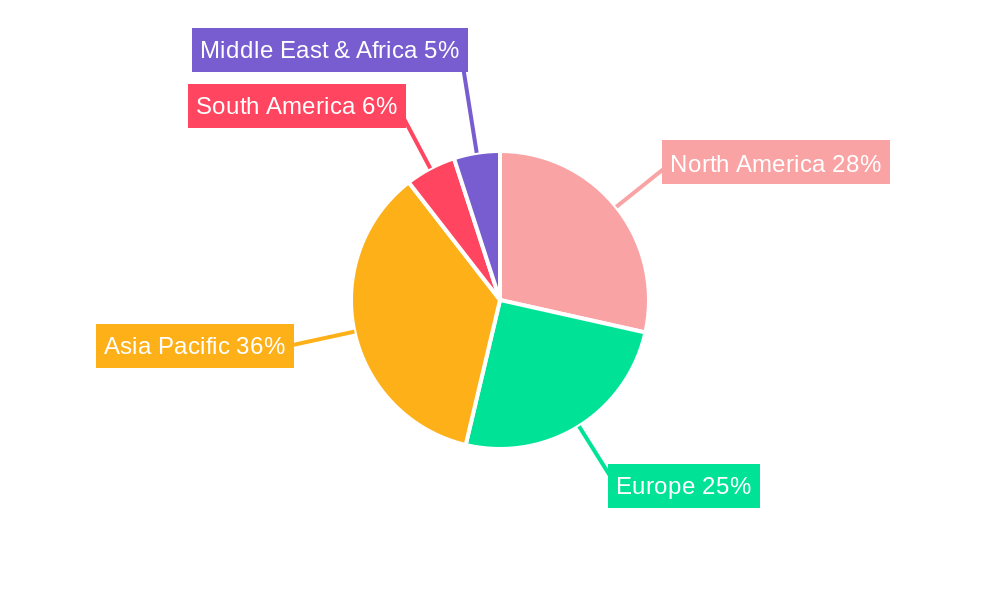
Fused Silica Microlenses Regional Market Share
Geographic Coverage of Fused Silica Microlenses
Fused Silica Microlenses REPORT HIGHLIGHTS
| Aspects | Details |
|---|---|
| Study Period | 2020-2034 |
| Base Year | 2025 |
| Estimated Year | 2026 |
| Forecast Period | 2026-2034 |
| Historical Period | 2020-2025 |
| Growth Rate | CAGR of 6.55% from 2020-2034 |
| Segmentation |
|
Table of Contents
- 1. Introduction
- 1.1. Research Scope
- 1.2. Market Segmentation
- 1.3. Research Objective
- 1.4. Definitions and Assumptions
- 2. Executive Summary
- 2.1. Market Snapshot
- 3. Market Dynamics
- 3.1. Market Drivers
- 3.2. Market Restrains
- 3.3. Market Trends
- 3.4. Market Opportunities
- 4. Market Factor Analysis
- 4.1. Porters Five Forces
- 4.1.1. Bargaining Power of Suppliers
- 4.1.2. Bargaining Power of Buyers
- 4.1.3. Threat of New Entrants
- 4.1.4. Threat of Substitutes
- 4.1.5. Competitive Rivalry
- 4.2. PESTEL analysis
- 4.3. BCG Analysis
- 4.3.1. Stars (High Growth, High Market Share)
- 4.3.2. Cash Cows (Low Growth, High Market Share)
- 4.3.3. Question Mark (High Growth, Low Market Share)
- 4.3.4. Dogs (Low Growth, Low Market Share)
- 4.4. Ansoff Matrix Analysis
- 4.5. Supply Chain Analysis
- 4.6. Regulatory Landscape
- 4.7. Current Market Potential and Opportunity Assessment (TAM–SAM–SOM Framework)
- 4.8. DMV Analyst Note
- 4.1. Porters Five Forces
- 5. Market Analysis, Insights and Forecast 2021-2033
- 5.1. Market Analysis, Insights and Forecast - by Application
- 5.1.1. Electronics and Semiconductors
- 5.1.2. Medical Devices
- 5.1.3. Aerospace
- 5.1.4. Others
- 5.2. Market Analysis, Insights and Forecast - by Types
- 5.2.1. Spherical
- 5.2.2. Cylindrical
- 5.2.3. Others
- 5.3. Market Analysis, Insights and Forecast - by Region
- 5.3.1. North America
- 5.3.2. South America
- 5.3.3. Europe
- 5.3.4. Middle East & Africa
- 5.3.5. Asia Pacific
- 5.1. Market Analysis, Insights and Forecast - by Application
- 6. Global Fused Silica Microlenses Analysis, Insights and Forecast, 2021-2033
- 6.1. Market Analysis, Insights and Forecast - by Application
- 6.1.1. Electronics and Semiconductors
- 6.1.2. Medical Devices
- 6.1.3. Aerospace
- 6.1.4. Others
- 6.2. Market Analysis, Insights and Forecast - by Types
- 6.2.1. Spherical
- 6.2.2. Cylindrical
- 6.2.3. Others
- 6.1. Market Analysis, Insights and Forecast - by Application
- 7. North America Fused Silica Microlenses Analysis, Insights and Forecast, 2020-2032
- 7.1. Market Analysis, Insights and Forecast - by Application
- 7.1.1. Electronics and Semiconductors
- 7.1.2. Medical Devices
- 7.1.3. Aerospace
- 7.1.4. Others
- 7.2. Market Analysis, Insights and Forecast - by Types
- 7.2.1. Spherical
- 7.2.2. Cylindrical
- 7.2.3. Others
- 7.1. Market Analysis, Insights and Forecast - by Application
- 8. South America Fused Silica Microlenses Analysis, Insights and Forecast, 2020-2032
- 8.1. Market Analysis, Insights and Forecast - by Application
- 8.1.1. Electronics and Semiconductors
- 8.1.2. Medical Devices
- 8.1.3. Aerospace
- 8.1.4. Others
- 8.2. Market Analysis, Insights and Forecast - by Types
- 8.2.1. Spherical
- 8.2.2. Cylindrical
- 8.2.3. Others
- 8.1. Market Analysis, Insights and Forecast - by Application
- 9. Europe Fused Silica Microlenses Analysis, Insights and Forecast, 2020-2032
- 9.1. Market Analysis, Insights and Forecast - by Application
- 9.1.1. Electronics and Semiconductors
- 9.1.2. Medical Devices
- 9.1.3. Aerospace
- 9.1.4. Others
- 9.2. Market Analysis, Insights and Forecast - by Types
- 9.2.1. Spherical
- 9.2.2. Cylindrical
- 9.2.3. Others
- 9.1. Market Analysis, Insights and Forecast - by Application
- 10. Middle East & Africa Fused Silica Microlenses Analysis, Insights and Forecast, 2020-2032
- 10.1. Market Analysis, Insights and Forecast - by Application
- 10.1.1. Electronics and Semiconductors
- 10.1.2. Medical Devices
- 10.1.3. Aerospace
- 10.1.4. Others
- 10.2. Market Analysis, Insights and Forecast - by Types
- 10.2.1. Spherical
- 10.2.2. Cylindrical
- 10.2.3. Others
- 10.1. Market Analysis, Insights and Forecast - by Application
- 11. Asia Pacific Fused Silica Microlenses Analysis, Insights and Forecast, 2020-2032
- 11.1. Market Analysis, Insights and Forecast - by Application
- 11.1.1. Electronics and Semiconductors
- 11.1.2. Medical Devices
- 11.1.3. Aerospace
- 11.1.4. Others
- 11.2. Market Analysis, Insights and Forecast - by Types
- 11.2.1. Spherical
- 11.2.2. Cylindrical
- 11.2.3. Others
- 11.1. Market Analysis, Insights and Forecast - by Application
- 12. Competitive Analysis
- 12.1. Company Profiles
- 12.1.1 ECOPTIK
- 12.1.1.1. Company Overview
- 12.1.1.2. Products
- 12.1.1.3. Company Financials
- 12.1.1.4. SWOT Analysis
- 12.1.2 Hobbite
- 12.1.2.1. Company Overview
- 12.1.2.2. Products
- 12.1.2.3. Company Financials
- 12.1.2.4. SWOT Analysis
- 12.1.3 Rising EO
- 12.1.3.1. Company Overview
- 12.1.3.2. Products
- 12.1.3.3. Company Financials
- 12.1.3.4. SWOT Analysis
- 12.1.4 Edmund Optics
- 12.1.4.1. Company Overview
- 12.1.4.2. Products
- 12.1.4.3. Company Financials
- 12.1.4.4. SWOT Analysis
- 12.1.5 Asahi Optical Company
- 12.1.5.1. Company Overview
- 12.1.5.2. Products
- 12.1.5.3. Company Financials
- 12.1.5.4. SWOT Analysis
- 12.1.6 Corning
- 12.1.6.1. Company Overview
- 12.1.6.2. Products
- 12.1.6.3. Company Financials
- 12.1.6.4. SWOT Analysis
- 12.1.1 ECOPTIK
- 12.2. Market Entropy
- 12.2.1 Company's Key Areas Served
- 12.2.2 Recent Developments
- 12.3. Company Market Share Analysis 2025
- 12.3.1 Top 5 Companies Market Share Analysis
- 12.3.2 Top 3 Companies Market Share Analysis
- 12.4. List of Potential Customers
- 13. Research Methodology
List of Figures
- Figure 1: Global Fused Silica Microlenses Revenue Breakdown (undefined, %) by Region 2025 & 2033
- Figure 2: Global Fused Silica Microlenses Volume Breakdown (K, %) by Region 2025 & 2033
- Figure 3: North America Fused Silica Microlenses Revenue (undefined), by Application 2025 & 2033
- Figure 4: North America Fused Silica Microlenses Volume (K), by Application 2025 & 2033
- Figure 5: North America Fused Silica Microlenses Revenue Share (%), by Application 2025 & 2033
- Figure 6: North America Fused Silica Microlenses Volume Share (%), by Application 2025 & 2033
- Figure 7: North America Fused Silica Microlenses Revenue (undefined), by Types 2025 & 2033
- Figure 8: North America Fused Silica Microlenses Volume (K), by Types 2025 & 2033
- Figure 9: North America Fused Silica Microlenses Revenue Share (%), by Types 2025 & 2033
- Figure 10: North America Fused Silica Microlenses Volume Share (%), by Types 2025 & 2033
- Figure 11: North America Fused Silica Microlenses Revenue (undefined), by Country 2025 & 2033
- Figure 12: North America Fused Silica Microlenses Volume (K), by Country 2025 & 2033
- Figure 13: North America Fused Silica Microlenses Revenue Share (%), by Country 2025 & 2033
- Figure 14: North America Fused Silica Microlenses Volume Share (%), by Country 2025 & 2033
- Figure 15: South America Fused Silica Microlenses Revenue (undefined), by Application 2025 & 2033
- Figure 16: South America Fused Silica Microlenses Volume (K), by Application 2025 & 2033
- Figure 17: South America Fused Silica Microlenses Revenue Share (%), by Application 2025 & 2033
- Figure 18: South America Fused Silica Microlenses Volume Share (%), by Application 2025 & 2033
- Figure 19: South America Fused Silica Microlenses Revenue (undefined), by Types 2025 & 2033
- Figure 20: South America Fused Silica Microlenses Volume (K), by Types 2025 & 2033
- Figure 21: South America Fused Silica Microlenses Revenue Share (%), by Types 2025 & 2033
- Figure 22: South America Fused Silica Microlenses Volume Share (%), by Types 2025 & 2033
- Figure 23: South America Fused Silica Microlenses Revenue (undefined), by Country 2025 & 2033
- Figure 24: South America Fused Silica Microlenses Volume (K), by Country 2025 & 2033
- Figure 25: South America Fused Silica Microlenses Revenue Share (%), by Country 2025 & 2033
- Figure 26: South America Fused Silica Microlenses Volume Share (%), by Country 2025 & 2033
- Figure 27: Europe Fused Silica Microlenses Revenue (undefined), by Application 2025 & 2033
- Figure 28: Europe Fused Silica Microlenses Volume (K), by Application 2025 & 2033
- Figure 29: Europe Fused Silica Microlenses Revenue Share (%), by Application 2025 & 2033
- Figure 30: Europe Fused Silica Microlenses Volume Share (%), by Application 2025 & 2033
- Figure 31: Europe Fused Silica Microlenses Revenue (undefined), by Types 2025 & 2033
- Figure 32: Europe Fused Silica Microlenses Volume (K), by Types 2025 & 2033
- Figure 33: Europe Fused Silica Microlenses Revenue Share (%), by Types 2025 & 2033
- Figure 34: Europe Fused Silica Microlenses Volume Share (%), by Types 2025 & 2033
- Figure 35: Europe Fused Silica Microlenses Revenue (undefined), by Country 2025 & 2033
- Figure 36: Europe Fused Silica Microlenses Volume (K), by Country 2025 & 2033
- Figure 37: Europe Fused Silica Microlenses Revenue Share (%), by Country 2025 & 2033
- Figure 38: Europe Fused Silica Microlenses Volume Share (%), by Country 2025 & 2033
- Figure 39: Middle East & Africa Fused Silica Microlenses Revenue (undefined), by Application 2025 & 2033
- Figure 40: Middle East & Africa Fused Silica Microlenses Volume (K), by Application 2025 & 2033
- Figure 41: Middle East & Africa Fused Silica Microlenses Revenue Share (%), by Application 2025 & 2033
- Figure 42: Middle East & Africa Fused Silica Microlenses Volume Share (%), by Application 2025 & 2033
- Figure 43: Middle East & Africa Fused Silica Microlenses Revenue (undefined), by Types 2025 & 2033
- Figure 44: Middle East & Africa Fused Silica Microlenses Volume (K), by Types 2025 & 2033
- Figure 45: Middle East & Africa Fused Silica Microlenses Revenue Share (%), by Types 2025 & 2033
- Figure 46: Middle East & Africa Fused Silica Microlenses Volume Share (%), by Types 2025 & 2033
- Figure 47: Middle East & Africa Fused Silica Microlenses Revenue (undefined), by Country 2025 & 2033
- Figure 48: Middle East & Africa Fused Silica Microlenses Volume (K), by Country 2025 & 2033
- Figure 49: Middle East & Africa Fused Silica Microlenses Revenue Share (%), by Country 2025 & 2033
- Figure 50: Middle East & Africa Fused Silica Microlenses Volume Share (%), by Country 2025 & 2033
- Figure 51: Asia Pacific Fused Silica Microlenses Revenue (undefined), by Application 2025 & 2033
- Figure 52: Asia Pacific Fused Silica Microlenses Volume (K), by Application 2025 & 2033
- Figure 53: Asia Pacific Fused Silica Microlenses Revenue Share (%), by Application 2025 & 2033
- Figure 54: Asia Pacific Fused Silica Microlenses Volume Share (%), by Application 2025 & 2033
- Figure 55: Asia Pacific Fused Silica Microlenses Revenue (undefined), by Types 2025 & 2033
- Figure 56: Asia Pacific Fused Silica Microlenses Volume (K), by Types 2025 & 2033
- Figure 57: Asia Pacific Fused Silica Microlenses Revenue Share (%), by Types 2025 & 2033
- Figure 58: Asia Pacific Fused Silica Microlenses Volume Share (%), by Types 2025 & 2033
- Figure 59: Asia Pacific Fused Silica Microlenses Revenue (undefined), by Country 2025 & 2033
- Figure 60: Asia Pacific Fused Silica Microlenses Volume (K), by Country 2025 & 2033
- Figure 61: Asia Pacific Fused Silica Microlenses Revenue Share (%), by Country 2025 & 2033
- Figure 62: Asia Pacific Fused Silica Microlenses Volume Share (%), by Country 2025 & 2033
List of Tables
- Table 1: Global Fused Silica Microlenses Revenue undefined Forecast, by Application 2020 & 2033
- Table 2: Global Fused Silica Microlenses Volume K Forecast, by Application 2020 & 2033
- Table 3: Global Fused Silica Microlenses Revenue undefined Forecast, by Types 2020 & 2033
- Table 4: Global Fused Silica Microlenses Volume K Forecast, by Types 2020 & 2033
- Table 5: Global Fused Silica Microlenses Revenue undefined Forecast, by Region 2020 & 2033
- Table 6: Global Fused Silica Microlenses Volume K Forecast, by Region 2020 & 2033
- Table 7: Global Fused Silica Microlenses Revenue undefined Forecast, by Application 2020 & 2033
- Table 8: Global Fused Silica Microlenses Volume K Forecast, by Application 2020 & 2033
- Table 9: Global Fused Silica Microlenses Revenue undefined Forecast, by Types 2020 & 2033
- Table 10: Global Fused Silica Microlenses Volume K Forecast, by Types 2020 & 2033
- Table 11: Global Fused Silica Microlenses Revenue undefined Forecast, by Country 2020 & 2033
- Table 12: Global Fused Silica Microlenses Volume K Forecast, by Country 2020 & 2033
- Table 13: United States Fused Silica Microlenses Revenue (undefined) Forecast, by Application 2020 & 2033
- Table 14: United States Fused Silica Microlenses Volume (K) Forecast, by Application 2020 & 2033
- Table 15: Canada Fused Silica Microlenses Revenue (undefined) Forecast, by Application 2020 & 2033
- Table 16: Canada Fused Silica Microlenses Volume (K) Forecast, by Application 2020 & 2033
- Table 17: Mexico Fused Silica Microlenses Revenue (undefined) Forecast, by Application 2020 & 2033
- Table 18: Mexico Fused Silica Microlenses Volume (K) Forecast, by Application 2020 & 2033
- Table 19: Global Fused Silica Microlenses Revenue undefined Forecast, by Application 2020 & 2033
- Table 20: Global Fused Silica Microlenses Volume K Forecast, by Application 2020 & 2033
- Table 21: Global Fused Silica Microlenses Revenue undefined Forecast, by Types 2020 & 2033
- Table 22: Global Fused Silica Microlenses Volume K Forecast, by Types 2020 & 2033
- Table 23: Global Fused Silica Microlenses Revenue undefined Forecast, by Country 2020 & 2033
- Table 24: Global Fused Silica Microlenses Volume K Forecast, by Country 2020 & 2033
- Table 25: Brazil Fused Silica Microlenses Revenue (undefined) Forecast, by Application 2020 & 2033
- Table 26: Brazil Fused Silica Microlenses Volume (K) Forecast, by Application 2020 & 2033
- Table 27: Argentina Fused Silica Microlenses Revenue (undefined) Forecast, by Application 2020 & 2033
- Table 28: Argentina Fused Silica Microlenses Volume (K) Forecast, by Application 2020 & 2033
- Table 29: Rest of South America Fused Silica Microlenses Revenue (undefined) Forecast, by Application 2020 & 2033
- Table 30: Rest of South America Fused Silica Microlenses Volume (K) Forecast, by Application 2020 & 2033
- Table 31: Global Fused Silica Microlenses Revenue undefined Forecast, by Application 2020 & 2033
- Table 32: Global Fused Silica Microlenses Volume K Forecast, by Application 2020 & 2033
- Table 33: Global Fused Silica Microlenses Revenue undefined Forecast, by Types 2020 & 2033
- Table 34: Global Fused Silica Microlenses Volume K Forecast, by Types 2020 & 2033
- Table 35: Global Fused Silica Microlenses Revenue undefined Forecast, by Country 2020 & 2033
- Table 36: Global Fused Silica Microlenses Volume K Forecast, by Country 2020 & 2033
- Table 37: United Kingdom Fused Silica Microlenses Revenue (undefined) Forecast, by Application 2020 & 2033
- Table 38: United Kingdom Fused Silica Microlenses Volume (K) Forecast, by Application 2020 & 2033
- Table 39: Germany Fused Silica Microlenses Revenue (undefined) Forecast, by Application 2020 & 2033
- Table 40: Germany Fused Silica Microlenses Volume (K) Forecast, by Application 2020 & 2033
- Table 41: France Fused Silica Microlenses Revenue (undefined) Forecast, by Application 2020 & 2033
- Table 42: France Fused Silica Microlenses Volume (K) Forecast, by Application 2020 & 2033
- Table 43: Italy Fused Silica Microlenses Revenue (undefined) Forecast, by Application 2020 & 2033
- Table 44: Italy Fused Silica Microlenses Volume (K) Forecast, by Application 2020 & 2033
- Table 45: Spain Fused Silica Microlenses Revenue (undefined) Forecast, by Application 2020 & 2033
- Table 46: Spain Fused Silica Microlenses Volume (K) Forecast, by Application 2020 & 2033
- Table 47: Russia Fused Silica Microlenses Revenue (undefined) Forecast, by Application 2020 & 2033
- Table 48: Russia Fused Silica Microlenses Volume (K) Forecast, by Application 2020 & 2033
- Table 49: Benelux Fused Silica Microlenses Revenue (undefined) Forecast, by Application 2020 & 2033
- Table 50: Benelux Fused Silica Microlenses Volume (K) Forecast, by Application 2020 & 2033
- Table 51: Nordics Fused Silica Microlenses Revenue (undefined) Forecast, by Application 2020 & 2033
- Table 52: Nordics Fused Silica Microlenses Volume (K) Forecast, by Application 2020 & 2033
- Table 53: Rest of Europe Fused Silica Microlenses Revenue (undefined) Forecast, by Application 2020 & 2033
- Table 54: Rest of Europe Fused Silica Microlenses Volume (K) Forecast, by Application 2020 & 2033
- Table 55: Global Fused Silica Microlenses Revenue undefined Forecast, by Application 2020 & 2033
- Table 56: Global Fused Silica Microlenses Volume K Forecast, by Application 2020 & 2033
- Table 57: Global Fused Silica Microlenses Revenue undefined Forecast, by Types 2020 & 2033
- Table 58: Global Fused Silica Microlenses Volume K Forecast, by Types 2020 & 2033
- Table 59: Global Fused Silica Microlenses Revenue undefined Forecast, by Country 2020 & 2033
- Table 60: Global Fused Silica Microlenses Volume K Forecast, by Country 2020 & 2033
- Table 61: Turkey Fused Silica Microlenses Revenue (undefined) Forecast, by Application 2020 & 2033
- Table 62: Turkey Fused Silica Microlenses Volume (K) Forecast, by Application 2020 & 2033
- Table 63: Israel Fused Silica Microlenses Revenue (undefined) Forecast, by Application 2020 & 2033
- Table 64: Israel Fused Silica Microlenses Volume (K) Forecast, by Application 2020 & 2033
- Table 65: GCC Fused Silica Microlenses Revenue (undefined) Forecast, by Application 2020 & 2033
- Table 66: GCC Fused Silica Microlenses Volume (K) Forecast, by Application 2020 & 2033
- Table 67: North Africa Fused Silica Microlenses Revenue (undefined) Forecast, by Application 2020 & 2033
- Table 68: North Africa Fused Silica Microlenses Volume (K) Forecast, by Application 2020 & 2033
- Table 69: South Africa Fused Silica Microlenses Revenue (undefined) Forecast, by Application 2020 & 2033
- Table 70: South Africa Fused Silica Microlenses Volume (K) Forecast, by Application 2020 & 2033
- Table 71: Rest of Middle East & Africa Fused Silica Microlenses Revenue (undefined) Forecast, by Application 2020 & 2033
- Table 72: Rest of Middle East & Africa Fused Silica Microlenses Volume (K) Forecast, by Application 2020 & 2033
- Table 73: Global Fused Silica Microlenses Revenue undefined Forecast, by Application 2020 & 2033
- Table 74: Global Fused Silica Microlenses Volume K Forecast, by Application 2020 & 2033
- Table 75: Global Fused Silica Microlenses Revenue undefined Forecast, by Types 2020 & 2033
- Table 76: Global Fused Silica Microlenses Volume K Forecast, by Types 2020 & 2033
- Table 77: Global Fused Silica Microlenses Revenue undefined Forecast, by Country 2020 & 2033
- Table 78: Global Fused Silica Microlenses Volume K Forecast, by Country 2020 & 2033
- Table 79: China Fused Silica Microlenses Revenue (undefined) Forecast, by Application 2020 & 2033
- Table 80: China Fused Silica Microlenses Volume (K) Forecast, by Application 2020 & 2033
- Table 81: India Fused Silica Microlenses Revenue (undefined) Forecast, by Application 2020 & 2033
- Table 82: India Fused Silica Microlenses Volume (K) Forecast, by Application 2020 & 2033
- Table 83: Japan Fused Silica Microlenses Revenue (undefined) Forecast, by Application 2020 & 2033
- Table 84: Japan Fused Silica Microlenses Volume (K) Forecast, by Application 2020 & 2033
- Table 85: South Korea Fused Silica Microlenses Revenue (undefined) Forecast, by Application 2020 & 2033
- Table 86: South Korea Fused Silica Microlenses Volume (K) Forecast, by Application 2020 & 2033
- Table 87: ASEAN Fused Silica Microlenses Revenue (undefined) Forecast, by Application 2020 & 2033
- Table 88: ASEAN Fused Silica Microlenses Volume (K) Forecast, by Application 2020 & 2033
- Table 89: Oceania Fused Silica Microlenses Revenue (undefined) Forecast, by Application 2020 & 2033
- Table 90: Oceania Fused Silica Microlenses Volume (K) Forecast, by Application 2020 & 2033
- Table 91: Rest of Asia Pacific Fused Silica Microlenses Revenue (undefined) Forecast, by Application 2020 & 2033
- Table 92: Rest of Asia Pacific Fused Silica Microlenses Volume (K) Forecast, by Application 2020 & 2033
Frequently Asked Questions
1. What is the projected Compound Annual Growth Rate (CAGR) of the Fused Silica Microlenses?
The projected CAGR is approximately 6.55%.
2. Which companies are prominent players in the Fused Silica Microlenses?
Key companies in the market include ECOPTIK, Hobbite, Rising EO, Edmund Optics, Asahi Optical Company, Corning.
3. What are the main segments of the Fused Silica Microlenses?
The market segments include Application, Types.
4. Can you provide details about the market size?
The market size is estimated to be USD XXX N/A as of 2022.
5. What are some drivers contributing to market growth?
N/A
6. What are the notable trends driving market growth?
N/A
7. Are there any restraints impacting market growth?
N/A
8. Can you provide examples of recent developments in the market?
N/A
9. What pricing options are available for accessing the report?
Pricing options include single-user, multi-user, and enterprise licenses priced at USD 4350.00, USD 6525.00, and USD 8700.00 respectively.
10. Is the market size provided in terms of value or volume?
The market size is provided in terms of value, measured in N/A and volume, measured in K.
11. Are there any specific market keywords associated with the report?
Yes, the market keyword associated with the report is "Fused Silica Microlenses," which aids in identifying and referencing the specific market segment covered.
12. How do I determine which pricing option suits my needs best?
The pricing options vary based on user requirements and access needs. Individual users may opt for single-user licenses, while businesses requiring broader access may choose multi-user or enterprise licenses for cost-effective access to the report.
13. Are there any additional resources or data provided in the Fused Silica Microlenses report?
While the report offers comprehensive insights, it's advisable to review the specific contents or supplementary materials provided to ascertain if additional resources or data are available.
14. How can I stay updated on further developments or reports in the Fused Silica Microlenses?
To stay informed about further developments, trends, and reports in the Fused Silica Microlenses, consider subscribing to industry newsletters, following relevant companies and organizations, or regularly checking reputable industry news sources and publications.
Methodology
Step 1 - Identification of Relevant Samples Size from Population Database


Step 2 - Approaches for Defining Global Market Size (Value, Volume* & Price*)

Note*: In applicable scenarios
Step 3 - Data Sources
Primary Research
- Web Analytics
- Survey Reports
- Research Institute
- Latest Research Reports
- Opinion Leaders
Secondary Research
- Annual Reports
- White Paper
- Latest Press Release
- Industry Association
- Paid Database
- Investor Presentations

Step 4 - Data Triangulation
Involves using different sources of information in order to increase the validity of a study
These sources are likely to be stakeholders in a program - participants, other researchers, program staff, other community members, and so on.
Then we put all data in single framework & apply various statistical tools to find out the dynamic on the market.
During the analysis stage, feedback from the stakeholder groups would be compared to determine areas of agreement as well as areas of divergence