

Key Insights
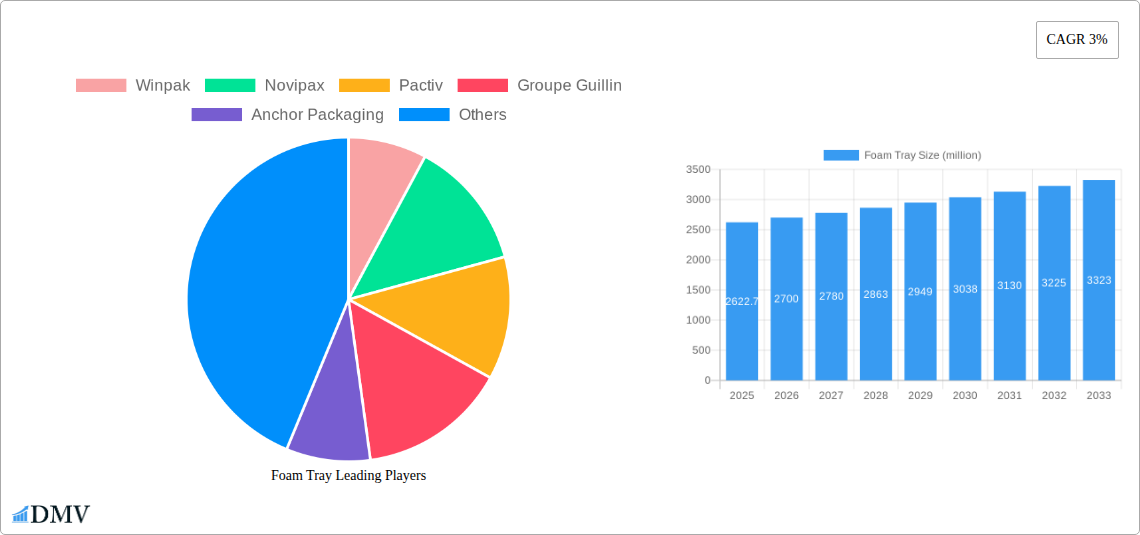
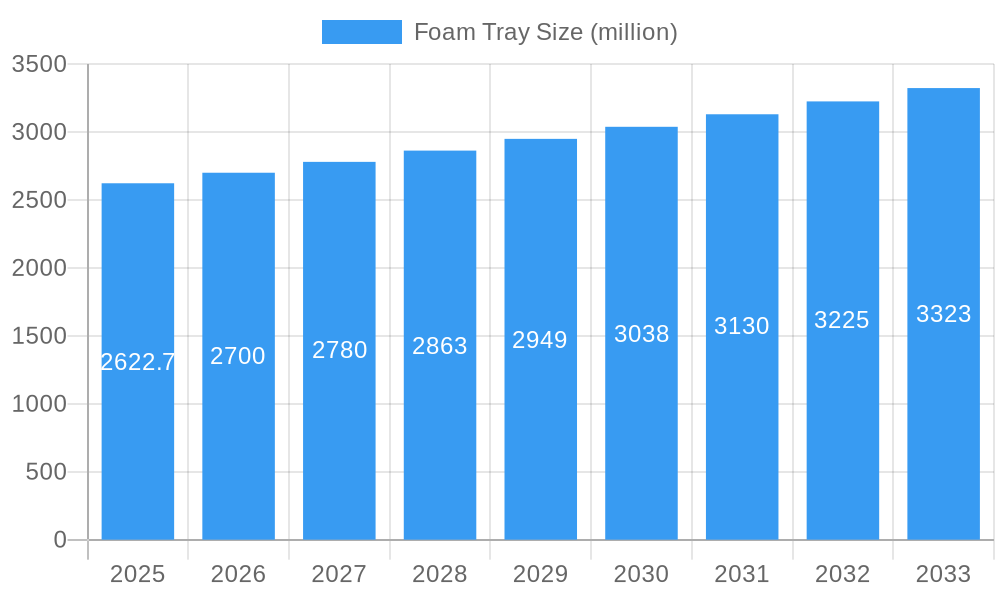
The global foam tray market, valued at $2.72 billion in 2025, is poised for robust expansion. Key growth drivers include escalating demand from the food and beverage sector, particularly for convenient ready-to-eat meals and fresh produce packaging. The inherent advantages of foam trays—affordability, effective cushioning, and convenience—underpin their widespread adoption. Furthermore, the burgeoning e-commerce landscape and the necessity for secure, protective packaging in online grocery delivery services are significantly accelerating market growth. While environmental considerations surrounding polystyrene foam present a challenge, the industry is actively transitioning towards sustainable alternatives, such as biodegradable and compostable foam trays derived from plant-based materials. Innovations in foam tray design and manufacturing processes, coupled with this sustainability trend, will shape the market's future trajectory. Major industry participants, including Winpak, Novipax, Pactiv, and Dart Container, are strategically investing in research and development to align with evolving consumer preferences and stringent environmental regulations for sustainable packaging solutions.
Foam Tray Market Size (In Billion)
The projected Compound Annual Growth Rate (CAGR) stands at 4.3%, indicating consistent market expansion through 2033. This growth rate reflects a balance between the enduring demand for cost-effective and efficient packaging solutions and the increasing imperative for sustainable practices. Variations in regional growth are anticipated, with mature markets potentially experiencing slower expansion due to saturation and stricter environmental mandates, while emerging economies are expected to witness more substantial growth, driven by rising disposable incomes and increased consumption of packaged goods. Market segmentation, encompassing foam types (e.g., polystyrene, polyethylene), applications (e.g., food packaging, industrial packaging), and end-use sectors (e.g., food service, retail), is crucial for a granular understanding of market dynamics and growth catalysts.
Foam Tray Company Market Share
Foam Tray Market Report: A Comprehensive Analysis of a Multi-Million Dollar Industry (2019-2033)
This insightful report provides a comprehensive analysis of the global foam tray market, projecting a multi-million dollar valuation by 2033. The study meticulously examines market dynamics, competitive landscapes, and future growth trajectories, offering invaluable insights for stakeholders across the value chain. Utilizing data from the historical period (2019-2024), base year (2025), and forecast period (2025-2033), this report is an essential resource for strategic decision-making. The global market size is estimated at XX million in 2025 and is projected to reach XX million by 2033.
Foam Tray Market Composition & Trends
This section delves into the intricate structure of the foam tray market, analyzing its concentration, innovation drivers, regulatory landscape, substitute products, end-user profiles, and merger & acquisition (M&A) activities. The market is moderately concentrated, with key players such as Winpak, Novipax, and Pactiv holding significant market share. The exact market share distribution among these players in 2025 is estimated to be: Winpak (XX%), Novipax (XX%), Pactiv (XX%), and others (XX%). Innovation is primarily driven by the need for sustainable and eco-friendly alternatives, leading to the development of biodegradable and compostable foam trays. Stringent environmental regulations are shaping the industry, prompting manufacturers to adopt sustainable practices. Significant M&A activities, with a total deal value exceeding XX million in the past five years, indicate industry consolidation and expansion efforts.
- Market Concentration: Moderately concentrated, with top 3 players holding approximately XX% of market share in 2025.
- Innovation Catalysts: Growing demand for sustainable alternatives and advancements in biodegradable materials.
- Regulatory Landscape: Stringent environmental regulations driving adoption of eco-friendly solutions.
- Substitute Products: Paperboard, molded pulp, and other bio-based alternatives pose a competitive threat.
- End-User Profiles: Food and beverage industry is the primary end-user, followed by healthcare and other sectors.
- M&A Activities: Significant consolidation, with total deal value exceeding XX million over the past 5 years (2019-2024).
Foam Tray Industry Evolution
This section traces the evolution of the foam tray industry, examining growth trajectories, technological advancements, and evolving consumer preferences from 2019 to 2033. The industry has witnessed robust growth, fueled by rising demand from the food service and healthcare sectors. Technological advancements, such as the development of improved insulation properties and lighter weight materials, have further propelled market growth. Consumer preference shifts towards convenience and sustainability are driving adoption of innovative foam tray solutions. The Compound Annual Growth Rate (CAGR) for the period 2019-2024 is estimated at XX%, while the projected CAGR for 2025-2033 is XX%. The adoption rate of biodegradable foam trays is currently at XX% and is expected to reach XX% by 2033.
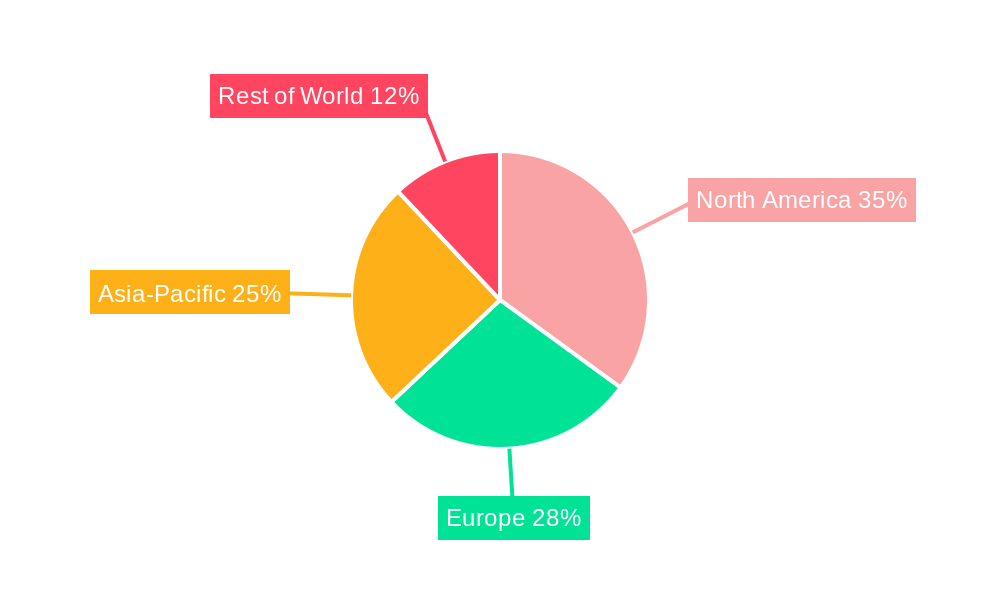
Leading Regions, Countries, or Segments in Foam Tray
This section identifies the leading regions and segments within the global foam tray market. North America currently dominates the market due to robust demand from the food service industry and substantial investment in advanced manufacturing facilities. This dominance is further strengthened by favorable regulatory frameworks supporting innovation.
- Key Drivers for North American Dominance:
- High demand from the food service industry.
- Significant investment in advanced manufacturing technologies.
- Supportive regulatory environment.
The strong presence of major players in North America further contributes to its market leadership. The report offers a detailed analysis of the contributing factors to North America's dominance, including consumer preference, distribution channels, and economic growth.
Foam Tray Product Innovations
Recent innovations in foam tray technology include the development of lightweight, high-performance trays with improved insulation properties and enhanced barrier characteristics. The integration of biodegradable and compostable materials significantly reduces environmental impact. These advancements cater to the growing consumer demand for sustainable and eco-friendly packaging solutions. Unique selling propositions (USPs) of these newer trays often involve improved strength, reduced weight, better insulation, and compostability.
Propelling Factors for Foam Tray Growth
The foam tray market's growth is driven by several key factors. The expanding food service industry and increasing demand for convenient packaging are primary drivers. Technological advancements, particularly in sustainable materials, further fuel growth. Favorable regulatory environments in certain regions also contribute to market expansion. Increased disposable income and rising consumer spending on packaged food products are also notable factors.
Obstacles in the Foam Tray Market
The foam tray market faces challenges such as stringent environmental regulations, which increase manufacturing costs and limit the use of certain materials. Fluctuations in raw material prices also pose a significant risk, potentially impacting production costs. Intense competition among established players and the emergence of new substitutes also present ongoing challenges. These factors can lead to price instability and reduced profit margins for businesses in the sector.
Future Opportunities in Foam Tray
Future opportunities lie in the development and adoption of advanced sustainable materials, such as bio-based polymers and compostable foams. Expansion into new markets, particularly in developing economies with growing food service sectors, presents significant potential. Furthermore, the integration of smart packaging technologies, including RFID and sensors, offers opportunities to enhance product traceability and improve supply chain efficiency.
Major Players in the Foam Tray Ecosystem
- Winpak
- Novipax
- Pactiv
- Groupe Guillin
- Anchor Packaging
- Coopbox Group
- Coveris
- Dart Container
- D&W Fine Pack
- Ecopax
- Genpak
- Placon
- Sirap Group
Key Developments in Foam Tray Industry
- 2022 Q3: Winpak launched a new line of compostable foam trays.
- 2023 Q1: Novipax acquired a smaller competitor, expanding its market share.
- 2024 Q2: New environmental regulations were implemented in the EU, impacting foam tray production. (Further specific developments with dates and impact need to be added here based on your data.)
Strategic Foam Tray Market Forecast
The foam tray market is poised for continued growth, driven by the increasing demand for sustainable packaging solutions and the expansion of the food service industry globally. Innovation in biodegradable materials and the adoption of advanced manufacturing technologies will further shape market dynamics. The forecast suggests a significant market expansion over the next decade, presenting substantial opportunities for established players and new entrants alike. The market's future growth will hinge on the successful development and adoption of environmentally friendly alternatives and the continuous innovation to meet ever-evolving consumer needs and preferences.
Foam Tray Segmentation
-
1. Application
- 1.1. Food Packaging
- 1.2. Industrial Packaging
- 1.3. Medicine Packaging
-
2. Types
- 2.1. Polystyrene Foam Tray
- 2.2. Polyethylene Foam Tray
- 2.3. Polypropylene Foam Tray
Foam Tray Segmentation By Geography
-
1. North America
- 1.1. United States
- 1.2. Canada
- 1.3. Mexico
-
2. South America
- 2.1. Brazil
- 2.2. Argentina
- 2.3. Rest of South America
-
3. Europe
- 3.1. United Kingdom
- 3.2. Germany
- 3.3. France
- 3.4. Italy
- 3.5. Spain
- 3.6. Russia
- 3.7. Benelux
- 3.8. Nordics
- 3.9. Rest of Europe
-
4. Middle East & Africa
- 4.1. Turkey
- 4.2. Israel
- 4.3. GCC
- 4.4. North Africa
- 4.5. South Africa
- 4.6. Rest of Middle East & Africa
-
5. Asia Pacific
- 5.1. China
- 5.2. India
- 5.3. Japan
- 5.4. South Korea
- 5.5. ASEAN
- 5.6. Oceania
- 5.7. Rest of Asia Pacific
Foam Tray Regional Market Share
Geographic Coverage of Foam Tray
Foam Tray REPORT HIGHLIGHTS
| Aspects | Details |
|---|---|
| Study Period | 2020-2034 |
| Base Year | 2025 |
| Estimated Year | 2026 |
| Forecast Period | 2026-2034 |
| Historical Period | 2020-2025 |
| Growth Rate | CAGR of 4.3% from 2020-2034 |
| Segmentation |
|
Table of Contents
- 1. Introduction
- 1.1. Research Scope
- 1.2. Market Segmentation
- 1.3. Research Objective
- 1.4. Definitions and Assumptions
- 2. Executive Summary
- 2.1. Market Snapshot
- 3. Market Dynamics
- 3.1. Market Drivers
- 3.2. Market Restrains
- 3.3. Market Trends
- 3.4. Market Opportunities
- 4. Market Factor Analysis
- 4.1. Porters Five Forces
- 4.1.1. Bargaining Power of Suppliers
- 4.1.2. Bargaining Power of Buyers
- 4.1.3. Threat of New Entrants
- 4.1.4. Threat of Substitutes
- 4.1.5. Competitive Rivalry
- 4.2. PESTEL analysis
- 4.3. BCG Analysis
- 4.3.1. Stars (High Growth, High Market Share)
- 4.3.2. Cash Cows (Low Growth, High Market Share)
- 4.3.3. Question Mark (High Growth, Low Market Share)
- 4.3.4. Dogs (Low Growth, Low Market Share)
- 4.4. Ansoff Matrix Analysis
- 4.5. Supply Chain Analysis
- 4.6. Regulatory Landscape
- 4.7. Current Market Potential and Opportunity Assessment (TAM–SAM–SOM Framework)
- 4.8. DMV Analyst Note
- 4.1. Porters Five Forces
- 5. Market Analysis, Insights and Forecast 2021-2033
- 5.1. Market Analysis, Insights and Forecast - by Application
- 5.1.1. Food Packaging
- 5.1.2. Industrial Packaging
- 5.1.3. Medicine Packaging
- 5.2. Market Analysis, Insights and Forecast - by Types
- 5.2.1. Polystyrene Foam Tray
- 5.2.2. Polyethylene Foam Tray
- 5.2.3. Polypropylene Foam Tray
- 5.3. Market Analysis, Insights and Forecast - by Region
- 5.3.1. North America
- 5.3.2. South America
- 5.3.3. Europe
- 5.3.4. Middle East & Africa
- 5.3.5. Asia Pacific
- 5.1. Market Analysis, Insights and Forecast - by Application
- 6. Global Foam Tray Analysis, Insights and Forecast, 2021-2033
- 6.1. Market Analysis, Insights and Forecast - by Application
- 6.1.1. Food Packaging
- 6.1.2. Industrial Packaging
- 6.1.3. Medicine Packaging
- 6.2. Market Analysis, Insights and Forecast - by Types
- 6.2.1. Polystyrene Foam Tray
- 6.2.2. Polyethylene Foam Tray
- 6.2.3. Polypropylene Foam Tray
- 6.1. Market Analysis, Insights and Forecast - by Application
- 7. North America Foam Tray Analysis, Insights and Forecast, 2020-2032
- 7.1. Market Analysis, Insights and Forecast - by Application
- 7.1.1. Food Packaging
- 7.1.2. Industrial Packaging
- 7.1.3. Medicine Packaging
- 7.2. Market Analysis, Insights and Forecast - by Types
- 7.2.1. Polystyrene Foam Tray
- 7.2.2. Polyethylene Foam Tray
- 7.2.3. Polypropylene Foam Tray
- 7.1. Market Analysis, Insights and Forecast - by Application
- 8. South America Foam Tray Analysis, Insights and Forecast, 2020-2032
- 8.1. Market Analysis, Insights and Forecast - by Application
- 8.1.1. Food Packaging
- 8.1.2. Industrial Packaging
- 8.1.3. Medicine Packaging
- 8.2. Market Analysis, Insights and Forecast - by Types
- 8.2.1. Polystyrene Foam Tray
- 8.2.2. Polyethylene Foam Tray
- 8.2.3. Polypropylene Foam Tray
- 8.1. Market Analysis, Insights and Forecast - by Application
- 9. Europe Foam Tray Analysis, Insights and Forecast, 2020-2032
- 9.1. Market Analysis, Insights and Forecast - by Application
- 9.1.1. Food Packaging
- 9.1.2. Industrial Packaging
- 9.1.3. Medicine Packaging
- 9.2. Market Analysis, Insights and Forecast - by Types
- 9.2.1. Polystyrene Foam Tray
- 9.2.2. Polyethylene Foam Tray
- 9.2.3. Polypropylene Foam Tray
- 9.1. Market Analysis, Insights and Forecast - by Application
- 10. Middle East & Africa Foam Tray Analysis, Insights and Forecast, 2020-2032
- 10.1. Market Analysis, Insights and Forecast - by Application
- 10.1.1. Food Packaging
- 10.1.2. Industrial Packaging
- 10.1.3. Medicine Packaging
- 10.2. Market Analysis, Insights and Forecast - by Types
- 10.2.1. Polystyrene Foam Tray
- 10.2.2. Polyethylene Foam Tray
- 10.2.3. Polypropylene Foam Tray
- 10.1. Market Analysis, Insights and Forecast - by Application
- 11. Asia Pacific Foam Tray Analysis, Insights and Forecast, 2020-2032
- 11.1. Market Analysis, Insights and Forecast - by Application
- 11.1.1. Food Packaging
- 11.1.2. Industrial Packaging
- 11.1.3. Medicine Packaging
- 11.2. Market Analysis, Insights and Forecast - by Types
- 11.2.1. Polystyrene Foam Tray
- 11.2.2. Polyethylene Foam Tray
- 11.2.3. Polypropylene Foam Tray
- 11.1. Market Analysis, Insights and Forecast - by Application
- 12. Competitive Analysis
- 12.1. Company Profiles
- 12.1.1 Winpak
- 12.1.1.1. Company Overview
- 12.1.1.2. Products
- 12.1.1.3. Company Financials
- 12.1.1.4. SWOT Analysis
- 12.1.2 Novipax
- 12.1.2.1. Company Overview
- 12.1.2.2. Products
- 12.1.2.3. Company Financials
- 12.1.2.4. SWOT Analysis
- 12.1.3 Pactiv
- 12.1.3.1. Company Overview
- 12.1.3.2. Products
- 12.1.3.3. Company Financials
- 12.1.3.4. SWOT Analysis
- 12.1.4 Groupe Guillin
- 12.1.4.1. Company Overview
- 12.1.4.2. Products
- 12.1.4.3. Company Financials
- 12.1.4.4. SWOT Analysis
- 12.1.5 Anchor Packaging
- 12.1.5.1. Company Overview
- 12.1.5.2. Products
- 12.1.5.3. Company Financials
- 12.1.5.4. SWOT Analysis
- 12.1.6 Coopbox Group
- 12.1.6.1. Company Overview
- 12.1.6.2. Products
- 12.1.6.3. Company Financials
- 12.1.6.4. SWOT Analysis
- 12.1.7 Coveris
- 12.1.7.1. Company Overview
- 12.1.7.2. Products
- 12.1.7.3. Company Financials
- 12.1.7.4. SWOT Analysis
- 12.1.8 Dart Container
- 12.1.8.1. Company Overview
- 12.1.8.2. Products
- 12.1.8.3. Company Financials
- 12.1.8.4. SWOT Analysis
- 12.1.9 D&W Fine Pack
- 12.1.9.1. Company Overview
- 12.1.9.2. Products
- 12.1.9.3. Company Financials
- 12.1.9.4. SWOT Analysis
- 12.1.10 Ecopax
- 12.1.10.1. Company Overview
- 12.1.10.2. Products
- 12.1.10.3. Company Financials
- 12.1.10.4. SWOT Analysis
- 12.1.11 Genpak
- 12.1.11.1. Company Overview
- 12.1.11.2. Products
- 12.1.11.3. Company Financials
- 12.1.11.4. SWOT Analysis
- 12.1.12 Placon
- 12.1.12.1. Company Overview
- 12.1.12.2. Products
- 12.1.12.3. Company Financials
- 12.1.12.4. SWOT Analysis
- 12.1.13 Sirap Group
- 12.1.13.1. Company Overview
- 12.1.13.2. Products
- 12.1.13.3. Company Financials
- 12.1.13.4. SWOT Analysis
- 12.1.1 Winpak
- 12.2. Market Entropy
- 12.2.1 Company's Key Areas Served
- 12.2.2 Recent Developments
- 12.3. Company Market Share Analysis 2025
- 12.3.1 Top 5 Companies Market Share Analysis
- 12.3.2 Top 3 Companies Market Share Analysis
- 12.4. List of Potential Customers
- 13. Research Methodology
List of Figures
- Figure 1: Global Foam Tray Revenue Breakdown (billion, %) by Region 2025 & 2033
- Figure 2: North America Foam Tray Revenue (billion), by Application 2025 & 2033
- Figure 3: North America Foam Tray Revenue Share (%), by Application 2025 & 2033
- Figure 4: North America Foam Tray Revenue (billion), by Types 2025 & 2033
- Figure 5: North America Foam Tray Revenue Share (%), by Types 2025 & 2033
- Figure 6: North America Foam Tray Revenue (billion), by Country 2025 & 2033
- Figure 7: North America Foam Tray Revenue Share (%), by Country 2025 & 2033
- Figure 8: South America Foam Tray Revenue (billion), by Application 2025 & 2033
- Figure 9: South America Foam Tray Revenue Share (%), by Application 2025 & 2033
- Figure 10: South America Foam Tray Revenue (billion), by Types 2025 & 2033
- Figure 11: South America Foam Tray Revenue Share (%), by Types 2025 & 2033
- Figure 12: South America Foam Tray Revenue (billion), by Country 2025 & 2033
- Figure 13: South America Foam Tray Revenue Share (%), by Country 2025 & 2033
- Figure 14: Europe Foam Tray Revenue (billion), by Application 2025 & 2033
- Figure 15: Europe Foam Tray Revenue Share (%), by Application 2025 & 2033
- Figure 16: Europe Foam Tray Revenue (billion), by Types 2025 & 2033
- Figure 17: Europe Foam Tray Revenue Share (%), by Types 2025 & 2033
- Figure 18: Europe Foam Tray Revenue (billion), by Country 2025 & 2033
- Figure 19: Europe Foam Tray Revenue Share (%), by Country 2025 & 2033
- Figure 20: Middle East & Africa Foam Tray Revenue (billion), by Application 2025 & 2033
- Figure 21: Middle East & Africa Foam Tray Revenue Share (%), by Application 2025 & 2033
- Figure 22: Middle East & Africa Foam Tray Revenue (billion), by Types 2025 & 2033
- Figure 23: Middle East & Africa Foam Tray Revenue Share (%), by Types 2025 & 2033
- Figure 24: Middle East & Africa Foam Tray Revenue (billion), by Country 2025 & 2033
- Figure 25: Middle East & Africa Foam Tray Revenue Share (%), by Country 2025 & 2033
- Figure 26: Asia Pacific Foam Tray Revenue (billion), by Application 2025 & 2033
- Figure 27: Asia Pacific Foam Tray Revenue Share (%), by Application 2025 & 2033
- Figure 28: Asia Pacific Foam Tray Revenue (billion), by Types 2025 & 2033
- Figure 29: Asia Pacific Foam Tray Revenue Share (%), by Types 2025 & 2033
- Figure 30: Asia Pacific Foam Tray Revenue (billion), by Country 2025 & 2033
- Figure 31: Asia Pacific Foam Tray Revenue Share (%), by Country 2025 & 2033
List of Tables
- Table 1: Global Foam Tray Revenue billion Forecast, by Application 2020 & 2033
- Table 2: Global Foam Tray Revenue billion Forecast, by Types 2020 & 2033
- Table 3: Global Foam Tray Revenue billion Forecast, by Region 2020 & 2033
- Table 4: Global Foam Tray Revenue billion Forecast, by Application 2020 & 2033
- Table 5: Global Foam Tray Revenue billion Forecast, by Types 2020 & 2033
- Table 6: Global Foam Tray Revenue billion Forecast, by Country 2020 & 2033
- Table 7: United States Foam Tray Revenue (billion) Forecast, by Application 2020 & 2033
- Table 8: Canada Foam Tray Revenue (billion) Forecast, by Application 2020 & 2033
- Table 9: Mexico Foam Tray Revenue (billion) Forecast, by Application 2020 & 2033
- Table 10: Global Foam Tray Revenue billion Forecast, by Application 2020 & 2033
- Table 11: Global Foam Tray Revenue billion Forecast, by Types 2020 & 2033
- Table 12: Global Foam Tray Revenue billion Forecast, by Country 2020 & 2033
- Table 13: Brazil Foam Tray Revenue (billion) Forecast, by Application 2020 & 2033
- Table 14: Argentina Foam Tray Revenue (billion) Forecast, by Application 2020 & 2033
- Table 15: Rest of South America Foam Tray Revenue (billion) Forecast, by Application 2020 & 2033
- Table 16: Global Foam Tray Revenue billion Forecast, by Application 2020 & 2033
- Table 17: Global Foam Tray Revenue billion Forecast, by Types 2020 & 2033
- Table 18: Global Foam Tray Revenue billion Forecast, by Country 2020 & 2033
- Table 19: United Kingdom Foam Tray Revenue (billion) Forecast, by Application 2020 & 2033
- Table 20: Germany Foam Tray Revenue (billion) Forecast, by Application 2020 & 2033
- Table 21: France Foam Tray Revenue (billion) Forecast, by Application 2020 & 2033
- Table 22: Italy Foam Tray Revenue (billion) Forecast, by Application 2020 & 2033
- Table 23: Spain Foam Tray Revenue (billion) Forecast, by Application 2020 & 2033
- Table 24: Russia Foam Tray Revenue (billion) Forecast, by Application 2020 & 2033
- Table 25: Benelux Foam Tray Revenue (billion) Forecast, by Application 2020 & 2033
- Table 26: Nordics Foam Tray Revenue (billion) Forecast, by Application 2020 & 2033
- Table 27: Rest of Europe Foam Tray Revenue (billion) Forecast, by Application 2020 & 2033
- Table 28: Global Foam Tray Revenue billion Forecast, by Application 2020 & 2033
- Table 29: Global Foam Tray Revenue billion Forecast, by Types 2020 & 2033
- Table 30: Global Foam Tray Revenue billion Forecast, by Country 2020 & 2033
- Table 31: Turkey Foam Tray Revenue (billion) Forecast, by Application 2020 & 2033
- Table 32: Israel Foam Tray Revenue (billion) Forecast, by Application 2020 & 2033
- Table 33: GCC Foam Tray Revenue (billion) Forecast, by Application 2020 & 2033
- Table 34: North Africa Foam Tray Revenue (billion) Forecast, by Application 2020 & 2033
- Table 35: South Africa Foam Tray Revenue (billion) Forecast, by Application 2020 & 2033
- Table 36: Rest of Middle East & Africa Foam Tray Revenue (billion) Forecast, by Application 2020 & 2033
- Table 37: Global Foam Tray Revenue billion Forecast, by Application 2020 & 2033
- Table 38: Global Foam Tray Revenue billion Forecast, by Types 2020 & 2033
- Table 39: Global Foam Tray Revenue billion Forecast, by Country 2020 & 2033
- Table 40: China Foam Tray Revenue (billion) Forecast, by Application 2020 & 2033
- Table 41: India Foam Tray Revenue (billion) Forecast, by Application 2020 & 2033
- Table 42: Japan Foam Tray Revenue (billion) Forecast, by Application 2020 & 2033
- Table 43: South Korea Foam Tray Revenue (billion) Forecast, by Application 2020 & 2033
- Table 44: ASEAN Foam Tray Revenue (billion) Forecast, by Application 2020 & 2033
- Table 45: Oceania Foam Tray Revenue (billion) Forecast, by Application 2020 & 2033
- Table 46: Rest of Asia Pacific Foam Tray Revenue (billion) Forecast, by Application 2020 & 2033
Frequently Asked Questions
1. What is the projected Compound Annual Growth Rate (CAGR) of the Foam Tray?
The projected CAGR is approximately 4.3%.
2. Which companies are prominent players in the Foam Tray?
Key companies in the market include Winpak, Novipax, Pactiv, Groupe Guillin, Anchor Packaging, Coopbox Group, Coveris, Dart Container, D&W Fine Pack, Ecopax, Genpak, Placon, Sirap Group.
3. What are the main segments of the Foam Tray?
The market segments include Application, Types.
4. Can you provide details about the market size?
The market size is estimated to be USD 2.72 billion as of 2022.
5. What are some drivers contributing to market growth?
N/A
6. What are the notable trends driving market growth?
N/A
7. Are there any restraints impacting market growth?
N/A
8. Can you provide examples of recent developments in the market?
N/A
9. What pricing options are available for accessing the report?
Pricing options include single-user, multi-user, and enterprise licenses priced at USD 4900.00, USD 7350.00, and USD 9800.00 respectively.
10. Is the market size provided in terms of value or volume?
The market size is provided in terms of value, measured in billion.
11. Are there any specific market keywords associated with the report?
Yes, the market keyword associated with the report is "Foam Tray," which aids in identifying and referencing the specific market segment covered.
12. How do I determine which pricing option suits my needs best?
The pricing options vary based on user requirements and access needs. Individual users may opt for single-user licenses, while businesses requiring broader access may choose multi-user or enterprise licenses for cost-effective access to the report.
13. Are there any additional resources or data provided in the Foam Tray report?
While the report offers comprehensive insights, it's advisable to review the specific contents or supplementary materials provided to ascertain if additional resources or data are available.
14. How can I stay updated on further developments or reports in the Foam Tray?
To stay informed about further developments, trends, and reports in the Foam Tray, consider subscribing to industry newsletters, following relevant companies and organizations, or regularly checking reputable industry news sources and publications.
Methodology
Step 1 - Identification of Relevant Samples Size from Population Database


Step 2 - Approaches for Defining Global Market Size (Value, Volume* & Price*)

Note*: In applicable scenarios
Step 3 - Data Sources
Primary Research
- Web Analytics
- Survey Reports
- Research Institute
- Latest Research Reports
- Opinion Leaders
Secondary Research
- Annual Reports
- White Paper
- Latest Press Release
- Industry Association
- Paid Database
- Investor Presentations

Step 4 - Data Triangulation
Involves using different sources of information in order to increase the validity of a study
These sources are likely to be stakeholders in a program - participants, other researchers, program staff, other community members, and so on.
Then we put all data in single framework & apply various statistical tools to find out the dynamic on the market.
During the analysis stage, feedback from the stakeholder groups would be compared to determine areas of agreement as well as areas of divergence