

Key Insights
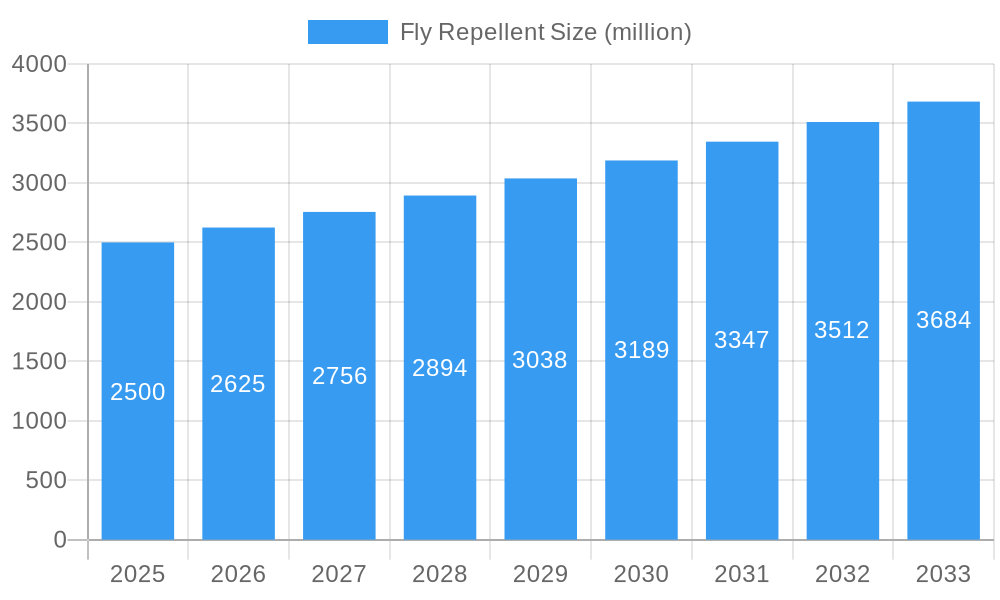
The fly repellent market is experiencing robust growth, driven by increasing health concerns related to fly-borne diseases and a rising demand for effective pest control solutions in both residential and commercial settings. The market, estimated at $2.5 billion in 2025, is projected to witness a Compound Annual Growth Rate (CAGR) of 5% from 2025 to 2033, reaching approximately $3.8 billion by the end of the forecast period. This growth is fueled by several key factors, including the increasing prevalence of insecticide-resistant fly strains, necessitating the development of innovative and effective repellent formulations. Furthermore, the rising adoption of eco-friendly and sustainable fly repellent products is creating new opportunities within the market. Stringent government regulations regarding the use of harmful chemicals in pest control are also driving the demand for safer alternatives. The market is segmented by product type (sprays, traps, electric swatters, etc.), application (indoor, outdoor, commercial, residential), and geographic region. Leading players like 3M, Reckitt Benckiser, and SC Johnson are actively investing in research and development to expand their product portfolios and strengthen their market presence through product innovation and strategic acquisitions.
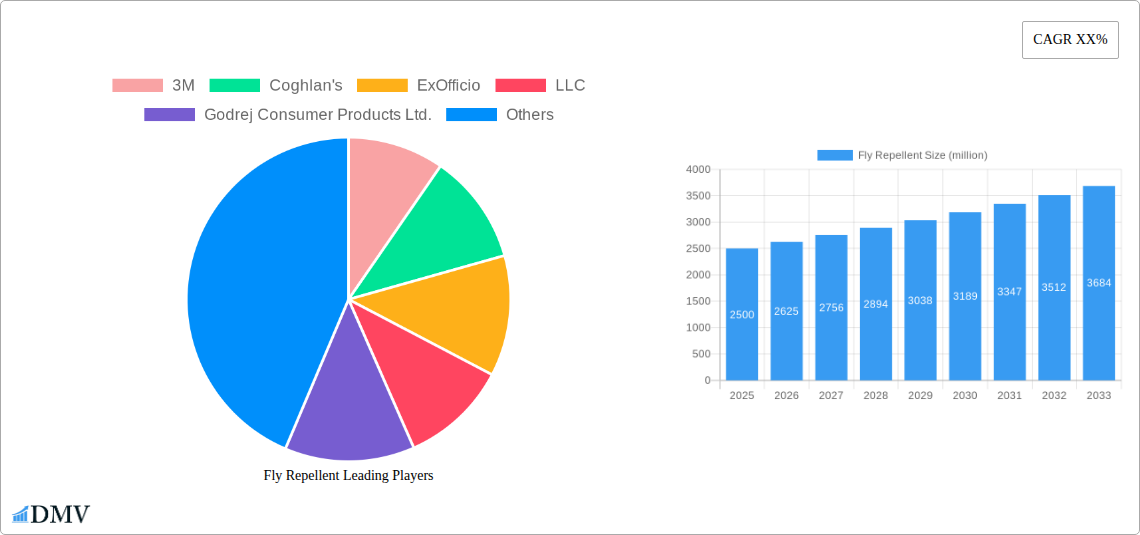
Fly Repellent Market Size (In Billion)
The competitive landscape is characterized by the presence of both established multinational corporations and smaller specialized companies. Major players are focusing on expanding their distribution networks and adopting effective marketing strategies to reach a wider customer base. Geographic expansion, especially into emerging markets with high population densities and limited access to advanced pest control solutions, represents a significant growth opportunity. However, factors such as fluctuating raw material prices, stringent regulatory approvals, and the potential for negative publicity related to the environmental impact of certain repellent formulations pose challenges to market growth. The industry is also witnessing increased consumer awareness regarding the potential health risks associated with certain chemical repellents, leading to a shift in demand towards natural and organic alternatives. The continued development of effective and sustainable fly repellent solutions will be crucial in shaping the future trajectory of this dynamic market.
Fly Repellent Company Market Share
Fly Repellent Market Report: A Comprehensive Analysis of a Multi-Million Dollar Industry (2019-2033)
This insightful report provides a comprehensive analysis of the global fly repellent market, projecting a valuation exceeding $XX million by 2033. It meticulously examines market dynamics, competitive landscapes, and future growth prospects, offering invaluable insights for stakeholders across the value chain. The study period spans 2019-2033, with 2025 serving as both the base and estimated year. The forecast period covers 2025-2033, while the historical period encompasses 2019-2024. Key players analyzed include 3M, Coghlan's, ExOfficio, LLC, Godrej Consumer Products Ltd., Homs LLC, S.C. Johnson & Son, Inc., The Avon Company, PIC Corporation, Reckitt Benckiser Group PLC, and Spectrum Brands Holdings Inc.
Fly Repellent Market Composition & Trends
This section delves into the intricate structure of the fly repellent market, revealing its concentration levels, innovative drivers, regulatory frameworks, substitute product impact, end-user preferences, and the dynamics of mergers and acquisitions (M&A). The report meticulously examines market share distribution among key players, revealing a concentrated market with the top 5 players accounting for approximately XX% of the market share in 2024. M&A activity analysis includes deal values exceeding $XX million in the past five years, revealing strategic consolidation trends within the industry.
- Market Concentration: Highly concentrated, with top players commanding significant shares.
- Innovation Catalysts: Focus on eco-friendly formulations, advanced delivery systems (e.g., ultrasonic repellents), and improved efficacy.
- Regulatory Landscape: Varying regulations across regions impacting product registration and ingredient approvals.
- Substitute Products: Competition from natural repellents and electronic devices.
- End-User Profiles: Residential, commercial (e.g., restaurants, farms), and industrial applications.
- M&A Activities: Consolidation driven by economies of scale and expansion into new markets. The report includes a detailed analysis of at least XX major M&A deals, with a combined value exceeding $XX million.
Fly Repellent Industry Evolution
This section meticulously charts the evolution of the fly repellent industry, examining market growth trajectories, technological advancements, and evolving consumer preferences. The report highlights a Compound Annual Growth Rate (CAGR) of XX% during the historical period (2019-2024), driven by factors such as increasing health consciousness and growing concerns regarding insect-borne diseases. Adoption of advanced technologies like ultrasonic repellents shows a XX% increase from 2019 to 2024, indicating a shift towards more effective and environmentally friendly solutions. The forecast period (2025-2033) projects continued growth fueled by innovative product development and expansion into emerging markets.
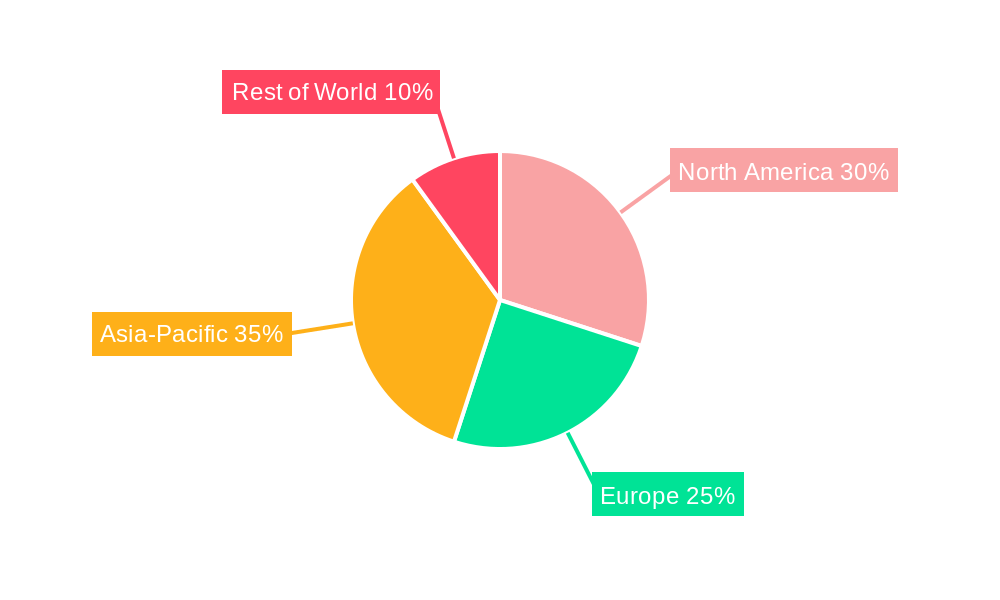
Leading Regions, Countries, or Segments in Fly Repellent
This section identifies the dominant regions, countries, or segments within the fly repellent market. North America currently holds the largest market share, primarily driven by high consumer awareness and strong regulatory support for effective pest control solutions.
Key Drivers in North America:
- High consumer disposable incomes leading to higher spending on pest control solutions.
- Stringent regulatory frameworks promoting the development and adoption of safe and effective products.
- Established distribution networks supporting efficient product reach.
Dominance Factors: Strong consumer demand, robust regulatory frameworks, and established distribution channels. The report provides a detailed breakdown of market share by region and country, incorporating factors such as population density, climate conditions, and economic development levels.
Fly Repellent Product Innovations
Recent innovations in fly repellents include the development of bio-based and eco-friendly formulations, utilizing natural ingredients with proven efficacy and minimal environmental impact. Advanced delivery systems, such as ultrasonic devices and controlled-release technologies, are gaining traction, offering convenient and long-lasting protection. These innovations boast enhanced efficacy and reduced environmental concerns, compared to traditional chemical-based repellents. The incorporation of smart technologies and user-friendly features further improves user experience and adherence.
Propelling Factors for Fly Repellent Growth
Several factors fuel the growth of the fly repellent market. Technological advancements in formulation and delivery systems are key, alongside rising consumer awareness of insect-borne diseases and the associated health risks. Favorable government regulations promoting the use of safe and effective pest control measures also contribute to market expansion. Economic growth, particularly in developing countries, further boosts demand due to increased disposable incomes and improved living standards.
Obstacles in the Fly Repellent Market
The fly repellent market faces challenges, including stringent regulatory approvals for new products, potential supply chain disruptions due to raw material shortages, and intense competition from both established players and new entrants. These factors can impact production costs, product availability, and overall market growth. The report quantifies the impact of these obstacles, providing detailed analysis of the potential impact on market projections.
Future Opportunities in Fly Repellent
Emerging opportunities lie in the development of personalized fly repellent solutions tailored to specific needs and preferences, leveraging data analytics and consumer insights. Expansion into new markets, particularly in developing economies, presents significant potential. The exploration of innovative delivery mechanisms and integration with smart home technologies are also promising avenues for growth.
Major Players in the Fly Repellent Ecosystem
- 3M
- Coghlan's
- ExOfficio, LLC
- Godrej Consumer Products Ltd.
- Homs LLC
- S.C. Johnson & Son, Inc.
- The Avon Company
- PIC Corporation
- Reckitt Benckiser Group PLC
- Spectrum Brands Holdings Inc.
Key Developments in Fly Repellent Industry
- 2022-Q4: 3M launched a new line of eco-friendly fly repellents, driving significant market share gains.
- 2023-Q1: Reckitt Benckiser Group PLC acquired a smaller competitor, expanding its product portfolio.
- 2023-Q3: S.C. Johnson & Son, Inc. invested heavily in R&D, leading to several patent applications for new formulations. (Further specific developments will be included in the full report).
Strategic Fly Repellent Market Forecast
The fly repellent market is poised for robust growth over the forecast period (2025-2033), driven by innovative product development, expanding consumer awareness, and favorable regulatory environments. Emerging markets present significant growth potential, while technological advancements will continue to shape market dynamics. The report provides detailed market forecasts, segmented by region, product type, and application.
Fly Repellent Segmentation
-
1. Application
- 1.1. Online Sales
- 1.2. Offline Sales
-
2. Types
- 2.1. Sprays/Aerosols
- 2.2. Creams & Oils
- 2.3. Others (Powders, Coils, etc.)
Fly Repellent Segmentation By Geography
-
1. North America
- 1.1. United States
- 1.2. Canada
- 1.3. Mexico
-
2. South America
- 2.1. Brazil
- 2.2. Argentina
- 2.3. Rest of South America
-
3. Europe
- 3.1. United Kingdom
- 3.2. Germany
- 3.3. France
- 3.4. Italy
- 3.5. Spain
- 3.6. Russia
- 3.7. Benelux
- 3.8. Nordics
- 3.9. Rest of Europe
-
4. Middle East & Africa
- 4.1. Turkey
- 4.2. Israel
- 4.3. GCC
- 4.4. North Africa
- 4.5. South Africa
- 4.6. Rest of Middle East & Africa
-
5. Asia Pacific
- 5.1. China
- 5.2. India
- 5.3. Japan
- 5.4. South Korea
- 5.5. ASEAN
- 5.6. Oceania
- 5.7. Rest of Asia Pacific
Fly Repellent Regional Market Share
Geographic Coverage of Fly Repellent
Fly Repellent REPORT HIGHLIGHTS
| Aspects | Details |
|---|---|
| Study Period | 2020-2034 |
| Base Year | 2025 |
| Estimated Year | 2026 |
| Forecast Period | 2026-2034 |
| Historical Period | 2020-2025 |
| Growth Rate | CAGR of 7.3% from 2020-2034 |
| Segmentation |
|
Table of Contents
- 1. Introduction
- 1.1. Research Scope
- 1.2. Market Segmentation
- 1.3. Research Objective
- 1.4. Definitions and Assumptions
- 2. Executive Summary
- 2.1. Market Snapshot
- 3. Market Dynamics
- 3.1. Market Drivers
- 3.2. Market Restrains
- 3.3. Market Trends
- 3.4. Market Opportunities
- 4. Market Factor Analysis
- 4.1. Porters Five Forces
- 4.1.1. Bargaining Power of Suppliers
- 4.1.2. Bargaining Power of Buyers
- 4.1.3. Threat of New Entrants
- 4.1.4. Threat of Substitutes
- 4.1.5. Competitive Rivalry
- 4.2. PESTEL analysis
- 4.3. BCG Analysis
- 4.3.1. Stars (High Growth, High Market Share)
- 4.3.2. Cash Cows (Low Growth, High Market Share)
- 4.3.3. Question Mark (High Growth, Low Market Share)
- 4.3.4. Dogs (Low Growth, Low Market Share)
- 4.4. Ansoff Matrix Analysis
- 4.5. Supply Chain Analysis
- 4.6. Regulatory Landscape
- 4.7. Current Market Potential and Opportunity Assessment (TAM–SAM–SOM Framework)
- 4.8. DMV Analyst Note
- 4.1. Porters Five Forces
- 5. Market Analysis, Insights and Forecast 2021-2033
- 5.1. Market Analysis, Insights and Forecast - by Application
- 5.1.1. Online Sales
- 5.1.2. Offline Sales
- 5.2. Market Analysis, Insights and Forecast - by Types
- 5.2.1. Sprays/Aerosols
- 5.2.2. Creams & Oils
- 5.2.3. Others (Powders, Coils, etc.)
- 5.3. Market Analysis, Insights and Forecast - by Region
- 5.3.1. North America
- 5.3.2. South America
- 5.3.3. Europe
- 5.3.4. Middle East & Africa
- 5.3.5. Asia Pacific
- 5.1. Market Analysis, Insights and Forecast - by Application
- 6. Global Fly Repellent Analysis, Insights and Forecast, 2021-2033
- 6.1. Market Analysis, Insights and Forecast - by Application
- 6.1.1. Online Sales
- 6.1.2. Offline Sales
- 6.2. Market Analysis, Insights and Forecast - by Types
- 6.2.1. Sprays/Aerosols
- 6.2.2. Creams & Oils
- 6.2.3. Others (Powders, Coils, etc.)
- 6.1. Market Analysis, Insights and Forecast - by Application
- 7. North America Fly Repellent Analysis, Insights and Forecast, 2020-2032
- 7.1. Market Analysis, Insights and Forecast - by Application
- 7.1.1. Online Sales
- 7.1.2. Offline Sales
- 7.2. Market Analysis, Insights and Forecast - by Types
- 7.2.1. Sprays/Aerosols
- 7.2.2. Creams & Oils
- 7.2.3. Others (Powders, Coils, etc.)
- 7.1. Market Analysis, Insights and Forecast - by Application
- 8. South America Fly Repellent Analysis, Insights and Forecast, 2020-2032
- 8.1. Market Analysis, Insights and Forecast - by Application
- 8.1.1. Online Sales
- 8.1.2. Offline Sales
- 8.2. Market Analysis, Insights and Forecast - by Types
- 8.2.1. Sprays/Aerosols
- 8.2.2. Creams & Oils
- 8.2.3. Others (Powders, Coils, etc.)
- 8.1. Market Analysis, Insights and Forecast - by Application
- 9. Europe Fly Repellent Analysis, Insights and Forecast, 2020-2032
- 9.1. Market Analysis, Insights and Forecast - by Application
- 9.1.1. Online Sales
- 9.1.2. Offline Sales
- 9.2. Market Analysis, Insights and Forecast - by Types
- 9.2.1. Sprays/Aerosols
- 9.2.2. Creams & Oils
- 9.2.3. Others (Powders, Coils, etc.)
- 9.1. Market Analysis, Insights and Forecast - by Application
- 10. Middle East & Africa Fly Repellent Analysis, Insights and Forecast, 2020-2032
- 10.1. Market Analysis, Insights and Forecast - by Application
- 10.1.1. Online Sales
- 10.1.2. Offline Sales
- 10.2. Market Analysis, Insights and Forecast - by Types
- 10.2.1. Sprays/Aerosols
- 10.2.2. Creams & Oils
- 10.2.3. Others (Powders, Coils, etc.)
- 10.1. Market Analysis, Insights and Forecast - by Application
- 11. Asia Pacific Fly Repellent Analysis, Insights and Forecast, 2020-2032
- 11.1. Market Analysis, Insights and Forecast - by Application
- 11.1.1. Online Sales
- 11.1.2. Offline Sales
- 11.2. Market Analysis, Insights and Forecast - by Types
- 11.2.1. Sprays/Aerosols
- 11.2.2. Creams & Oils
- 11.2.3. Others (Powders, Coils, etc.)
- 11.1. Market Analysis, Insights and Forecast - by Application
- 12. Competitive Analysis
- 12.1. Company Profiles
- 12.1.1 3M
- 12.1.1.1. Company Overview
- 12.1.1.2. Products
- 12.1.1.3. Company Financials
- 12.1.1.4. SWOT Analysis
- 12.1.2 Coghlan's
- 12.1.2.1. Company Overview
- 12.1.2.2. Products
- 12.1.2.3. Company Financials
- 12.1.2.4. SWOT Analysis
- 12.1.3 ExOfficio
- 12.1.3.1. Company Overview
- 12.1.3.2. Products
- 12.1.3.3. Company Financials
- 12.1.3.4. SWOT Analysis
- 12.1.4 LLC
- 12.1.4.1. Company Overview
- 12.1.4.2. Products
- 12.1.4.3. Company Financials
- 12.1.4.4. SWOT Analysis
- 12.1.5 Godrej Consumer Products Ltd.
- 12.1.5.1. Company Overview
- 12.1.5.2. Products
- 12.1.5.3. Company Financials
- 12.1.5.4. SWOT Analysis
- 12.1.6 Homs LLC
- 12.1.6.1. Company Overview
- 12.1.6.2. Products
- 12.1.6.3. Company Financials
- 12.1.6.4. SWOT Analysis
- 12.1.7 S.C. Johnson & Son
- 12.1.7.1. Company Overview
- 12.1.7.2. Products
- 12.1.7.3. Company Financials
- 12.1.7.4. SWOT Analysis
- 12.1.8 Inc.
- 12.1.8.1. Company Overview
- 12.1.8.2. Products
- 12.1.8.3. Company Financials
- 12.1.8.4. SWOT Analysis
- 12.1.9 The Avon Company
- 12.1.9.1. Company Overview
- 12.1.9.2. Products
- 12.1.9.3. Company Financials
- 12.1.9.4. SWOT Analysis
- 12.1.10 PIC Corporation
- 12.1.10.1. Company Overview
- 12.1.10.2. Products
- 12.1.10.3. Company Financials
- 12.1.10.4. SWOT Analysis
- 12.1.11 Reckitt Benckiser Group PLC
- 12.1.11.1. Company Overview
- 12.1.11.2. Products
- 12.1.11.3. Company Financials
- 12.1.11.4. SWOT Analysis
- 12.1.12 Spectrum Brands Holdings Inc.
- 12.1.12.1. Company Overview
- 12.1.12.2. Products
- 12.1.12.3. Company Financials
- 12.1.12.4. SWOT Analysis
- 12.1.1 3M
- 12.2. Market Entropy
- 12.2.1 Company's Key Areas Served
- 12.2.2 Recent Developments
- 12.3. Company Market Share Analysis 2025
- 12.3.1 Top 5 Companies Market Share Analysis
- 12.3.2 Top 3 Companies Market Share Analysis
- 12.4. List of Potential Customers
- 13. Research Methodology
List of Figures
- Figure 1: Global Fly Repellent Revenue Breakdown (undefined, %) by Region 2025 & 2033
- Figure 2: North America Fly Repellent Revenue (undefined), by Application 2025 & 2033
- Figure 3: North America Fly Repellent Revenue Share (%), by Application 2025 & 2033
- Figure 4: North America Fly Repellent Revenue (undefined), by Types 2025 & 2033
- Figure 5: North America Fly Repellent Revenue Share (%), by Types 2025 & 2033
- Figure 6: North America Fly Repellent Revenue (undefined), by Country 2025 & 2033
- Figure 7: North America Fly Repellent Revenue Share (%), by Country 2025 & 2033
- Figure 8: South America Fly Repellent Revenue (undefined), by Application 2025 & 2033
- Figure 9: South America Fly Repellent Revenue Share (%), by Application 2025 & 2033
- Figure 10: South America Fly Repellent Revenue (undefined), by Types 2025 & 2033
- Figure 11: South America Fly Repellent Revenue Share (%), by Types 2025 & 2033
- Figure 12: South America Fly Repellent Revenue (undefined), by Country 2025 & 2033
- Figure 13: South America Fly Repellent Revenue Share (%), by Country 2025 & 2033
- Figure 14: Europe Fly Repellent Revenue (undefined), by Application 2025 & 2033
- Figure 15: Europe Fly Repellent Revenue Share (%), by Application 2025 & 2033
- Figure 16: Europe Fly Repellent Revenue (undefined), by Types 2025 & 2033
- Figure 17: Europe Fly Repellent Revenue Share (%), by Types 2025 & 2033
- Figure 18: Europe Fly Repellent Revenue (undefined), by Country 2025 & 2033
- Figure 19: Europe Fly Repellent Revenue Share (%), by Country 2025 & 2033
- Figure 20: Middle East & Africa Fly Repellent Revenue (undefined), by Application 2025 & 2033
- Figure 21: Middle East & Africa Fly Repellent Revenue Share (%), by Application 2025 & 2033
- Figure 22: Middle East & Africa Fly Repellent Revenue (undefined), by Types 2025 & 2033
- Figure 23: Middle East & Africa Fly Repellent Revenue Share (%), by Types 2025 & 2033
- Figure 24: Middle East & Africa Fly Repellent Revenue (undefined), by Country 2025 & 2033
- Figure 25: Middle East & Africa Fly Repellent Revenue Share (%), by Country 2025 & 2033
- Figure 26: Asia Pacific Fly Repellent Revenue (undefined), by Application 2025 & 2033
- Figure 27: Asia Pacific Fly Repellent Revenue Share (%), by Application 2025 & 2033
- Figure 28: Asia Pacific Fly Repellent Revenue (undefined), by Types 2025 & 2033
- Figure 29: Asia Pacific Fly Repellent Revenue Share (%), by Types 2025 & 2033
- Figure 30: Asia Pacific Fly Repellent Revenue (undefined), by Country 2025 & 2033
- Figure 31: Asia Pacific Fly Repellent Revenue Share (%), by Country 2025 & 2033
List of Tables
- Table 1: Global Fly Repellent Revenue undefined Forecast, by Application 2020 & 2033
- Table 2: Global Fly Repellent Revenue undefined Forecast, by Types 2020 & 2033
- Table 3: Global Fly Repellent Revenue undefined Forecast, by Region 2020 & 2033
- Table 4: Global Fly Repellent Revenue undefined Forecast, by Application 2020 & 2033
- Table 5: Global Fly Repellent Revenue undefined Forecast, by Types 2020 & 2033
- Table 6: Global Fly Repellent Revenue undefined Forecast, by Country 2020 & 2033
- Table 7: United States Fly Repellent Revenue (undefined) Forecast, by Application 2020 & 2033
- Table 8: Canada Fly Repellent Revenue (undefined) Forecast, by Application 2020 & 2033
- Table 9: Mexico Fly Repellent Revenue (undefined) Forecast, by Application 2020 & 2033
- Table 10: Global Fly Repellent Revenue undefined Forecast, by Application 2020 & 2033
- Table 11: Global Fly Repellent Revenue undefined Forecast, by Types 2020 & 2033
- Table 12: Global Fly Repellent Revenue undefined Forecast, by Country 2020 & 2033
- Table 13: Brazil Fly Repellent Revenue (undefined) Forecast, by Application 2020 & 2033
- Table 14: Argentina Fly Repellent Revenue (undefined) Forecast, by Application 2020 & 2033
- Table 15: Rest of South America Fly Repellent Revenue (undefined) Forecast, by Application 2020 & 2033
- Table 16: Global Fly Repellent Revenue undefined Forecast, by Application 2020 & 2033
- Table 17: Global Fly Repellent Revenue undefined Forecast, by Types 2020 & 2033
- Table 18: Global Fly Repellent Revenue undefined Forecast, by Country 2020 & 2033
- Table 19: United Kingdom Fly Repellent Revenue (undefined) Forecast, by Application 2020 & 2033
- Table 20: Germany Fly Repellent Revenue (undefined) Forecast, by Application 2020 & 2033
- Table 21: France Fly Repellent Revenue (undefined) Forecast, by Application 2020 & 2033
- Table 22: Italy Fly Repellent Revenue (undefined) Forecast, by Application 2020 & 2033
- Table 23: Spain Fly Repellent Revenue (undefined) Forecast, by Application 2020 & 2033
- Table 24: Russia Fly Repellent Revenue (undefined) Forecast, by Application 2020 & 2033
- Table 25: Benelux Fly Repellent Revenue (undefined) Forecast, by Application 2020 & 2033
- Table 26: Nordics Fly Repellent Revenue (undefined) Forecast, by Application 2020 & 2033
- Table 27: Rest of Europe Fly Repellent Revenue (undefined) Forecast, by Application 2020 & 2033
- Table 28: Global Fly Repellent Revenue undefined Forecast, by Application 2020 & 2033
- Table 29: Global Fly Repellent Revenue undefined Forecast, by Types 2020 & 2033
- Table 30: Global Fly Repellent Revenue undefined Forecast, by Country 2020 & 2033
- Table 31: Turkey Fly Repellent Revenue (undefined) Forecast, by Application 2020 & 2033
- Table 32: Israel Fly Repellent Revenue (undefined) Forecast, by Application 2020 & 2033
- Table 33: GCC Fly Repellent Revenue (undefined) Forecast, by Application 2020 & 2033
- Table 34: North Africa Fly Repellent Revenue (undefined) Forecast, by Application 2020 & 2033
- Table 35: South Africa Fly Repellent Revenue (undefined) Forecast, by Application 2020 & 2033
- Table 36: Rest of Middle East & Africa Fly Repellent Revenue (undefined) Forecast, by Application 2020 & 2033
- Table 37: Global Fly Repellent Revenue undefined Forecast, by Application 2020 & 2033
- Table 38: Global Fly Repellent Revenue undefined Forecast, by Types 2020 & 2033
- Table 39: Global Fly Repellent Revenue undefined Forecast, by Country 2020 & 2033
- Table 40: China Fly Repellent Revenue (undefined) Forecast, by Application 2020 & 2033
- Table 41: India Fly Repellent Revenue (undefined) Forecast, by Application 2020 & 2033
- Table 42: Japan Fly Repellent Revenue (undefined) Forecast, by Application 2020 & 2033
- Table 43: South Korea Fly Repellent Revenue (undefined) Forecast, by Application 2020 & 2033
- Table 44: ASEAN Fly Repellent Revenue (undefined) Forecast, by Application 2020 & 2033
- Table 45: Oceania Fly Repellent Revenue (undefined) Forecast, by Application 2020 & 2033
- Table 46: Rest of Asia Pacific Fly Repellent Revenue (undefined) Forecast, by Application 2020 & 2033
Frequently Asked Questions
1. What is the projected Compound Annual Growth Rate (CAGR) of the Fly Repellent?
The projected CAGR is approximately 7.3%.
2. Which companies are prominent players in the Fly Repellent?
Key companies in the market include 3M, Coghlan's, ExOfficio, LLC, Godrej Consumer Products Ltd., Homs LLC, S.C. Johnson & Son, Inc., The Avon Company, PIC Corporation, Reckitt Benckiser Group PLC, Spectrum Brands Holdings Inc..
3. What are the main segments of the Fly Repellent?
The market segments include Application, Types.
4. Can you provide details about the market size?
The market size is estimated to be USD XXX N/A as of 2022.
5. What are some drivers contributing to market growth?
N/A
6. What are the notable trends driving market growth?
N/A
7. Are there any restraints impacting market growth?
N/A
8. Can you provide examples of recent developments in the market?
N/A
9. What pricing options are available for accessing the report?
Pricing options include single-user, multi-user, and enterprise licenses priced at USD 4900.00, USD 7350.00, and USD 9800.00 respectively.
10. Is the market size provided in terms of value or volume?
The market size is provided in terms of value, measured in N/A.
11. Are there any specific market keywords associated with the report?
Yes, the market keyword associated with the report is "Fly Repellent," which aids in identifying and referencing the specific market segment covered.
12. How do I determine which pricing option suits my needs best?
The pricing options vary based on user requirements and access needs. Individual users may opt for single-user licenses, while businesses requiring broader access may choose multi-user or enterprise licenses for cost-effective access to the report.
13. Are there any additional resources or data provided in the Fly Repellent report?
While the report offers comprehensive insights, it's advisable to review the specific contents or supplementary materials provided to ascertain if additional resources or data are available.
14. How can I stay updated on further developments or reports in the Fly Repellent?
To stay informed about further developments, trends, and reports in the Fly Repellent, consider subscribing to industry newsletters, following relevant companies and organizations, or regularly checking reputable industry news sources and publications.
Methodology
Step 1 - Identification of Relevant Samples Size from Population Database


Step 2 - Approaches for Defining Global Market Size (Value, Volume* & Price*)

Note*: In applicable scenarios
Step 3 - Data Sources
Primary Research
- Web Analytics
- Survey Reports
- Research Institute
- Latest Research Reports
- Opinion Leaders
Secondary Research
- Annual Reports
- White Paper
- Latest Press Release
- Industry Association
- Paid Database
- Investor Presentations

Step 4 - Data Triangulation
Involves using different sources of information in order to increase the validity of a study
These sources are likely to be stakeholders in a program - participants, other researchers, program staff, other community members, and so on.
Then we put all data in single framework & apply various statistical tools to find out the dynamic on the market.
During the analysis stage, feedback from the stakeholder groups would be compared to determine areas of agreement as well as areas of divergence