

Key Insights
The global market for fluorinated conductive salts in lithium batteries is experiencing significant expansion. This growth is primarily driven by the escalating demand for advanced energy storage solutions across electric vehicles (EVs), consumer electronics, and grid-scale energy systems. Superior electrochemical properties, including enhanced energy density, extended cycle life, and improved rate capability, position fluorinated salts as critical components for next-generation lithium-ion batteries. These advantages are essential for overcoming current battery technology limitations and meeting consumer expectations for higher performance and longevity. The market size is projected to reach $3.67 billion by 2025, with an estimated Compound Annual Growth Rate (CAGR) of 19.1%. Key industry players such as Solvay, 3M, and Arkema are actively investing in research and development, which further propels market growth. However, challenges such as high production costs and environmental considerations associated with certain fluorinated compounds require strategic attention.
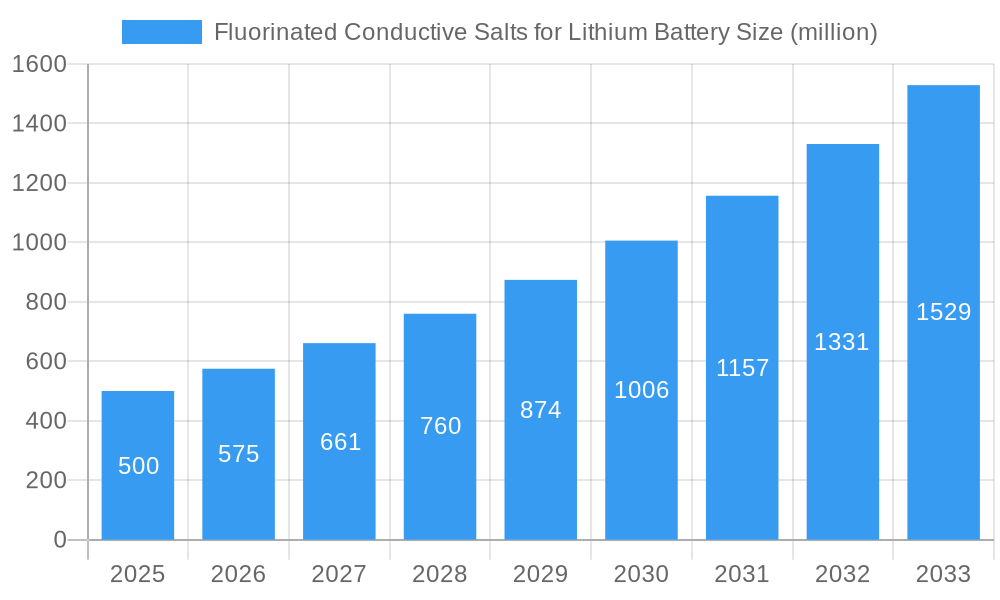
Fluorinated Conductive Salts for Lithium Battery Market Size (In Billion)
Market segmentation highlights distinct applications within the lithium-ion battery sector, where various fluorinated salts are optimized for specific battery chemistries. Regional market dynamics are closely tied to EV adoption rates and the expansion of related infrastructure. North America and Asia are anticipated to lead market growth due to their robust EV manufacturing sectors and substantial government support for battery technology development. The competitive landscape features a mix of established chemical manufacturers and specialized emerging companies. Future market trajectories will be shaped by innovations in fluorinated salt synthesis, cost-effectiveness improvements, and the development of sustainable alternatives. Continuous research focused on battery performance enhancement is expected to accelerate the adoption of fluorinated conductive salts, sustaining robust market expansion.
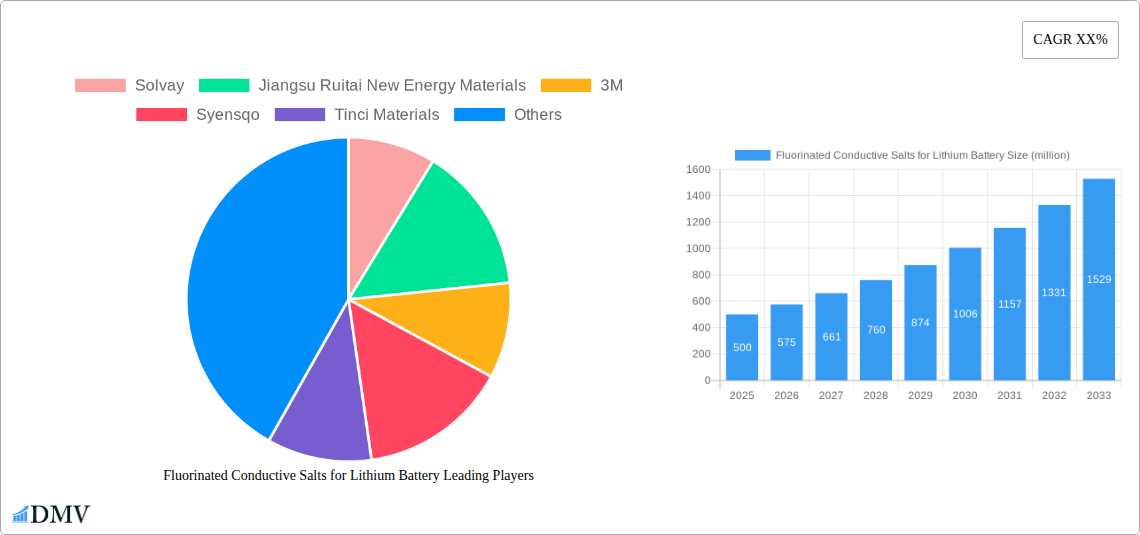
Fluorinated Conductive Salts for Lithium Battery Company Market Share
Fluorinated Conductive Salts for Lithium Battery Market: A Comprehensive Report (2019-2033)
This insightful report provides a comprehensive analysis of the Fluorinated Conductive Salts for Lithium Battery market, offering a detailed understanding of its current state, future trajectory, and key players. The study period spans from 2019 to 2033, with 2025 serving as both the base and estimated year. The forecast period covers 2025-2033, while the historical period encompasses 2019-2024. The market's valuation is expected to reach xx million by 2033, exhibiting significant growth potential. This report is essential for stakeholders seeking strategic insights into this rapidly evolving sector.
Fluorinated Conductive Salts for Lithium Battery Market Composition & Trends
This section delves into the competitive landscape, analyzing market concentration, innovation drivers, regulatory frameworks, substitute products, end-user profiles, and mergers and acquisitions (M&A) activities within the fluorinated conductive salts for lithium-ion battery market. The market share is currently dominated by a few key players, with Solvay and 3M holding significant positions. However, smaller companies like Jiangsu Ruitai New Energy Materials and Shenzhen Capchem Technology are actively innovating and expanding their market presence. The overall market is characterized by moderate concentration, with the top five players accounting for approximately xx% of the total revenue in 2024.
- Market Share Distribution (2024): Solvay (xx%), 3M (xx%), Jiangsu Ruitai (xx%), Shenzhen Capchem (xx%), Others (xx%).
- Innovation Catalysts: Focus on enhanced conductivity, improved thermal stability, and reduced cost.
- Regulatory Landscape: Stringent environmental regulations are driving the adoption of safer and more sustainable fluorinated salts.
- Substitute Products: Competition from alternative electrolyte salts, but fluorinated salts maintain an advantage in performance.
- End-User Profiles: Dominated by electric vehicle (EV) and energy storage system (ESS) manufacturers.
- M&A Activities (2019-2024): xx million in total deal value, with a focus on acquiring specialized technology and expanding production capacity. Notable deals included [Insert details of any available M&A activity, including company names and deal values if possible. If no data is available, replace with "No significant M&A activity reported during this period"].
Fluorinated Conductive Salts for Lithium Battery Industry Evolution
This section examines the historical and projected growth trajectories of the fluorinated conductive salts market for lithium-ion batteries. From 2019 to 2024, the market experienced a Compound Annual Growth Rate (CAGR) of xx%, driven primarily by the explosive growth of the electric vehicle sector and the increasing demand for energy storage solutions. Technological advancements, such as the development of high-performance fluorinated salts with improved conductivity and thermal stability, have further fueled this expansion. Consumer demand for higher energy density batteries and longer lifespan is pushing innovation and adoption. We project a CAGR of xx% from 2025 to 2033, indicating a continuously expanding market fueled by the global transition towards sustainable energy solutions and the continued rise in electric vehicle adoption.
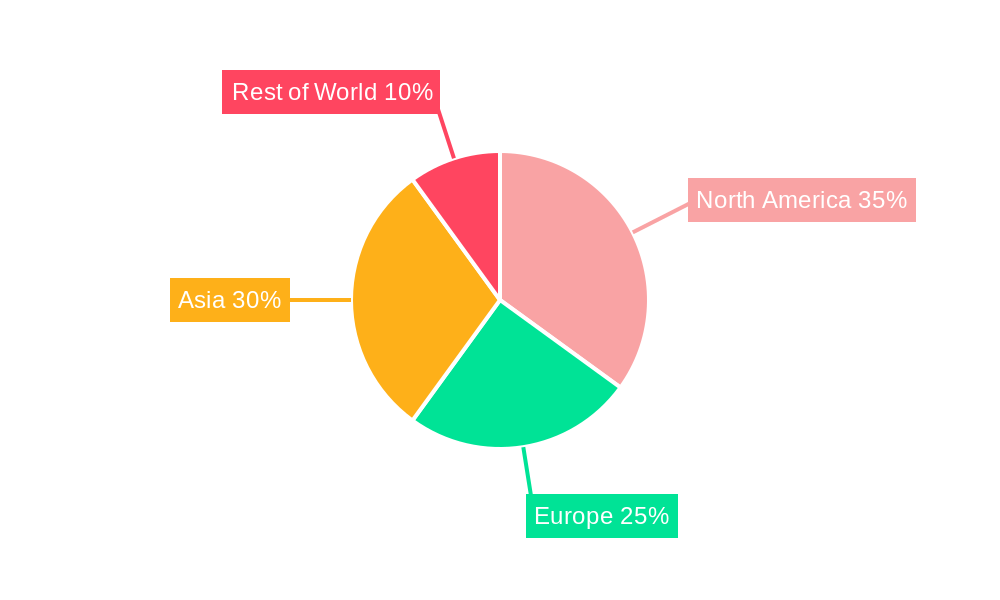
Leading Regions, Countries, or Segments in Fluorinated Conductive Salts for Lithium Battery
The Asia-Pacific region, particularly China, currently leads the global market for fluorinated conductive salts, owing to the significant presence of battery manufacturing giants and substantial government support for the electric vehicle industry. This dominance is expected to continue throughout the forecast period.
- Key Drivers in Asia-Pacific:
- Massive investments in EV infrastructure and battery production.
- Supportive government policies promoting clean energy technologies.
- Strong demand from the burgeoning electric vehicle and energy storage sectors.
- Dominance Factors: Established manufacturing base, strong government support, and robust domestic demand for lithium-ion batteries.
Fluorinated Conductive Salts for Lithium Battery Product Innovations
Recent innovations focus on enhancing conductivity, improving thermal stability, and extending battery lifespan. New fluorinated salts with optimized molecular structures offer superior performance characteristics compared to their predecessors. These advancements are crucial for enabling the development of higher-energy-density, faster-charging, and more durable lithium-ion batteries, meeting the growing demands of the EV and energy storage sectors.
Propelling Factors for Fluorinated Conductive Salts for Lithium Battery Growth
The growth of the fluorinated conductive salts market is fueled by several key factors: the ever-increasing demand for electric vehicles, the expanding energy storage market for renewable energy integration, and stringent government regulations promoting clean energy adoption. Technological advancements leading to higher performing and cost-effective fluorinated salts further stimulate market growth.
Obstacles in the Fluorinated Conductive Salts for Lithium Battery Market
The market faces challenges including the volatility of raw material prices, potential supply chain disruptions, and intense competition from alternative electrolyte salt technologies. Moreover, stringent environmental regulations related to the handling and disposal of fluorinated compounds pose both regulatory and cost hurdles for manufacturers.
Future Opportunities in Fluorinated Conductive Salts for Lithium Battery
Future opportunities lie in developing next-generation fluorinated salts with even higher conductivity and improved safety profiles. Expanding into new applications, such as grid-scale energy storage and advanced battery chemistries, also presents significant growth potential. Furthermore, exploring sustainable and cost-effective manufacturing processes will be crucial for long-term market success.
Major Players in the Fluorinated Conductive Salts for Lithium Battery Ecosystem
Key Developments in Fluorinated Conductive Salts for Lithium Battery Industry
- 2022 Q4: Solvay announced the launch of a new high-performance fluorinated salt with enhanced thermal stability.
- 2023 Q1: Jiangsu Ruitai secured a major supply contract with a leading EV manufacturer.
- [Add more key developments with specific years and months. If no data is available, use "No significant developments reported during this period."]
Strategic Fluorinated Conductive Salts for Lithium Battery Market Forecast
The fluorinated conductive salts market for lithium-ion batteries is poised for continued robust growth, driven by the global shift towards electric mobility and renewable energy storage. Technological advancements, coupled with supportive government policies, will further propel market expansion. The market is expected to reach xx million by 2033, presenting significant opportunities for established players and new entrants alike.
Fluorinated Conductive Salts for Lithium Battery Segmentation
-
1. Application
- 1.1. Power Battery
- 1.2. Consumer Electronics Battery
- 1.3. Energy Storage Battery
-
2. Types
- 2.1. LiTFSI
- 2.2. LiFSI
Fluorinated Conductive Salts for Lithium Battery Segmentation By Geography
-
1. North America
- 1.1. United States
- 1.2. Canada
- 1.3. Mexico
-
2. South America
- 2.1. Brazil
- 2.2. Argentina
- 2.3. Rest of South America
-
3. Europe
- 3.1. United Kingdom
- 3.2. Germany
- 3.3. France
- 3.4. Italy
- 3.5. Spain
- 3.6. Russia
- 3.7. Benelux
- 3.8. Nordics
- 3.9. Rest of Europe
-
4. Middle East & Africa
- 4.1. Turkey
- 4.2. Israel
- 4.3. GCC
- 4.4. North Africa
- 4.5. South Africa
- 4.6. Rest of Middle East & Africa
-
5. Asia Pacific
- 5.1. China
- 5.2. India
- 5.3. Japan
- 5.4. South Korea
- 5.5. ASEAN
- 5.6. Oceania
- 5.7. Rest of Asia Pacific
Fluorinated Conductive Salts for Lithium Battery Regional Market Share
Geographic Coverage of Fluorinated Conductive Salts for Lithium Battery
Fluorinated Conductive Salts for Lithium Battery REPORT HIGHLIGHTS
| Aspects | Details |
|---|---|
| Study Period | 2020-2034 |
| Base Year | 2025 |
| Estimated Year | 2026 |
| Forecast Period | 2026-2034 |
| Historical Period | 2020-2025 |
| Growth Rate | CAGR of 19.1% from 2020-2034 |
| Segmentation |
|
Table of Contents
- 1. Introduction
- 1.1. Research Scope
- 1.2. Market Segmentation
- 1.3. Research Methodology
- 1.4. Definitions and Assumptions
- 2. Executive Summary
- 2.1. Introduction
- 3. Market Dynamics
- 3.1. Introduction
- 3.2. Market Drivers
- 3.3. Market Restrains
- 3.4. Market Trends
- 4. Market Factor Analysis
- 4.1. Porters Five Forces
- 4.2. Supply/Value Chain
- 4.3. PESTEL analysis
- 4.4. Market Entropy
- 4.5. Patent/Trademark Analysis
- 5. Global Fluorinated Conductive Salts for Lithium Battery Analysis, Insights and Forecast, 2020-2032
- 5.1. Market Analysis, Insights and Forecast - by Application
- 5.1.1. Power Battery
- 5.1.2. Consumer Electronics Battery
- 5.1.3. Energy Storage Battery
- 5.2. Market Analysis, Insights and Forecast - by Types
- 5.2.1. LiTFSI
- 5.2.2. LiFSI
- 5.3. Market Analysis, Insights and Forecast - by Region
- 5.3.1. North America
- 5.3.2. South America
- 5.3.3. Europe
- 5.3.4. Middle East & Africa
- 5.3.5. Asia Pacific
- 5.1. Market Analysis, Insights and Forecast - by Application
- 6. North America Fluorinated Conductive Salts for Lithium Battery Analysis, Insights and Forecast, 2020-2032
- 6.1. Market Analysis, Insights and Forecast - by Application
- 6.1.1. Power Battery
- 6.1.2. Consumer Electronics Battery
- 6.1.3. Energy Storage Battery
- 6.2. Market Analysis, Insights and Forecast - by Types
- 6.2.1. LiTFSI
- 6.2.2. LiFSI
- 6.1. Market Analysis, Insights and Forecast - by Application
- 7. South America Fluorinated Conductive Salts for Lithium Battery Analysis, Insights and Forecast, 2020-2032
- 7.1. Market Analysis, Insights and Forecast - by Application
- 7.1.1. Power Battery
- 7.1.2. Consumer Electronics Battery
- 7.1.3. Energy Storage Battery
- 7.2. Market Analysis, Insights and Forecast - by Types
- 7.2.1. LiTFSI
- 7.2.2. LiFSI
- 7.1. Market Analysis, Insights and Forecast - by Application
- 8. Europe Fluorinated Conductive Salts for Lithium Battery Analysis, Insights and Forecast, 2020-2032
- 8.1. Market Analysis, Insights and Forecast - by Application
- 8.1.1. Power Battery
- 8.1.2. Consumer Electronics Battery
- 8.1.3. Energy Storage Battery
- 8.2. Market Analysis, Insights and Forecast - by Types
- 8.2.1. LiTFSI
- 8.2.2. LiFSI
- 8.1. Market Analysis, Insights and Forecast - by Application
- 9. Middle East & Africa Fluorinated Conductive Salts for Lithium Battery Analysis, Insights and Forecast, 2020-2032
- 9.1. Market Analysis, Insights and Forecast - by Application
- 9.1.1. Power Battery
- 9.1.2. Consumer Electronics Battery
- 9.1.3. Energy Storage Battery
- 9.2. Market Analysis, Insights and Forecast - by Types
- 9.2.1. LiTFSI
- 9.2.2. LiFSI
- 9.1. Market Analysis, Insights and Forecast - by Application
- 10. Asia Pacific Fluorinated Conductive Salts for Lithium Battery Analysis, Insights and Forecast, 2020-2032
- 10.1. Market Analysis, Insights and Forecast - by Application
- 10.1.1. Power Battery
- 10.1.2. Consumer Electronics Battery
- 10.1.3. Energy Storage Battery
- 10.2. Market Analysis, Insights and Forecast - by Types
- 10.2.1. LiTFSI
- 10.2.2. LiFSI
- 10.1. Market Analysis, Insights and Forecast - by Application
- 11. Competitive Analysis
- 11.1. Global Market Share Analysis 2025
- 11.2. Company Profiles
- 11.2.1 Solvay
- 11.2.1.1. Overview
- 11.2.1.2. Products
- 11.2.1.3. SWOT Analysis
- 11.2.1.4. Recent Developments
- 11.2.1.5. Financials (Based on Availability)
- 11.2.2 Jiangsu Ruitai New Energy Materials
- 11.2.2.1. Overview
- 11.2.2.2. Products
- 11.2.2.3. SWOT Analysis
- 11.2.2.4. Recent Developments
- 11.2.2.5. Financials (Based on Availability)
- 11.2.3 3M
- 11.2.3.1. Overview
- 11.2.3.2. Products
- 11.2.3.3. SWOT Analysis
- 11.2.3.4. Recent Developments
- 11.2.3.5. Financials (Based on Availability)
- 11.2.4 Syensqo
- 11.2.4.1. Overview
- 11.2.4.2. Products
- 11.2.4.3. SWOT Analysis
- 11.2.4.4. Recent Developments
- 11.2.4.5. Financials (Based on Availability)
- 11.2.5 Tinci Materials
- 11.2.5.1. Overview
- 11.2.5.2. Products
- 11.2.5.3. SWOT Analysis
- 11.2.5.4. Recent Developments
- 11.2.5.5. Financials (Based on Availability)
- 11.2.6 Shenzhen Capchem Technology
- 11.2.6.1. Overview
- 11.2.6.2. Products
- 11.2.6.3. SWOT Analysis
- 11.2.6.4. Recent Developments
- 11.2.6.5. Financials (Based on Availability)
- 11.2.7 Shanghai Chemspec Corporation
- 11.2.7.1. Overview
- 11.2.7.2. Products
- 11.2.7.3. SWOT Analysis
- 11.2.7.4. Recent Developments
- 11.2.7.5. Financials (Based on Availability)
- 11.2.8 Do-Fluoride New Materials
- 11.2.8.1. Overview
- 11.2.8.2. Products
- 11.2.8.3. SWOT Analysis
- 11.2.8.4. Recent Developments
- 11.2.8.5. Financials (Based on Availability)
- 11.2.9 Zhejiang Yongtai Technology
- 11.2.9.1. Overview
- 11.2.9.2. Products
- 11.2.9.3. SWOT Analysis
- 11.2.9.4. Recent Developments
- 11.2.9.5. Financials (Based on Availability)
- 11.2.10 Jiangsu HSC New Energy Materials
- 11.2.10.1. Overview
- 11.2.10.2. Products
- 11.2.10.3. SWOT Analysis
- 11.2.10.4. Recent Developments
- 11.2.10.5. Financials (Based on Availability)
- 11.2.11 Nippon Shokubai
- 11.2.11.1. Overview
- 11.2.11.2. Products
- 11.2.11.3. SWOT Analysis
- 11.2.11.4. Recent Developments
- 11.2.11.5. Financials (Based on Availability)
- 11.2.12 Chunbo Chem
- 11.2.12.1. Overview
- 11.2.12.2. Products
- 11.2.12.3. SWOT Analysis
- 11.2.12.4. Recent Developments
- 11.2.12.5. Financials (Based on Availability)
- 11.2.13 Arkema
- 11.2.13.1. Overview
- 11.2.13.2. Products
- 11.2.13.3. SWOT Analysis
- 11.2.13.4. Recent Developments
- 11.2.13.5. Financials (Based on Availability)
- 11.2.1 Solvay
List of Figures
- Figure 1: Global Fluorinated Conductive Salts for Lithium Battery Revenue Breakdown (billion, %) by Region 2025 & 2033
- Figure 2: Global Fluorinated Conductive Salts for Lithium Battery Volume Breakdown (K, %) by Region 2025 & 2033
- Figure 3: North America Fluorinated Conductive Salts for Lithium Battery Revenue (billion), by Application 2025 & 2033
- Figure 4: North America Fluorinated Conductive Salts for Lithium Battery Volume (K), by Application 2025 & 2033
- Figure 5: North America Fluorinated Conductive Salts for Lithium Battery Revenue Share (%), by Application 2025 & 2033
- Figure 6: North America Fluorinated Conductive Salts for Lithium Battery Volume Share (%), by Application 2025 & 2033
- Figure 7: North America Fluorinated Conductive Salts for Lithium Battery Revenue (billion), by Types 2025 & 2033
- Figure 8: North America Fluorinated Conductive Salts for Lithium Battery Volume (K), by Types 2025 & 2033
- Figure 9: North America Fluorinated Conductive Salts for Lithium Battery Revenue Share (%), by Types 2025 & 2033
- Figure 10: North America Fluorinated Conductive Salts for Lithium Battery Volume Share (%), by Types 2025 & 2033
- Figure 11: North America Fluorinated Conductive Salts for Lithium Battery Revenue (billion), by Country 2025 & 2033
- Figure 12: North America Fluorinated Conductive Salts for Lithium Battery Volume (K), by Country 2025 & 2033
- Figure 13: North America Fluorinated Conductive Salts for Lithium Battery Revenue Share (%), by Country 2025 & 2033
- Figure 14: North America Fluorinated Conductive Salts for Lithium Battery Volume Share (%), by Country 2025 & 2033
- Figure 15: South America Fluorinated Conductive Salts for Lithium Battery Revenue (billion), by Application 2025 & 2033
- Figure 16: South America Fluorinated Conductive Salts for Lithium Battery Volume (K), by Application 2025 & 2033
- Figure 17: South America Fluorinated Conductive Salts for Lithium Battery Revenue Share (%), by Application 2025 & 2033
- Figure 18: South America Fluorinated Conductive Salts for Lithium Battery Volume Share (%), by Application 2025 & 2033
- Figure 19: South America Fluorinated Conductive Salts for Lithium Battery Revenue (billion), by Types 2025 & 2033
- Figure 20: South America Fluorinated Conductive Salts for Lithium Battery Volume (K), by Types 2025 & 2033
- Figure 21: South America Fluorinated Conductive Salts for Lithium Battery Revenue Share (%), by Types 2025 & 2033
- Figure 22: South America Fluorinated Conductive Salts for Lithium Battery Volume Share (%), by Types 2025 & 2033
- Figure 23: South America Fluorinated Conductive Salts for Lithium Battery Revenue (billion), by Country 2025 & 2033
- Figure 24: South America Fluorinated Conductive Salts for Lithium Battery Volume (K), by Country 2025 & 2033
- Figure 25: South America Fluorinated Conductive Salts for Lithium Battery Revenue Share (%), by Country 2025 & 2033
- Figure 26: South America Fluorinated Conductive Salts for Lithium Battery Volume Share (%), by Country 2025 & 2033
- Figure 27: Europe Fluorinated Conductive Salts for Lithium Battery Revenue (billion), by Application 2025 & 2033
- Figure 28: Europe Fluorinated Conductive Salts for Lithium Battery Volume (K), by Application 2025 & 2033
- Figure 29: Europe Fluorinated Conductive Salts for Lithium Battery Revenue Share (%), by Application 2025 & 2033
- Figure 30: Europe Fluorinated Conductive Salts for Lithium Battery Volume Share (%), by Application 2025 & 2033
- Figure 31: Europe Fluorinated Conductive Salts for Lithium Battery Revenue (billion), by Types 2025 & 2033
- Figure 32: Europe Fluorinated Conductive Salts for Lithium Battery Volume (K), by Types 2025 & 2033
- Figure 33: Europe Fluorinated Conductive Salts for Lithium Battery Revenue Share (%), by Types 2025 & 2033
- Figure 34: Europe Fluorinated Conductive Salts for Lithium Battery Volume Share (%), by Types 2025 & 2033
- Figure 35: Europe Fluorinated Conductive Salts for Lithium Battery Revenue (billion), by Country 2025 & 2033
- Figure 36: Europe Fluorinated Conductive Salts for Lithium Battery Volume (K), by Country 2025 & 2033
- Figure 37: Europe Fluorinated Conductive Salts for Lithium Battery Revenue Share (%), by Country 2025 & 2033
- Figure 38: Europe Fluorinated Conductive Salts for Lithium Battery Volume Share (%), by Country 2025 & 2033
- Figure 39: Middle East & Africa Fluorinated Conductive Salts for Lithium Battery Revenue (billion), by Application 2025 & 2033
- Figure 40: Middle East & Africa Fluorinated Conductive Salts for Lithium Battery Volume (K), by Application 2025 & 2033
- Figure 41: Middle East & Africa Fluorinated Conductive Salts for Lithium Battery Revenue Share (%), by Application 2025 & 2033
- Figure 42: Middle East & Africa Fluorinated Conductive Salts for Lithium Battery Volume Share (%), by Application 2025 & 2033
- Figure 43: Middle East & Africa Fluorinated Conductive Salts for Lithium Battery Revenue (billion), by Types 2025 & 2033
- Figure 44: Middle East & Africa Fluorinated Conductive Salts for Lithium Battery Volume (K), by Types 2025 & 2033
- Figure 45: Middle East & Africa Fluorinated Conductive Salts for Lithium Battery Revenue Share (%), by Types 2025 & 2033
- Figure 46: Middle East & Africa Fluorinated Conductive Salts for Lithium Battery Volume Share (%), by Types 2025 & 2033
- Figure 47: Middle East & Africa Fluorinated Conductive Salts for Lithium Battery Revenue (billion), by Country 2025 & 2033
- Figure 48: Middle East & Africa Fluorinated Conductive Salts for Lithium Battery Volume (K), by Country 2025 & 2033
- Figure 49: Middle East & Africa Fluorinated Conductive Salts for Lithium Battery Revenue Share (%), by Country 2025 & 2033
- Figure 50: Middle East & Africa Fluorinated Conductive Salts for Lithium Battery Volume Share (%), by Country 2025 & 2033
- Figure 51: Asia Pacific Fluorinated Conductive Salts for Lithium Battery Revenue (billion), by Application 2025 & 2033
- Figure 52: Asia Pacific Fluorinated Conductive Salts for Lithium Battery Volume (K), by Application 2025 & 2033
- Figure 53: Asia Pacific Fluorinated Conductive Salts for Lithium Battery Revenue Share (%), by Application 2025 & 2033
- Figure 54: Asia Pacific Fluorinated Conductive Salts for Lithium Battery Volume Share (%), by Application 2025 & 2033
- Figure 55: Asia Pacific Fluorinated Conductive Salts for Lithium Battery Revenue (billion), by Types 2025 & 2033
- Figure 56: Asia Pacific Fluorinated Conductive Salts for Lithium Battery Volume (K), by Types 2025 & 2033
- Figure 57: Asia Pacific Fluorinated Conductive Salts for Lithium Battery Revenue Share (%), by Types 2025 & 2033
- Figure 58: Asia Pacific Fluorinated Conductive Salts for Lithium Battery Volume Share (%), by Types 2025 & 2033
- Figure 59: Asia Pacific Fluorinated Conductive Salts for Lithium Battery Revenue (billion), by Country 2025 & 2033
- Figure 60: Asia Pacific Fluorinated Conductive Salts for Lithium Battery Volume (K), by Country 2025 & 2033
- Figure 61: Asia Pacific Fluorinated Conductive Salts for Lithium Battery Revenue Share (%), by Country 2025 & 2033
- Figure 62: Asia Pacific Fluorinated Conductive Salts for Lithium Battery Volume Share (%), by Country 2025 & 2033
List of Tables
- Table 1: Global Fluorinated Conductive Salts for Lithium Battery Revenue billion Forecast, by Application 2020 & 2033
- Table 2: Global Fluorinated Conductive Salts for Lithium Battery Volume K Forecast, by Application 2020 & 2033
- Table 3: Global Fluorinated Conductive Salts for Lithium Battery Revenue billion Forecast, by Types 2020 & 2033
- Table 4: Global Fluorinated Conductive Salts for Lithium Battery Volume K Forecast, by Types 2020 & 2033
- Table 5: Global Fluorinated Conductive Salts for Lithium Battery Revenue billion Forecast, by Region 2020 & 2033
- Table 6: Global Fluorinated Conductive Salts for Lithium Battery Volume K Forecast, by Region 2020 & 2033
- Table 7: Global Fluorinated Conductive Salts for Lithium Battery Revenue billion Forecast, by Application 2020 & 2033
- Table 8: Global Fluorinated Conductive Salts for Lithium Battery Volume K Forecast, by Application 2020 & 2033
- Table 9: Global Fluorinated Conductive Salts for Lithium Battery Revenue billion Forecast, by Types 2020 & 2033
- Table 10: Global Fluorinated Conductive Salts for Lithium Battery Volume K Forecast, by Types 2020 & 2033
- Table 11: Global Fluorinated Conductive Salts for Lithium Battery Revenue billion Forecast, by Country 2020 & 2033
- Table 12: Global Fluorinated Conductive Salts for Lithium Battery Volume K Forecast, by Country 2020 & 2033
- Table 13: United States Fluorinated Conductive Salts for Lithium Battery Revenue (billion) Forecast, by Application 2020 & 2033
- Table 14: United States Fluorinated Conductive Salts for Lithium Battery Volume (K) Forecast, by Application 2020 & 2033
- Table 15: Canada Fluorinated Conductive Salts for Lithium Battery Revenue (billion) Forecast, by Application 2020 & 2033
- Table 16: Canada Fluorinated Conductive Salts for Lithium Battery Volume (K) Forecast, by Application 2020 & 2033
- Table 17: Mexico Fluorinated Conductive Salts for Lithium Battery Revenue (billion) Forecast, by Application 2020 & 2033
- Table 18: Mexico Fluorinated Conductive Salts for Lithium Battery Volume (K) Forecast, by Application 2020 & 2033
- Table 19: Global Fluorinated Conductive Salts for Lithium Battery Revenue billion Forecast, by Application 2020 & 2033
- Table 20: Global Fluorinated Conductive Salts for Lithium Battery Volume K Forecast, by Application 2020 & 2033
- Table 21: Global Fluorinated Conductive Salts for Lithium Battery Revenue billion Forecast, by Types 2020 & 2033
- Table 22: Global Fluorinated Conductive Salts for Lithium Battery Volume K Forecast, by Types 2020 & 2033
- Table 23: Global Fluorinated Conductive Salts for Lithium Battery Revenue billion Forecast, by Country 2020 & 2033
- Table 24: Global Fluorinated Conductive Salts for Lithium Battery Volume K Forecast, by Country 2020 & 2033
- Table 25: Brazil Fluorinated Conductive Salts for Lithium Battery Revenue (billion) Forecast, by Application 2020 & 2033
- Table 26: Brazil Fluorinated Conductive Salts for Lithium Battery Volume (K) Forecast, by Application 2020 & 2033
- Table 27: Argentina Fluorinated Conductive Salts for Lithium Battery Revenue (billion) Forecast, by Application 2020 & 2033
- Table 28: Argentina Fluorinated Conductive Salts for Lithium Battery Volume (K) Forecast, by Application 2020 & 2033
- Table 29: Rest of South America Fluorinated Conductive Salts for Lithium Battery Revenue (billion) Forecast, by Application 2020 & 2033
- Table 30: Rest of South America Fluorinated Conductive Salts for Lithium Battery Volume (K) Forecast, by Application 2020 & 2033
- Table 31: Global Fluorinated Conductive Salts for Lithium Battery Revenue billion Forecast, by Application 2020 & 2033
- Table 32: Global Fluorinated Conductive Salts for Lithium Battery Volume K Forecast, by Application 2020 & 2033
- Table 33: Global Fluorinated Conductive Salts for Lithium Battery Revenue billion Forecast, by Types 2020 & 2033
- Table 34: Global Fluorinated Conductive Salts for Lithium Battery Volume K Forecast, by Types 2020 & 2033
- Table 35: Global Fluorinated Conductive Salts for Lithium Battery Revenue billion Forecast, by Country 2020 & 2033
- Table 36: Global Fluorinated Conductive Salts for Lithium Battery Volume K Forecast, by Country 2020 & 2033
- Table 37: United Kingdom Fluorinated Conductive Salts for Lithium Battery Revenue (billion) Forecast, by Application 2020 & 2033
- Table 38: United Kingdom Fluorinated Conductive Salts for Lithium Battery Volume (K) Forecast, by Application 2020 & 2033
- Table 39: Germany Fluorinated Conductive Salts for Lithium Battery Revenue (billion) Forecast, by Application 2020 & 2033
- Table 40: Germany Fluorinated Conductive Salts for Lithium Battery Volume (K) Forecast, by Application 2020 & 2033
- Table 41: France Fluorinated Conductive Salts for Lithium Battery Revenue (billion) Forecast, by Application 2020 & 2033
- Table 42: France Fluorinated Conductive Salts for Lithium Battery Volume (K) Forecast, by Application 2020 & 2033
- Table 43: Italy Fluorinated Conductive Salts for Lithium Battery Revenue (billion) Forecast, by Application 2020 & 2033
- Table 44: Italy Fluorinated Conductive Salts for Lithium Battery Volume (K) Forecast, by Application 2020 & 2033
- Table 45: Spain Fluorinated Conductive Salts for Lithium Battery Revenue (billion) Forecast, by Application 2020 & 2033
- Table 46: Spain Fluorinated Conductive Salts for Lithium Battery Volume (K) Forecast, by Application 2020 & 2033
- Table 47: Russia Fluorinated Conductive Salts for Lithium Battery Revenue (billion) Forecast, by Application 2020 & 2033
- Table 48: Russia Fluorinated Conductive Salts for Lithium Battery Volume (K) Forecast, by Application 2020 & 2033
- Table 49: Benelux Fluorinated Conductive Salts for Lithium Battery Revenue (billion) Forecast, by Application 2020 & 2033
- Table 50: Benelux Fluorinated Conductive Salts for Lithium Battery Volume (K) Forecast, by Application 2020 & 2033
- Table 51: Nordics Fluorinated Conductive Salts for Lithium Battery Revenue (billion) Forecast, by Application 2020 & 2033
- Table 52: Nordics Fluorinated Conductive Salts for Lithium Battery Volume (K) Forecast, by Application 2020 & 2033
- Table 53: Rest of Europe Fluorinated Conductive Salts for Lithium Battery Revenue (billion) Forecast, by Application 2020 & 2033
- Table 54: Rest of Europe Fluorinated Conductive Salts for Lithium Battery Volume (K) Forecast, by Application 2020 & 2033
- Table 55: Global Fluorinated Conductive Salts for Lithium Battery Revenue billion Forecast, by Application 2020 & 2033
- Table 56: Global Fluorinated Conductive Salts for Lithium Battery Volume K Forecast, by Application 2020 & 2033
- Table 57: Global Fluorinated Conductive Salts for Lithium Battery Revenue billion Forecast, by Types 2020 & 2033
- Table 58: Global Fluorinated Conductive Salts for Lithium Battery Volume K Forecast, by Types 2020 & 2033
- Table 59: Global Fluorinated Conductive Salts for Lithium Battery Revenue billion Forecast, by Country 2020 & 2033
- Table 60: Global Fluorinated Conductive Salts for Lithium Battery Volume K Forecast, by Country 2020 & 2033
- Table 61: Turkey Fluorinated Conductive Salts for Lithium Battery Revenue (billion) Forecast, by Application 2020 & 2033
- Table 62: Turkey Fluorinated Conductive Salts for Lithium Battery Volume (K) Forecast, by Application 2020 & 2033
- Table 63: Israel Fluorinated Conductive Salts for Lithium Battery Revenue (billion) Forecast, by Application 2020 & 2033
- Table 64: Israel Fluorinated Conductive Salts for Lithium Battery Volume (K) Forecast, by Application 2020 & 2033
- Table 65: GCC Fluorinated Conductive Salts for Lithium Battery Revenue (billion) Forecast, by Application 2020 & 2033
- Table 66: GCC Fluorinated Conductive Salts for Lithium Battery Volume (K) Forecast, by Application 2020 & 2033
- Table 67: North Africa Fluorinated Conductive Salts for Lithium Battery Revenue (billion) Forecast, by Application 2020 & 2033
- Table 68: North Africa Fluorinated Conductive Salts for Lithium Battery Volume (K) Forecast, by Application 2020 & 2033
- Table 69: South Africa Fluorinated Conductive Salts for Lithium Battery Revenue (billion) Forecast, by Application 2020 & 2033
- Table 70: South Africa Fluorinated Conductive Salts for Lithium Battery Volume (K) Forecast, by Application 2020 & 2033
- Table 71: Rest of Middle East & Africa Fluorinated Conductive Salts for Lithium Battery Revenue (billion) Forecast, by Application 2020 & 2033
- Table 72: Rest of Middle East & Africa Fluorinated Conductive Salts for Lithium Battery Volume (K) Forecast, by Application 2020 & 2033
- Table 73: Global Fluorinated Conductive Salts for Lithium Battery Revenue billion Forecast, by Application 2020 & 2033
- Table 74: Global Fluorinated Conductive Salts for Lithium Battery Volume K Forecast, by Application 2020 & 2033
- Table 75: Global Fluorinated Conductive Salts for Lithium Battery Revenue billion Forecast, by Types 2020 & 2033
- Table 76: Global Fluorinated Conductive Salts for Lithium Battery Volume K Forecast, by Types 2020 & 2033
- Table 77: Global Fluorinated Conductive Salts for Lithium Battery Revenue billion Forecast, by Country 2020 & 2033
- Table 78: Global Fluorinated Conductive Salts for Lithium Battery Volume K Forecast, by Country 2020 & 2033
- Table 79: China Fluorinated Conductive Salts for Lithium Battery Revenue (billion) Forecast, by Application 2020 & 2033
- Table 80: China Fluorinated Conductive Salts for Lithium Battery Volume (K) Forecast, by Application 2020 & 2033
- Table 81: India Fluorinated Conductive Salts for Lithium Battery Revenue (billion) Forecast, by Application 2020 & 2033
- Table 82: India Fluorinated Conductive Salts for Lithium Battery Volume (K) Forecast, by Application 2020 & 2033
- Table 83: Japan Fluorinated Conductive Salts for Lithium Battery Revenue (billion) Forecast, by Application 2020 & 2033
- Table 84: Japan Fluorinated Conductive Salts for Lithium Battery Volume (K) Forecast, by Application 2020 & 2033
- Table 85: South Korea Fluorinated Conductive Salts for Lithium Battery Revenue (billion) Forecast, by Application 2020 & 2033
- Table 86: South Korea Fluorinated Conductive Salts for Lithium Battery Volume (K) Forecast, by Application 2020 & 2033
- Table 87: ASEAN Fluorinated Conductive Salts for Lithium Battery Revenue (billion) Forecast, by Application 2020 & 2033
- Table 88: ASEAN Fluorinated Conductive Salts for Lithium Battery Volume (K) Forecast, by Application 2020 & 2033
- Table 89: Oceania Fluorinated Conductive Salts for Lithium Battery Revenue (billion) Forecast, by Application 2020 & 2033
- Table 90: Oceania Fluorinated Conductive Salts for Lithium Battery Volume (K) Forecast, by Application 2020 & 2033
- Table 91: Rest of Asia Pacific Fluorinated Conductive Salts for Lithium Battery Revenue (billion) Forecast, by Application 2020 & 2033
- Table 92: Rest of Asia Pacific Fluorinated Conductive Salts for Lithium Battery Volume (K) Forecast, by Application 2020 & 2033
Frequently Asked Questions
1. What is the projected Compound Annual Growth Rate (CAGR) of the Fluorinated Conductive Salts for Lithium Battery?
The projected CAGR is approximately 19.1%.
2. Which companies are prominent players in the Fluorinated Conductive Salts for Lithium Battery?
Key companies in the market include Solvay, Jiangsu Ruitai New Energy Materials, 3M, Syensqo, Tinci Materials, Shenzhen Capchem Technology, Shanghai Chemspec Corporation, Do-Fluoride New Materials, Zhejiang Yongtai Technology, Jiangsu HSC New Energy Materials, Nippon Shokubai, Chunbo Chem, Arkema.
3. What are the main segments of the Fluorinated Conductive Salts for Lithium Battery?
The market segments include Application, Types.
4. Can you provide details about the market size?
The market size is estimated to be USD 3.67 billion as of 2022.
5. What are some drivers contributing to market growth?
N/A
6. What are the notable trends driving market growth?
N/A
7. Are there any restraints impacting market growth?
N/A
8. Can you provide examples of recent developments in the market?
N/A
9. What pricing options are available for accessing the report?
Pricing options include single-user, multi-user, and enterprise licenses priced at USD 4350.00, USD 6525.00, and USD 8700.00 respectively.
10. Is the market size provided in terms of value or volume?
The market size is provided in terms of value, measured in billion and volume, measured in K.
11. Are there any specific market keywords associated with the report?
Yes, the market keyword associated with the report is "Fluorinated Conductive Salts for Lithium Battery," which aids in identifying and referencing the specific market segment covered.
12. How do I determine which pricing option suits my needs best?
The pricing options vary based on user requirements and access needs. Individual users may opt for single-user licenses, while businesses requiring broader access may choose multi-user or enterprise licenses for cost-effective access to the report.
13. Are there any additional resources or data provided in the Fluorinated Conductive Salts for Lithium Battery report?
While the report offers comprehensive insights, it's advisable to review the specific contents or supplementary materials provided to ascertain if additional resources or data are available.
14. How can I stay updated on further developments or reports in the Fluorinated Conductive Salts for Lithium Battery?
To stay informed about further developments, trends, and reports in the Fluorinated Conductive Salts for Lithium Battery, consider subscribing to industry newsletters, following relevant companies and organizations, or regularly checking reputable industry news sources and publications.
Methodology
Step 1 - Identification of Relevant Samples Size from Population Database


Step 2 - Approaches for Defining Global Market Size (Value, Volume* & Price*)

Note*: In applicable scenarios
Step 3 - Data Sources
Primary Research
- Web Analytics
- Survey Reports
- Research Institute
- Latest Research Reports
- Opinion Leaders
Secondary Research
- Annual Reports
- White Paper
- Latest Press Release
- Industry Association
- Paid Database
- Investor Presentations

Step 4 - Data Triangulation
Involves using different sources of information in order to increase the validity of a study
These sources are likely to be stakeholders in a program - participants, other researchers, program staff, other community members, and so on.
Then we put all data in single framework & apply various statistical tools to find out the dynamic on the market.
During the analysis stage, feedback from the stakeholder groups would be compared to determine areas of agreement as well as areas of divergence