

Key Insights
The US sealants market is poised for significant growth, driven by robust expansion across key end-user industries such as automotive, aerospace, and building & construction. With an estimated market size of $7.71 billion in 2025, the industry is projected to expand at a Compound Annual Growth Rate (CAGR) of 6% through 2033. This sustained growth is underpinned by increasing demand for high-performance sealants that offer superior durability, flexibility, and environmental resistance. Advancements in material science, leading to the development of innovative resin formulations like epoxies and polyurethanes, are further propelling market penetration. The burgeoning construction sector, fueled by infrastructure development and residential projects, alongside the automotive industry's need for advanced sealing solutions in vehicle assembly and repair, are primary growth catalysts. The healthcare sector's increasing adoption of specialized sealants for medical devices and facilities also contributes to market dynamism.
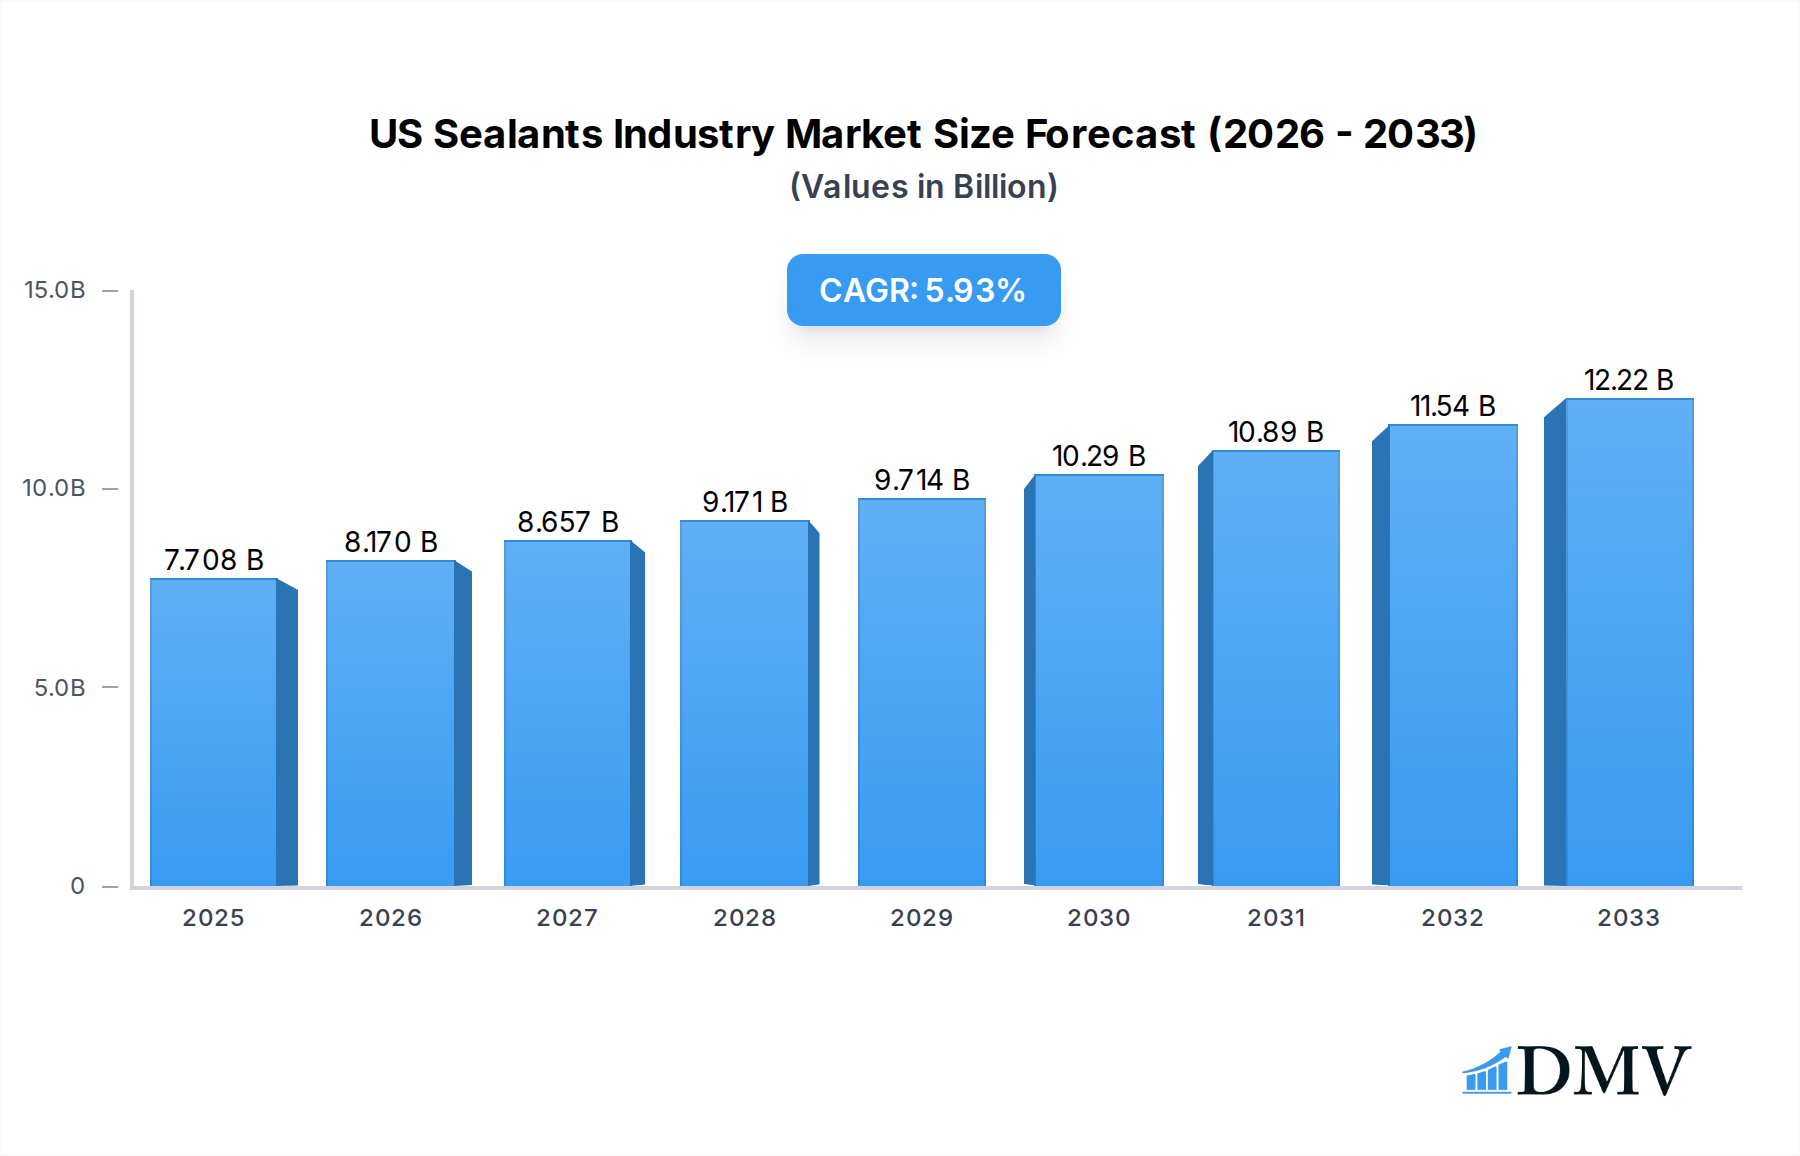
US Sealants Industry Market Size (In Billion)
The market is expected to witness a substantial increase in value, reaching approximately $12.36 billion by 2033. While the market benefits from strong demand, certain restraints may influence its trajectory. Stringent environmental regulations concerning volatile organic compounds (VOCs) in certain sealant types necessitate a shift towards eco-friendly alternatives, presenting both a challenge and an opportunity for manufacturers. Moreover, fluctuations in raw material prices, particularly for petrochemical-derived components, can impact profit margins and market pricing strategies. However, the industry's ability to innovate and adapt to these challenges, coupled with the continuous demand for specialized sealing solutions across diverse applications, ensures a positive outlook for the US sealants market. Key players like Henkel AG & Co. KGaA, 3M, and Sika AG are actively investing in research and development to introduce next-generation sealants, thereby shaping the competitive landscape and driving future market expansion.

US Sealants Industry Company Market Share
US Sealants Industry Market Composition & Trends
The US sealants market is a dynamic sector characterized by a moderate to high concentration, with major players like Henkel AG & Co KGaA, RPM International Inc., 3M, Illinois Tool Works Inc., Arkema Group, Dow, H B Fuller Company, Sika AG, MAPEI S.p.A., and Pecora Corporation commanding significant market share. Innovation is a key catalyst, driven by the demand for high-performance, sustainable, and specialized sealant solutions across diverse end-user industries. Regulatory landscapes, including environmental standards and building codes, also play a crucial role in shaping product development and market adoption. Substitute products, while present, often fall short in offering the same level of adhesion, durability, and environmental resistance as advanced sealants. End-user profiles are increasingly sophisticated, with a focus on energy efficiency, longevity, and ease of application. Mergers and acquisitions (M&A) activities, valued at an estimated $XXX billion over the historical period (2019-2024), are shaping market consolidation and expanding product portfolios. The market share distribution is fragmented, with key players holding substantial portions, while niche segments are catered to by smaller, specialized manufacturers.
- Market Concentration: Moderate to High, with a few dominant global players.
- Innovation Catalysts: Demand for eco-friendly, high-performance, and specialized sealants.
- Regulatory Landscapes: Environmental standards (e.g., VOC limits), building codes, and safety regulations.
- Substitute Products: Adhesives, tapes, and mechanical fastening systems, often lacking specific sealant properties.
- End-User Profiles: Growing demand for durability, energy efficiency, and ease of application.
- M&A Activities: Estimated $XXX billion in M&A deal values during the historical period (2019-2024).
US Sealants Industry Industry Evolution
The US sealants industry has witnessed a robust growth trajectory, consistently expanding its market value from an estimated $XXX billion in 2019 to a projected $XXX billion by 2025. This evolution is intrinsically linked to advancements in material science and chemical engineering, which have enabled the development of sealants with enhanced properties such as superior adhesion, increased flexibility, improved UV resistance, and faster curing times. Technological advancements have also focused on reducing volatile organic compound (VOC) emissions, aligning with growing environmental consciousness and stricter regulatory mandates. Consumer demand has shifted towards sustainable and eco-friendly sealant options, spurring innovation in water-based and low-VOC formulations. The building and construction sector, a cornerstone of sealant demand, has benefited immensely from these innovations, with sealants playing a critical role in energy-efficient building designs, weatherproofing, and structural integrity. The automotive industry's pursuit of lighter, more fuel-efficient vehicles has also driven demand for advanced sealants that can bond dissimilar materials and withstand harsh operating conditions. The healthcare sector's stringent requirements for biocompatibility and sterile environments have led to the development of specialized medical-grade sealants. Overall, the industry's evolution is characterized by a responsive adaptation to market needs, technological breakthroughs, and a commitment to sustainability, propelling consistent market growth rates averaging XX% annually during the historical period (2019-2024) and projected at XX% for the forecast period (2025-2033). The adoption of advanced sealant technologies has seen a significant upward trend, with a XX% increase in the usage of high-performance polyurethanes and silicones in key applications.
Leading Regions, Countries, or Segments in US Sealants Industry
The Building and Construction end-user industry stands as the dominant segment within the US sealants market, driven by extensive infrastructure development, residential and commercial construction activities, and the increasing emphasis on energy-efficient building envelopes. The Automotive sector also represents a significant and growing segment, fueled by the demand for lightweighting, improved vehicle performance, and the integration of advanced driver-assistance systems (ADAS) that require sophisticated bonding and sealing solutions. In terms of resin types, Silicone and Polyurethane sealants are at the forefront, owing to their exceptional durability, flexibility, and weather resistance, making them indispensable in numerous applications across these leading industries. The Acrylic resin segment also holds a substantial market share, particularly in architectural and general construction applications where cost-effectiveness and ease of use are prioritized.
- Dominant End-User Industry: Building and Construction
- Key Drivers:
- Robust infrastructure spending and ongoing residential/commercial projects.
- Growing demand for energy-efficient buildings and weatherproofing solutions.
- Renovation and remodeling activities increasing the need for sealants.
- Stringent building codes mandating effective sealing for performance and safety.
- Adoption of advanced building materials requiring specialized sealing.
- Key Drivers:
- Significant End-User Industry: Automotive
- Key Drivers:
- Trend towards vehicle lightweighting and the use of composite materials.
- Demand for improved NVH (Noise, Vibration, and Harshness) reduction.
- Development of electric vehicles (EVs) with unique sealing requirements.
- Integration of advanced technologies requiring durable and flexible seals.
- Key Drivers:
- Leading Resin Types: Silicone and Polyurethane
- Dominance Factors:
- Exceptional durability, flexibility, and resistance to extreme temperatures and UV radiation.
- Versatility in bonding diverse substrates.
- Crucial for high-performance applications in construction and automotive.
- Increasing use in aerospace for structural integrity and environmental sealing.
- Dominance Factors:
- Other Significant Resin Type: Acrylic
- Dominance Factors:
- Cost-effectiveness and ease of application for architectural and general use.
- Good adhesion to a wide range of building materials.
- Continuous development of lower-VOC and water-based formulations.
- Dominance Factors:
US Sealants Industry Product Innovations
Product innovations in the US sealants industry are sharply focused on enhancing performance, sustainability, and application efficiency. Companies are introducing advanced formulations with self-healing properties, significantly extending product lifespan and reducing maintenance needs. Smart sealants that can change color to indicate curing status or detect potential leaks are emerging, offering greater user convenience and reliability. Furthermore, a significant push towards bio-based and recycled content sealants is underway, catering to the growing demand for environmentally responsible construction materials. These innovations are not only improving the functional attributes of sealants but also contributing to reduced VOC emissions and enhanced energy efficiency in buildings and vehicles.
Propelling Factors for US Sealants Industry Growth
Several factors are propelling the growth of the US sealants industry. The burgeoning construction sector, driven by both new builds and extensive renovations, creates a consistent demand for high-performance sealants. Technological advancements in sealant formulations, leading to improved adhesion, durability, and sustainability, are further fueling market expansion. Stringent environmental regulations and building codes mandating energy efficiency and low VOC emissions are pushing manufacturers to develop innovative and eco-friendly solutions. The automotive industry's continuous evolution towards lightweighting and electric vehicles also necessitates advanced sealing technologies.
- Robust Construction Activity: Increased residential, commercial, and infrastructure projects.
- Technological Advancements: Development of high-performance, durable, and sustainable sealants.
- Environmental Regulations & Building Codes: Mandates for energy efficiency and reduced VOCs.
- Automotive Industry Trends: Lightweighting, EV development, and advanced manufacturing.
- Infrastructure Modernization: Need for durable sealants in infrastructure repair and upgrades.
Obstacles in the US Sealants Industry Market
Despite its growth, the US sealants industry faces several obstacles. Volatility in raw material prices, particularly for petrochemical-based components, can impact production costs and profit margins. Intense competition among a large number of domestic and international players, including those offering lower-cost alternatives, puts pressure on pricing. Evolving and sometimes complex regulatory frameworks regarding chemical safety and environmental impact require continuous adaptation and investment in compliance. Supply chain disruptions, as witnessed in recent years, can affect the availability of key raw materials and finished goods, leading to production delays and increased lead times.
- Raw Material Price Volatility: Fluctuations in the cost of key ingredients.
- Intense Competition: Presence of numerous players and substitute products.
- Complex Regulatory Environment: Evolving standards for safety and environmental impact.
- Supply Chain Disruptions: Challenges in sourcing raw materials and delivering finished products.
- Skilled Labor Shortages: Difficulty in finding qualified personnel for manufacturing and application.
Future Opportunities in US Sealants Industry
The US sealants industry is poised for significant future opportunities driven by emerging trends and evolving market demands. The increasing focus on green building and sustainable construction practices presents a substantial opportunity for eco-friendly, low-VOC, and bio-based sealants. Advancements in smart technologies are paving the way for the development of "intelligent" sealants with self-monitoring and diagnostic capabilities, creating niche markets. The continued growth of the electric vehicle market will require specialized sealants for battery packs, thermal management, and structural components. Furthermore, the ongoing repair and retrofitting of existing infrastructure and buildings will sustain a steady demand for high-performance sealants.
- Sustainable & Green Sealants: Growing demand for eco-friendly and bio-based formulations.
- Smart & Intelligent Sealants: Development of self-monitoring and diagnostic sealant technologies.
- Electric Vehicle Market: Specialized sealing solutions for EV components and battery systems.
- Infrastructure Modernization & Retrofitting: Demand for durable and long-lasting sealants for repairs and upgrades.
- Advanced Manufacturing & Construction Techniques: Integration of sealants with new building methods.
Major Players in the US Sealants Industry Ecosystem
- Henkel AG & Co KGaA
- RPM International Inc.
- 3M
- Illinois Tool Works Inc.
- Arkema Group
- Dow
- H B Fuller Company
- Sika AG
- MAPEI S.p.A.
- Pecora Corporation
Key Developments in US Sealants Industry Industry
- July 2021: RPM International Inc. procured a 178,000-square-foot chemical manufacturing facility in Texas to act as a manufacturing campus, owned and operated by RPM’s Tremco Construction Products Group, to meet customer demand and strengthen its supply chain.
- April 2021: Sika AG signed an agreement to acquire The Yokohama Rubber Co. Ltd's adhesives division, Hamatite, based in Japan. Hamatite offers polyurethanes, hot melts, and modified silicones technology adhesives and sealants for the automotive and construction industries.
- January 2020: H.B. Fuller Company introduced a new range of Gorilla professional-grade adhesives and sealants for MRO industrial applications.
Strategic US Sealants Industry Market Forecast
The strategic forecast for the US sealants industry indicates sustained and robust growth, driven by an confluence of technological innovation, evolving end-user demands, and supportive economic and regulatory factors. The continued emphasis on sustainability and energy efficiency will create significant opportunities for advanced, eco-friendly sealant solutions. Emerging trends such as smart sealants and specialized applications for electric vehicles will open new revenue streams. Investments in infrastructure and a resilient construction market will provide a foundational demand. Market participants who can effectively navigate raw material volatilities and leverage strategic partnerships will be well-positioned to capitalize on the immense market potential projected over the forecast period (2025–2033).
US Sealants Industry Segmentation
-
1. End User Industry
- 1.1. Aerospace
- 1.2. Automotive
- 1.3. Building and Construction
- 1.4. Healthcare
- 1.5. Other End-user Industries
-
2. Resin
- 2.1. Acrylic
- 2.2. Epoxy
- 2.3. Polyurethane
- 2.4. Silicone
- 2.5. Other Resins
US Sealants Industry Segmentation By Geography
-
1. North America
- 1.1. United States
- 1.2. Canada
- 1.3. Mexico
-
2. South America
- 2.1. Brazil
- 2.2. Argentina
- 2.3. Rest of South America
-
3. Europe
- 3.1. United Kingdom
- 3.2. Germany
- 3.3. France
- 3.4. Italy
- 3.5. Spain
- 3.6. Russia
- 3.7. Benelux
- 3.8. Nordics
- 3.9. Rest of Europe
-
4. Middle East & Africa
- 4.1. Turkey
- 4.2. Israel
- 4.3. GCC
- 4.4. North Africa
- 4.5. South Africa
- 4.6. Rest of Middle East & Africa
-
5. Asia Pacific
- 5.1. China
- 5.2. India
- 5.3. Japan
- 5.4. South Korea
- 5.5. ASEAN
- 5.6. Oceania
- 5.7. Rest of Asia Pacific
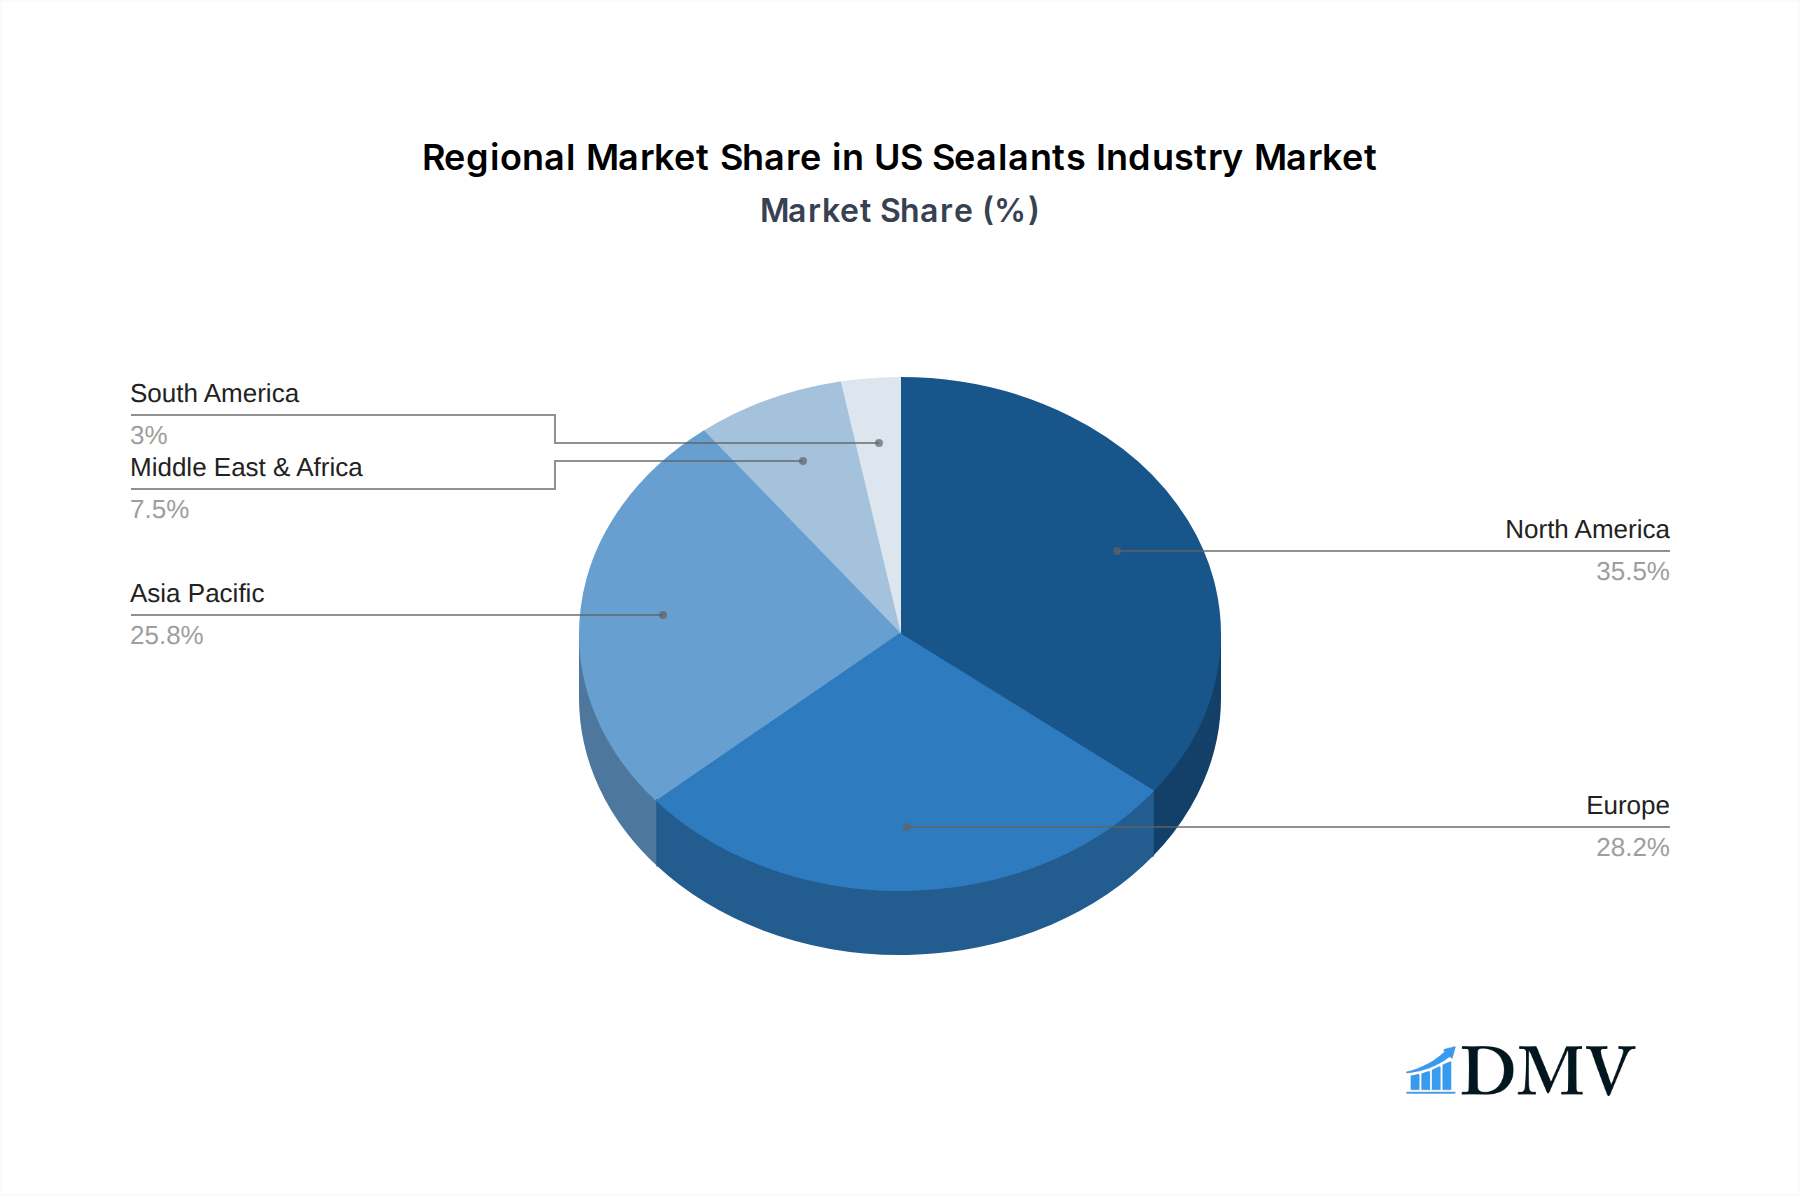
US Sealants Industry Regional Market Share
Geographic Coverage of US Sealants Industry
US Sealants Industry REPORT HIGHLIGHTS
| Aspects | Details |
|---|---|
| Study Period | 2020-2034 |
| Base Year | 2025 |
| Estimated Year | 2026 |
| Forecast Period | 2026-2034 |
| Historical Period | 2020-2025 |
| Growth Rate | CAGR of 6% from 2020-2034 |
| Segmentation |
|
Table of Contents
- 1. Introduction
- 1.1. Research Scope
- 1.2. Market Segmentation
- 1.3. Research Objective
- 1.4. Definitions and Assumptions
- 2. Executive Summary
- 2.1. Market Snapshot
- 3. Market Dynamics
- 3.1. Market Drivers
- 3.2. Market Restrains
- 3.3. Market Trends
- 3.4. Market Opportunities
- 4. Market Factor Analysis
- 4.1. Porters Five Forces
- 4.1.1. Bargaining Power of Suppliers
- 4.1.2. Bargaining Power of Buyers
- 4.1.3. Threat of New Entrants
- 4.1.4. Threat of Substitutes
- 4.1.5. Competitive Rivalry
- 4.2. PESTEL analysis
- 4.3. BCG Analysis
- 4.3.1. Stars (High Growth, High Market Share)
- 4.3.2. Cash Cows (Low Growth, High Market Share)
- 4.3.3. Question Mark (High Growth, Low Market Share)
- 4.3.4. Dogs (Low Growth, Low Market Share)
- 4.4. Ansoff Matrix Analysis
- 4.5. Supply Chain Analysis
- 4.6. Regulatory Landscape
- 4.7. Current Market Potential and Opportunity Assessment (TAM–SAM–SOM Framework)
- 4.8. DMV Analyst Note
- 4.1. Porters Five Forces
- 5. Market Analysis, Insights and Forecast 2021-2033
- 5.1. Market Analysis, Insights and Forecast - by End User Industry
- 5.1.1. Aerospace
- 5.1.2. Automotive
- 5.1.3. Building and Construction
- 5.1.4. Healthcare
- 5.1.5. Other End-user Industries
- 5.2. Market Analysis, Insights and Forecast - by Resin
- 5.2.1. Acrylic
- 5.2.2. Epoxy
- 5.2.3. Polyurethane
- 5.2.4. Silicone
- 5.2.5. Other Resins
- 5.3. Market Analysis, Insights and Forecast - by Region
- 5.3.1. North America
- 5.3.2. South America
- 5.3.3. Europe
- 5.3.4. Middle East & Africa
- 5.3.5. Asia Pacific
- 5.1. Market Analysis, Insights and Forecast - by End User Industry
- 6. Global US Sealants Industry Analysis, Insights and Forecast, 2021-2033
- 6.1. Market Analysis, Insights and Forecast - by End User Industry
- 6.1.1. Aerospace
- 6.1.2. Automotive
- 6.1.3. Building and Construction
- 6.1.4. Healthcare
- 6.1.5. Other End-user Industries
- 6.2. Market Analysis, Insights and Forecast - by Resin
- 6.2.1. Acrylic
- 6.2.2. Epoxy
- 6.2.3. Polyurethane
- 6.2.4. Silicone
- 6.2.5. Other Resins
- 6.1. Market Analysis, Insights and Forecast - by End User Industry
- 7. North America US Sealants Industry Analysis, Insights and Forecast, 2020-2032
- 7.1. Market Analysis, Insights and Forecast - by End User Industry
- 7.1.1. Aerospace
- 7.1.2. Automotive
- 7.1.3. Building and Construction
- 7.1.4. Healthcare
- 7.1.5. Other End-user Industries
- 7.2. Market Analysis, Insights and Forecast - by Resin
- 7.2.1. Acrylic
- 7.2.2. Epoxy
- 7.2.3. Polyurethane
- 7.2.4. Silicone
- 7.2.5. Other Resins
- 7.1. Market Analysis, Insights and Forecast - by End User Industry
- 8. South America US Sealants Industry Analysis, Insights and Forecast, 2020-2032
- 8.1. Market Analysis, Insights and Forecast - by End User Industry
- 8.1.1. Aerospace
- 8.1.2. Automotive
- 8.1.3. Building and Construction
- 8.1.4. Healthcare
- 8.1.5. Other End-user Industries
- 8.2. Market Analysis, Insights and Forecast - by Resin
- 8.2.1. Acrylic
- 8.2.2. Epoxy
- 8.2.3. Polyurethane
- 8.2.4. Silicone
- 8.2.5. Other Resins
- 8.1. Market Analysis, Insights and Forecast - by End User Industry
- 9. Europe US Sealants Industry Analysis, Insights and Forecast, 2020-2032
- 9.1. Market Analysis, Insights and Forecast - by End User Industry
- 9.1.1. Aerospace
- 9.1.2. Automotive
- 9.1.3. Building and Construction
- 9.1.4. Healthcare
- 9.1.5. Other End-user Industries
- 9.2. Market Analysis, Insights and Forecast - by Resin
- 9.2.1. Acrylic
- 9.2.2. Epoxy
- 9.2.3. Polyurethane
- 9.2.4. Silicone
- 9.2.5. Other Resins
- 9.1. Market Analysis, Insights and Forecast - by End User Industry
- 10. Middle East & Africa US Sealants Industry Analysis, Insights and Forecast, 2020-2032
- 10.1. Market Analysis, Insights and Forecast - by End User Industry
- 10.1.1. Aerospace
- 10.1.2. Automotive
- 10.1.3. Building and Construction
- 10.1.4. Healthcare
- 10.1.5. Other End-user Industries
- 10.2. Market Analysis, Insights and Forecast - by Resin
- 10.2.1. Acrylic
- 10.2.2. Epoxy
- 10.2.3. Polyurethane
- 10.2.4. Silicone
- 10.2.5. Other Resins
- 10.1. Market Analysis, Insights and Forecast - by End User Industry
- 11. Asia Pacific US Sealants Industry Analysis, Insights and Forecast, 2020-2032
- 11.1. Market Analysis, Insights and Forecast - by End User Industry
- 11.1.1. Aerospace
- 11.1.2. Automotive
- 11.1.3. Building and Construction
- 11.1.4. Healthcare
- 11.1.5. Other End-user Industries
- 11.2. Market Analysis, Insights and Forecast - by Resin
- 11.2.1. Acrylic
- 11.2.2. Epoxy
- 11.2.3. Polyurethane
- 11.2.4. Silicone
- 11.2.5. Other Resins
- 11.1. Market Analysis, Insights and Forecast - by End User Industry
- 12. Competitive Analysis
- 12.1. Company Profiles
- 12.1.1 Henkel AG & Co KGaA
- 12.1.1.1. Company Overview
- 12.1.1.2. Products
- 12.1.1.3. Company Financials
- 12.1.1.4. SWOT Analysis
- 12.1.2 RPM International Inc
- 12.1.2.1. Company Overview
- 12.1.2.2. Products
- 12.1.2.3. Company Financials
- 12.1.2.4. SWOT Analysis
- 12.1.3 3M
- 12.1.3.1. Company Overview
- 12.1.3.2. Products
- 12.1.3.3. Company Financials
- 12.1.3.4. SWOT Analysis
- 12.1.4 Illinois Tool Works Inc
- 12.1.4.1. Company Overview
- 12.1.4.2. Products
- 12.1.4.3. Company Financials
- 12.1.4.4. SWOT Analysis
- 12.1.5 Arkema Group
- 12.1.5.1. Company Overview
- 12.1.5.2. Products
- 12.1.5.3. Company Financials
- 12.1.5.4. SWOT Analysis
- 12.1.6 Dow
- 12.1.6.1. Company Overview
- 12.1.6.2. Products
- 12.1.6.3. Company Financials
- 12.1.6.4. SWOT Analysis
- 12.1.7 H B Fuller Company
- 12.1.7.1. Company Overview
- 12.1.7.2. Products
- 12.1.7.3. Company Financials
- 12.1.7.4. SWOT Analysis
- 12.1.8 Sika A
- 12.1.8.1. Company Overview
- 12.1.8.2. Products
- 12.1.8.3. Company Financials
- 12.1.8.4. SWOT Analysis
- 12.1.9 MAPEI S p A
- 12.1.9.1. Company Overview
- 12.1.9.2. Products
- 12.1.9.3. Company Financials
- 12.1.9.4. SWOT Analysis
- 12.1.10 Pecora Corporation
- 12.1.10.1. Company Overview
- 12.1.10.2. Products
- 12.1.10.3. Company Financials
- 12.1.10.4. SWOT Analysis
- 12.1.1 Henkel AG & Co KGaA
- 12.2. Market Entropy
- 12.2.1 Company's Key Areas Served
- 12.2.2 Recent Developments
- 12.3. Company Market Share Analysis 2025
- 12.3.1 Top 5 Companies Market Share Analysis
- 12.3.2 Top 3 Companies Market Share Analysis
- 12.4. List of Potential Customers
- 13. Research Methodology
List of Figures
- Figure 1: Global US Sealants Industry Revenue Breakdown (billion, %) by Region 2025 & 2033
- Figure 2: North America US Sealants Industry Revenue (billion), by End User Industry 2025 & 2033
- Figure 3: North America US Sealants Industry Revenue Share (%), by End User Industry 2025 & 2033
- Figure 4: North America US Sealants Industry Revenue (billion), by Resin 2025 & 2033
- Figure 5: North America US Sealants Industry Revenue Share (%), by Resin 2025 & 2033
- Figure 6: North America US Sealants Industry Revenue (billion), by Country 2025 & 2033
- Figure 7: North America US Sealants Industry Revenue Share (%), by Country 2025 & 2033
- Figure 8: South America US Sealants Industry Revenue (billion), by End User Industry 2025 & 2033
- Figure 9: South America US Sealants Industry Revenue Share (%), by End User Industry 2025 & 2033
- Figure 10: South America US Sealants Industry Revenue (billion), by Resin 2025 & 2033
- Figure 11: South America US Sealants Industry Revenue Share (%), by Resin 2025 & 2033
- Figure 12: South America US Sealants Industry Revenue (billion), by Country 2025 & 2033
- Figure 13: South America US Sealants Industry Revenue Share (%), by Country 2025 & 2033
- Figure 14: Europe US Sealants Industry Revenue (billion), by End User Industry 2025 & 2033
- Figure 15: Europe US Sealants Industry Revenue Share (%), by End User Industry 2025 & 2033
- Figure 16: Europe US Sealants Industry Revenue (billion), by Resin 2025 & 2033
- Figure 17: Europe US Sealants Industry Revenue Share (%), by Resin 2025 & 2033
- Figure 18: Europe US Sealants Industry Revenue (billion), by Country 2025 & 2033
- Figure 19: Europe US Sealants Industry Revenue Share (%), by Country 2025 & 2033
- Figure 20: Middle East & Africa US Sealants Industry Revenue (billion), by End User Industry 2025 & 2033
- Figure 21: Middle East & Africa US Sealants Industry Revenue Share (%), by End User Industry 2025 & 2033
- Figure 22: Middle East & Africa US Sealants Industry Revenue (billion), by Resin 2025 & 2033
- Figure 23: Middle East & Africa US Sealants Industry Revenue Share (%), by Resin 2025 & 2033
- Figure 24: Middle East & Africa US Sealants Industry Revenue (billion), by Country 2025 & 2033
- Figure 25: Middle East & Africa US Sealants Industry Revenue Share (%), by Country 2025 & 2033
- Figure 26: Asia Pacific US Sealants Industry Revenue (billion), by End User Industry 2025 & 2033
- Figure 27: Asia Pacific US Sealants Industry Revenue Share (%), by End User Industry 2025 & 2033
- Figure 28: Asia Pacific US Sealants Industry Revenue (billion), by Resin 2025 & 2033
- Figure 29: Asia Pacific US Sealants Industry Revenue Share (%), by Resin 2025 & 2033
- Figure 30: Asia Pacific US Sealants Industry Revenue (billion), by Country 2025 & 2033
- Figure 31: Asia Pacific US Sealants Industry Revenue Share (%), by Country 2025 & 2033
List of Tables
- Table 1: Global US Sealants Industry Revenue billion Forecast, by End User Industry 2020 & 2033
- Table 2: Global US Sealants Industry Revenue billion Forecast, by Resin 2020 & 2033
- Table 3: Global US Sealants Industry Revenue billion Forecast, by Region 2020 & 2033
- Table 4: Global US Sealants Industry Revenue billion Forecast, by End User Industry 2020 & 2033
- Table 5: Global US Sealants Industry Revenue billion Forecast, by Resin 2020 & 2033
- Table 6: Global US Sealants Industry Revenue billion Forecast, by Country 2020 & 2033
- Table 7: United States US Sealants Industry Revenue (billion) Forecast, by Application 2020 & 2033
- Table 8: Canada US Sealants Industry Revenue (billion) Forecast, by Application 2020 & 2033
- Table 9: Mexico US Sealants Industry Revenue (billion) Forecast, by Application 2020 & 2033
- Table 10: Global US Sealants Industry Revenue billion Forecast, by End User Industry 2020 & 2033
- Table 11: Global US Sealants Industry Revenue billion Forecast, by Resin 2020 & 2033
- Table 12: Global US Sealants Industry Revenue billion Forecast, by Country 2020 & 2033
- Table 13: Brazil US Sealants Industry Revenue (billion) Forecast, by Application 2020 & 2033
- Table 14: Argentina US Sealants Industry Revenue (billion) Forecast, by Application 2020 & 2033
- Table 15: Rest of South America US Sealants Industry Revenue (billion) Forecast, by Application 2020 & 2033
- Table 16: Global US Sealants Industry Revenue billion Forecast, by End User Industry 2020 & 2033
- Table 17: Global US Sealants Industry Revenue billion Forecast, by Resin 2020 & 2033
- Table 18: Global US Sealants Industry Revenue billion Forecast, by Country 2020 & 2033
- Table 19: United Kingdom US Sealants Industry Revenue (billion) Forecast, by Application 2020 & 2033
- Table 20: Germany US Sealants Industry Revenue (billion) Forecast, by Application 2020 & 2033
- Table 21: France US Sealants Industry Revenue (billion) Forecast, by Application 2020 & 2033
- Table 22: Italy US Sealants Industry Revenue (billion) Forecast, by Application 2020 & 2033
- Table 23: Spain US Sealants Industry Revenue (billion) Forecast, by Application 2020 & 2033
- Table 24: Russia US Sealants Industry Revenue (billion) Forecast, by Application 2020 & 2033
- Table 25: Benelux US Sealants Industry Revenue (billion) Forecast, by Application 2020 & 2033
- Table 26: Nordics US Sealants Industry Revenue (billion) Forecast, by Application 2020 & 2033
- Table 27: Rest of Europe US Sealants Industry Revenue (billion) Forecast, by Application 2020 & 2033
- Table 28: Global US Sealants Industry Revenue billion Forecast, by End User Industry 2020 & 2033
- Table 29: Global US Sealants Industry Revenue billion Forecast, by Resin 2020 & 2033
- Table 30: Global US Sealants Industry Revenue billion Forecast, by Country 2020 & 2033
- Table 31: Turkey US Sealants Industry Revenue (billion) Forecast, by Application 2020 & 2033
- Table 32: Israel US Sealants Industry Revenue (billion) Forecast, by Application 2020 & 2033
- Table 33: GCC US Sealants Industry Revenue (billion) Forecast, by Application 2020 & 2033
- Table 34: North Africa US Sealants Industry Revenue (billion) Forecast, by Application 2020 & 2033
- Table 35: South Africa US Sealants Industry Revenue (billion) Forecast, by Application 2020 & 2033
- Table 36: Rest of Middle East & Africa US Sealants Industry Revenue (billion) Forecast, by Application 2020 & 2033
- Table 37: Global US Sealants Industry Revenue billion Forecast, by End User Industry 2020 & 2033
- Table 38: Global US Sealants Industry Revenue billion Forecast, by Resin 2020 & 2033
- Table 39: Global US Sealants Industry Revenue billion Forecast, by Country 2020 & 2033
- Table 40: China US Sealants Industry Revenue (billion) Forecast, by Application 2020 & 2033
- Table 41: India US Sealants Industry Revenue (billion) Forecast, by Application 2020 & 2033
- Table 42: Japan US Sealants Industry Revenue (billion) Forecast, by Application 2020 & 2033
- Table 43: South Korea US Sealants Industry Revenue (billion) Forecast, by Application 2020 & 2033
- Table 44: ASEAN US Sealants Industry Revenue (billion) Forecast, by Application 2020 & 2033
- Table 45: Oceania US Sealants Industry Revenue (billion) Forecast, by Application 2020 & 2033
- Table 46: Rest of Asia Pacific US Sealants Industry Revenue (billion) Forecast, by Application 2020 & 2033
Frequently Asked Questions
1. What is the projected Compound Annual Growth Rate (CAGR) of the US Sealants Industry?
The projected CAGR is approximately 6%.
2. Which companies are prominent players in the US Sealants Industry?
Key companies in the market include Henkel AG & Co KGaA, RPM International Inc, 3M, Illinois Tool Works Inc, Arkema Group, Dow, H B Fuller Company, Sika A, MAPEI S p A, Pecora Corporation.
3. What are the main segments of the US Sealants Industry?
The market segments include End User Industry, Resin.
4. Can you provide details about the market size?
The market size is estimated to be USD 77.08 billion as of 2022.
5. What are some drivers contributing to market growth?
Rising Demand from the Construction Industry in Saudi Arabia; Other Drivers.
6. What are the notable trends driving market growth?
OTHER KEY INDUSTRY TRENDS COVERED IN THE REPORT.
7. Are there any restraints impacting market growth?
; Impact of COVID-19 Pandemic on Global Economy.
8. Can you provide examples of recent developments in the market?
July 2021: RPM International Inc. procured a 178,000-square-foot chemical manufacturing facility in Texas to act as a manufacturing campus, owned and operated by RPM’s Tremco Construction Products Group, to meet customer demand and strengthen its supply chain.April 2021: Sika AG signed an agreement to acquire The Yokohama Rubber Co. Ltd's adhesives division, Hamatite, based in Japan. Hamatite offers polyurethanes, hot melts, and modified silicones technology adhesives and sealants for the automotive and construction industries.January 2020: H.B. Fuller Company introduced a new range of Gorilla professional-grade adhesives and sealants for MRO industrial applications.
9. What pricing options are available for accessing the report?
Pricing options include single-user, multi-user, and enterprise licenses priced at USD 3800, USD 4500, and USD 5800 respectively.
10. Is the market size provided in terms of value or volume?
The market size is provided in terms of value, measured in billion.
11. Are there any specific market keywords associated with the report?
Yes, the market keyword associated with the report is "US Sealants Industry," which aids in identifying and referencing the specific market segment covered.
12. How do I determine which pricing option suits my needs best?
The pricing options vary based on user requirements and access needs. Individual users may opt for single-user licenses, while businesses requiring broader access may choose multi-user or enterprise licenses for cost-effective access to the report.
13. Are there any additional resources or data provided in the US Sealants Industry report?
While the report offers comprehensive insights, it's advisable to review the specific contents or supplementary materials provided to ascertain if additional resources or data are available.
14. How can I stay updated on further developments or reports in the US Sealants Industry?
To stay informed about further developments, trends, and reports in the US Sealants Industry, consider subscribing to industry newsletters, following relevant companies and organizations, or regularly checking reputable industry news sources and publications.
Methodology
Step 1 - Identification of Relevant Samples Size from Population Database


Step 2 - Approaches for Defining Global Market Size (Value, Volume* & Price*)

Note*: In applicable scenarios
Step 3 - Data Sources
Primary Research
- Web Analytics
- Survey Reports
- Research Institute
- Latest Research Reports
- Opinion Leaders
Secondary Research
- Annual Reports
- White Paper
- Latest Press Release
- Industry Association
- Paid Database
- Investor Presentations

Step 4 - Data Triangulation
Involves using different sources of information in order to increase the validity of a study
These sources are likely to be stakeholders in a program - participants, other researchers, program staff, other community members, and so on.
Then we put all data in single framework & apply various statistical tools to find out the dynamic on the market.
During the analysis stage, feedback from the stakeholder groups would be compared to determine areas of agreement as well as areas of divergence