

Key Insights
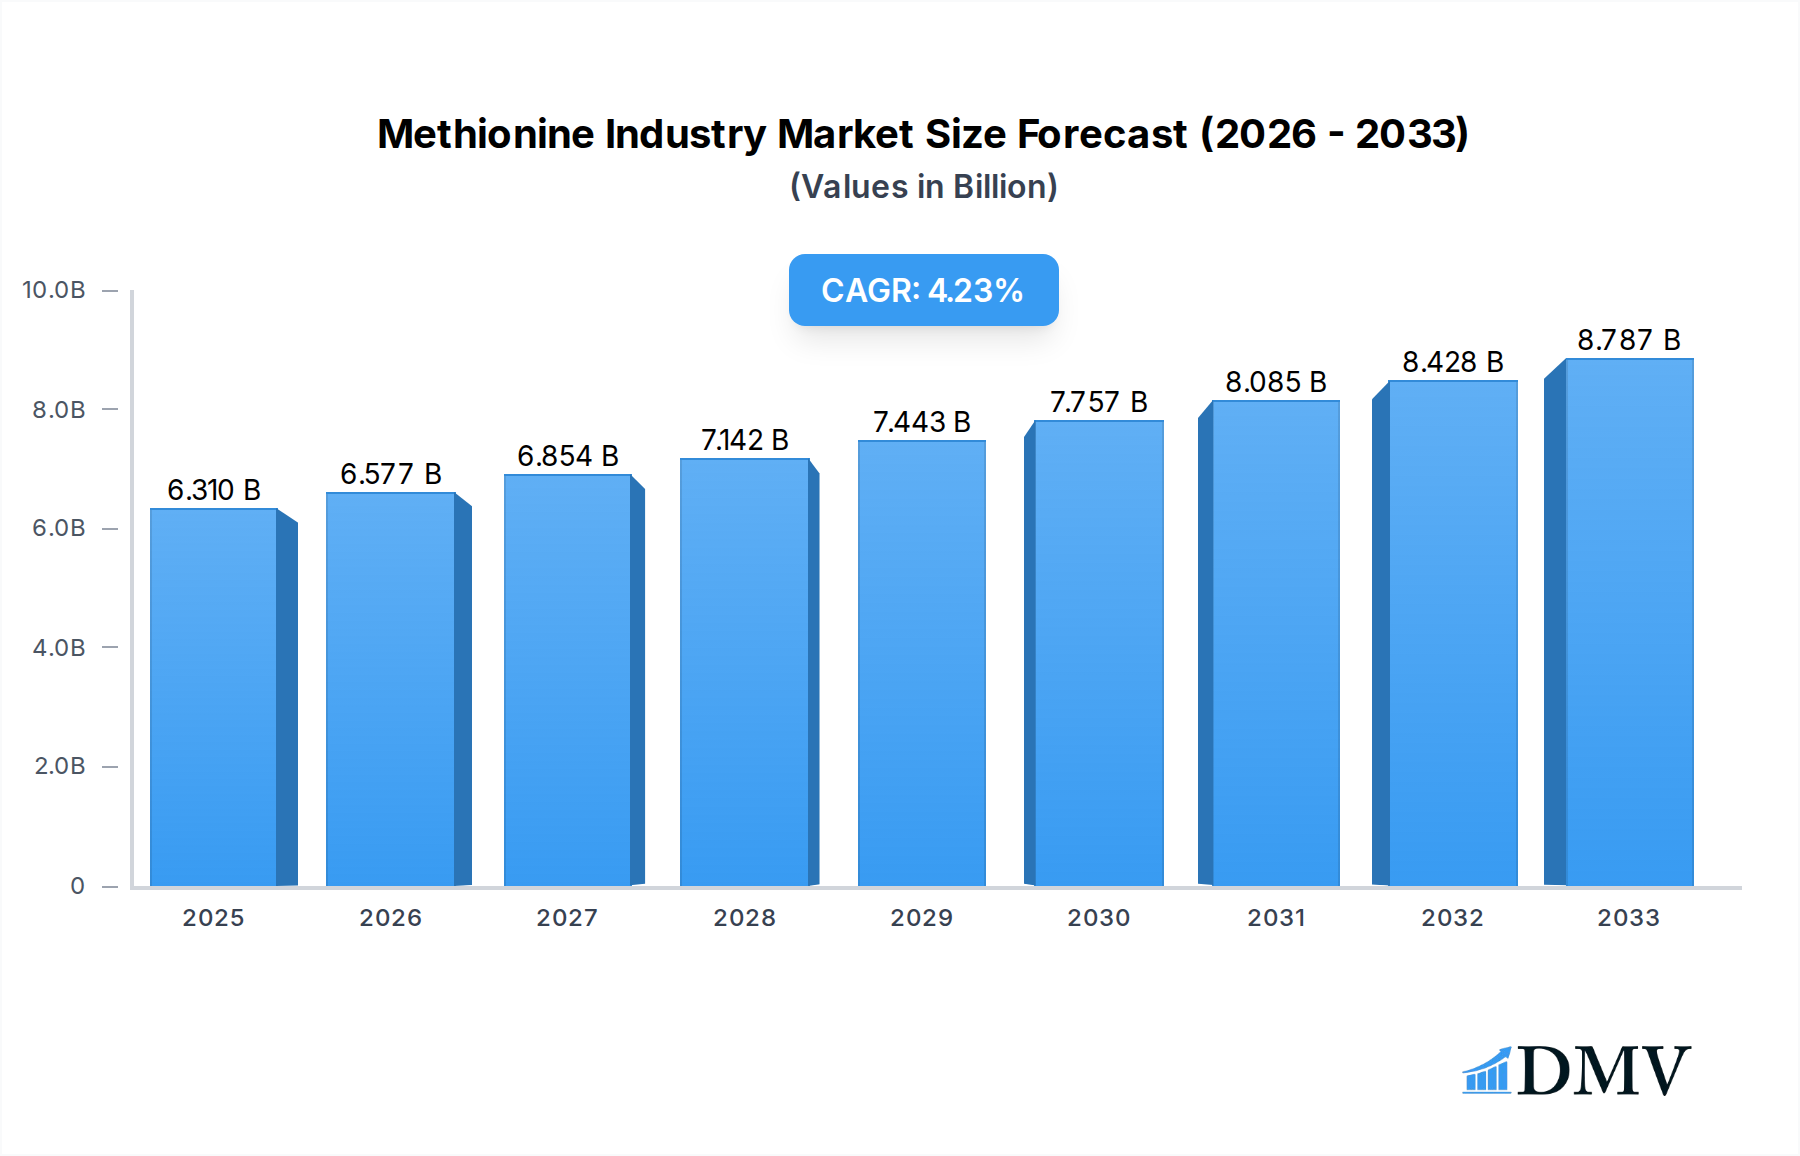
The global Methionine market is poised for robust expansion, projected to reach a significant $6310 million by 2025. This growth trajectory is underpinned by a compelling Compound Annual Growth Rate (CAGR) of 4.3%, indicating sustained demand and increasing market value over the forecast period. The primary drivers fueling this expansion are the escalating global demand for animal protein, particularly poultry and swine, which necessitates the use of methionine as a crucial supplement in animal feed for optimal growth and health. Furthermore, the expanding pharmaceutical sector's utilization of methionine as an ingredient in various formulations and its growing application in specialized food and beverage products are contributing factors. Emerging economies, especially in the Asia Pacific region, are witnessing a surge in demand due to rising disposable incomes and a growing middle class with increased protein consumption.

Methionine Industry Market Size (In Billion)
The methionine market is characterized by diverse applications across key end-user industries. The Food and Beverage sector benefits from methionine's role as a nutritional enhancer and flavor precursor. The Pharmaceutical industry leverages its therapeutic properties and as a building block in drug synthesis. The Animal Feed segment remains the dominant force, driven by the imperative for efficient livestock production. While the market demonstrates strong growth, it faces certain restraints. Fluctuations in raw material prices, particularly those related to crude oil derivatives, can impact production costs and pricing strategies. Stringent regulatory frameworks in some regions concerning animal feed additives and processing can also present challenges. Nevertheless, ongoing research and development into innovative production methods and new applications, coupled with strategic expansions by leading companies like Sumitomo Chemical Co. Ltd., Evonik Industries AG, and CJ CheilJedang Corp., are expected to propel the market forward, creating significant opportunities for stakeholders.
Methionine Industry Company Market Share
Methionine Industry Market Composition & Trends
The global methionine market is characterized by a dynamic competitive landscape, with key players vying for dominance through strategic expansions and technological advancements. Market concentration is significant, with a few leading companies holding substantial market share, estimated at over 80% combined. Innovation catalysts include the growing demand for animal feed additives to enhance livestock health and productivity, coupled with increasing applications in the pharmaceutical and food and beverage sectors. The methionine market size is projected to reach $XXX million by 2033, exhibiting a compound annual growth rate (CAGR) of approximately X.X% during the forecast period of 2025-2033. Regulatory landscapes primarily focus on product safety and efficacy, influencing manufacturing standards and import/export policies. Substitute products, while present, often lack the specific amino acid profile and cost-effectiveness of methionine, particularly in animal nutrition. End-user profiles reveal a strong reliance on the animal feed industry, which accounts for over 70% of global consumption. The food and beverage and pharmaceutical sectors represent growing, albeit smaller, segments. Merger and acquisition (M&A) activities are sporadic but impactful, aimed at consolidating market position and expanding geographical reach. For instance, a hypothetical M&A deal in the past year could have been valued at over $XXX million, signifying consolidation efforts.
- Market Concentration: High, dominated by a few major methionine producers.
- Innovation Catalysts: Animal feed demand, pharmaceutical applications, sustainable production.
- Regulatory Landscape: Focus on food safety, animal welfare, and environmental compliance.
- Substitute Products: Limited direct substitutes for essential amino acid functionality.
- End-User Dominance: Animal Feed (over 70%), followed by Food & Beverage and Pharmaceuticals.
- M&A Activity: Strategic acquisitions to enhance capacity and market share.
Methionine Industry Industry Evolution
The methionine industry has witnessed a remarkable evolutionary trajectory, driven by consistent demand and strategic investments. From its historical roots as a vital nutritional supplement, the industry has expanded significantly in scale and scope. The global methionine market value in the historical period (2019-2024) demonstrated steady growth, with an estimated market size of $XXX million in 2019, escalating to approximately $XXX million by the end of 2024. This growth has been fueled by a confluence of factors, including an expanding global population, rising disposable incomes in developing economies leading to increased meat consumption, and a growing awareness of the importance of balanced nutrition in both animal husbandry and human health. Technological advancements have played a pivotal role in shaping the industry. Innovations in production processes, such as improved fermentation techniques and more efficient synthesis routes, have led to increased yields, reduced production costs, and enhanced product purity. This has enabled methionine suppliers to cater to a wider range of applications and customer needs. The shift towards more sustainable and environmentally friendly manufacturing practices is also becoming a significant trend, pushing companies to invest in greener technologies and reduce their carbon footprint.
Furthermore, evolving consumer demands have indirectly influenced the methionine market. The increasing preference for ethically sourced and sustainably produced animal protein has put pressure on the animal feed industry to optimize feed formulations for better animal health and reduced environmental impact, thus boosting the demand for essential amino acids like methionine. In the pharmaceutical sector, the growing interest in dietary supplements and nutraceuticals has opened new avenues for methionine utilization. The base year of 2025 is anticipated to see the market reach an estimated $XXX million, setting the stage for robust expansion during the forecast period. The DL-methionine market and L-methionine market segments have both contributed to this growth, with specific applications dictating the preferred form. The industry's evolution is not merely about increased volume but also about increased sophistication, with a greater emphasis on product quality, specialized formulations, and a deeper understanding of methionine's biological roles across different applications. The overall trajectory indicates a mature yet continuously innovating industry, poised for sustained growth driven by fundamental global needs.
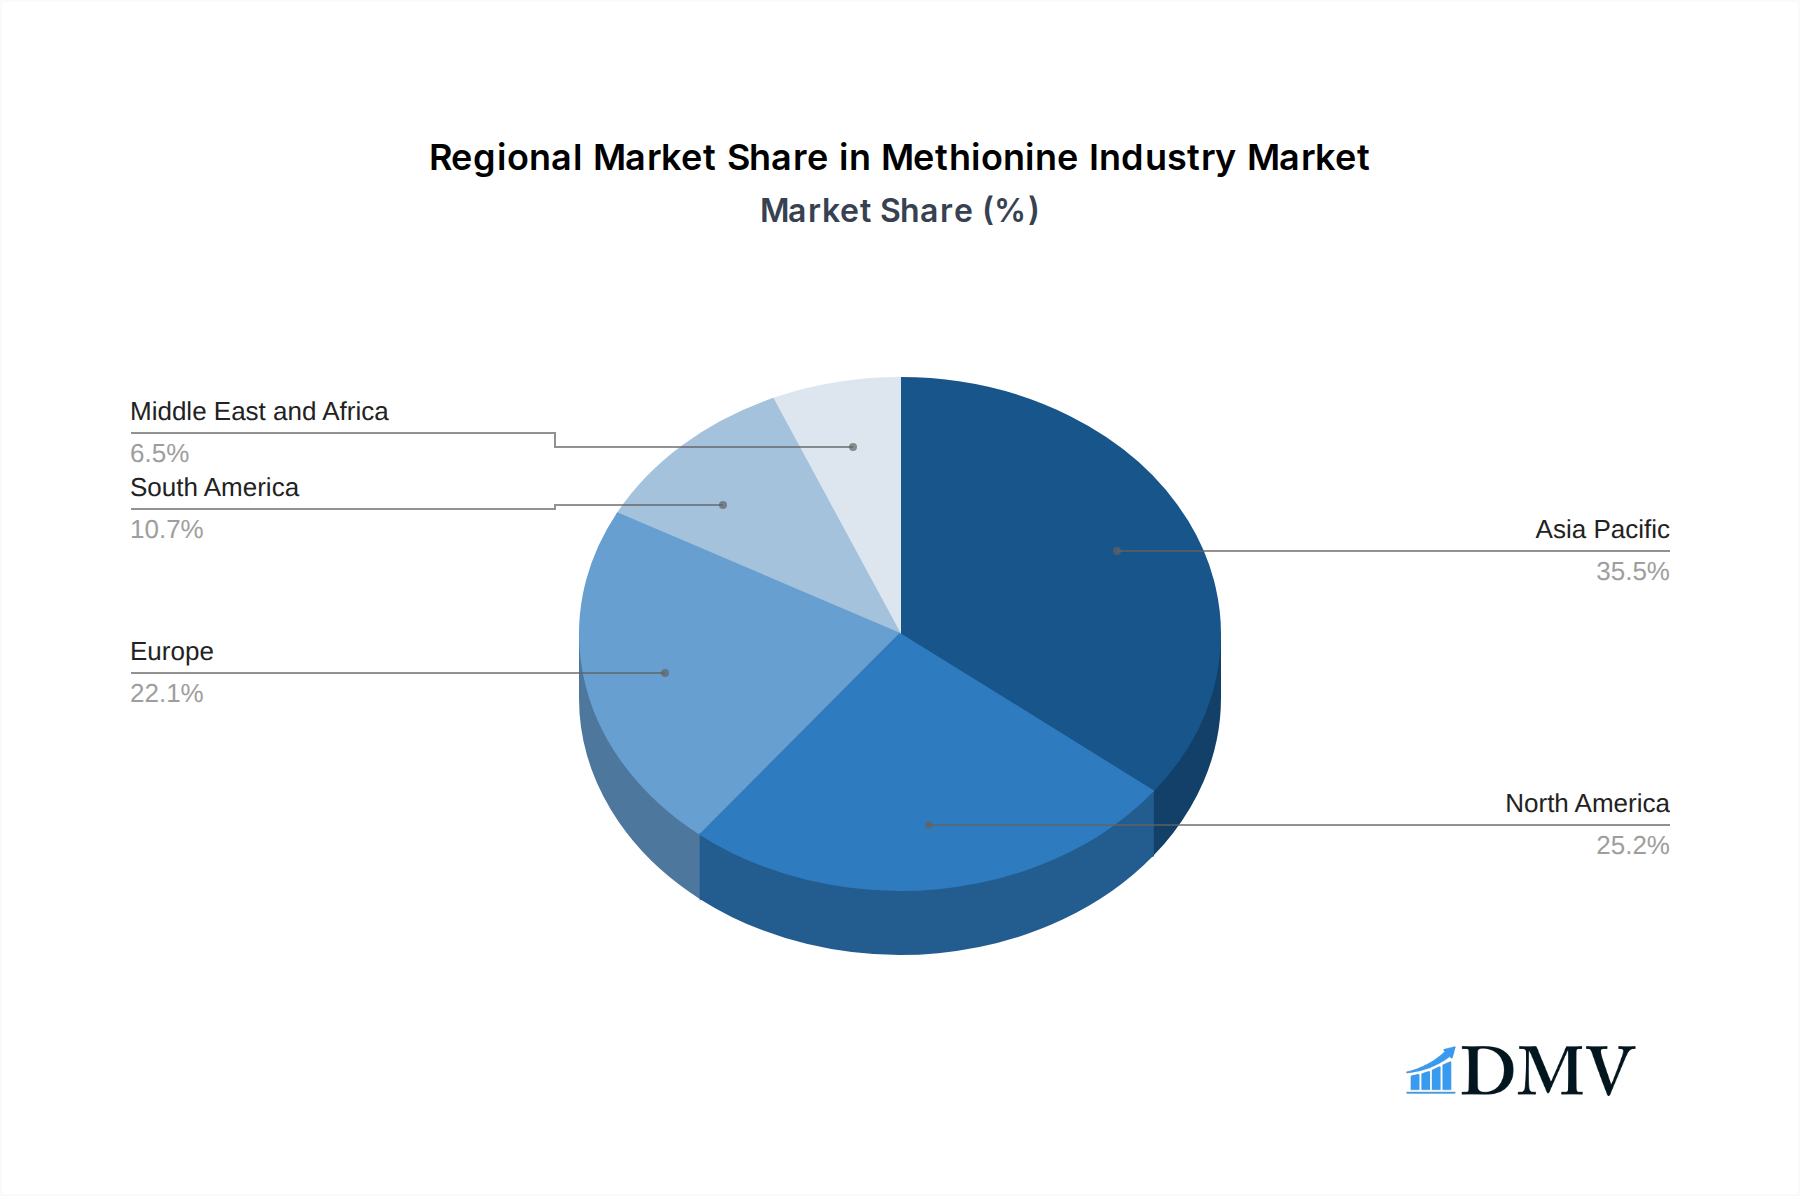
Leading Regions, Countries, or Segments in Methionine Industry
The methionine market is experiencing a significant regional dominance, with Asia Pacific emerging as a powerhouse in both production and consumption. This dominance is underpinned by several critical factors, including the region's vast and rapidly growing animal feed industry, driven by increasing meat consumption and aquaculture. Countries like China are not only major consumers but also significant producers of methionine, benefiting from government support, readily available raw materials, and a large manufacturing base. North America and Europe remain crucial markets, characterized by sophisticated animal husbandry practices, stringent quality standards, and a growing demand for premium animal nutrition products. Investments in research and development are substantial in these regions, focusing on advanced formulations and sustainable production methods.
Within the methionine segments, the Animal Feed end-user industry unequivocally leads the market, accounting for an overwhelming majority of global demand. The imperative to optimize feed conversion ratios, enhance animal growth rates, improve disease resistance, and reduce nitrogen excretion makes methionine an indispensable additive in poultry, swine, and aquaculture diets. The Powder form of methionine holds a larger market share due to its ease of handling, storage, and incorporation into dry feed formulations. However, the Liquid methionine segment is experiencing significant growth, driven by its efficient absorption, reduced dust formation, and potential for automated delivery systems, especially in large-scale industrial operations.
Dominant End-User Industry: Animal Feed.
- Key Drivers: Increasing global demand for animal protein, focus on feed efficiency and animal health, expansion of poultry and swine industries, growth in aquaculture.
- Market Share: Estimated to be over 70% of the global methionine market.
- Regional Impact: Asia Pacific, North America, and Europe are key consumption hubs.
Dominant Product Type: Powder Methionine.
- Key Drivers: Cost-effectiveness, ease of handling and storage, established integration into existing feed manufacturing processes.
- Market Share: Holds a larger share compared to liquid methionine.
- Adoption Metrics: Widely adopted across diverse feed production scales.
Emerging Segment: Liquid Methionine.
- Key Drivers: Improved bioavailability, reduced dust, potential for automation in large-scale operations, increasing adoption in specialized feed applications.
- Growth Trajectory: Experiencing a faster growth rate than powder methionine.
- Investment Trends: Significant investments in liquid methionine production facilities, as evidenced by industry developments.
Regional Dominance: Asia Pacific.
- Key Drivers: Rapidly expanding animal agriculture, substantial population growth, increasing disposable incomes, strong government support for food security, significant manufacturing capabilities.
- Market Share: Leading region in both production and consumption of methionine.
- Investment Trends: Growing investments in new production capacities and expansions within the region.
Methionine Industry Product Innovations
Product innovations in the methionine industry are increasingly focused on enhancing bioavailability, optimizing delivery systems, and developing specialized formulations. Companies are investing in advanced chemical synthesis and biotechnological processes to produce higher purity DL-methionine and L-methionine. Innovations include microencapsulation techniques to control the release of methionine in the digestive tract, improving nutrient absorption and reducing excretion. Furthermore, advancements in liquid methionine formulations are offering enhanced stability and ease of integration into automated feeding systems for livestock. The unique selling proposition of these innovations lies in their ability to translate into improved animal performance, reduced environmental impact, and greater operational efficiency for end-users.
Propelling Factors for Methionine Industry Growth
Several key factors are propelling the growth of the methionine market. The increasing global demand for animal protein, driven by population growth and rising disposable incomes, directly translates to a higher demand for animal feed, a primary application for methionine. Technological advancements in animal husbandry, focusing on maximizing feed efficiency and improving animal health, necessitate the use of essential amino acids like methionine. Furthermore, the growing awareness of the nutritional benefits of methionine in human health, leading to its use in pharmaceuticals and dietary supplements, contributes to market expansion. Regulatory support for the animal feed industry and advancements in sustainable production methods also play a crucial role in fostering market growth.
- Rising Global Meat Consumption: Increased demand for animal feed.
- Focus on Animal Health and Productivity: Essential amino acid for optimal livestock growth and well-being.
- Technological Advancements in Animal Nutrition: Improved feed formulations and delivery systems.
- Growing Pharmaceutical and Nutraceutical Applications: Increasing use in human health supplements.
- Supportive Regulatory Frameworks: Encouraging efficient and safe animal agriculture.
Obstacles in the Methionine Industry Market
Despite robust growth, the methionine industry faces certain obstacles. Volatility in the prices of raw materials, such as natural gas and petroleum derivatives, can impact production costs and profitability for methionine manufacturers. Stringent environmental regulations concerning production processes and waste disposal can increase operational expenses and necessitate significant capital investment in compliance technologies. Supply chain disruptions, as witnessed by global events, can affect the availability of raw materials and the timely delivery of finished products. Intense competition among major players can also exert downward pressure on pricing, impacting profit margins, especially in established markets.
- Raw Material Price Volatility: Fluctuations in petrochemical prices affect production costs.
- Stringent Environmental Regulations: Increased operational costs and compliance requirements.
- Supply Chain Vulnerabilities: Disruptions in logistics and raw material availability.
- Intense Market Competition: Price pressures and margin erosion.
Future Opportunities in Methionine Industry
The future of the methionine market is rife with opportunities. The growing demand for plant-based protein alternatives in animal feed formulation presents an opportunity for methionine to play a complementary role in ensuring balanced nutrition. Expansion into emerging economies in Africa and Latin America, with their burgeoning animal agriculture sectors, offers significant untapped potential. Advancements in biotechnology and synthetic biology could lead to the development of novel, more sustainable, and cost-effective production methods for methionine. Furthermore, the increasing research into the health benefits of methionine for humans, beyond its role as an essential amino acid, could unlock new applications in the pharmaceutical and functional food sectors.
- Emerging Market Penetration: Growth potential in developing economies.
- Biotechnology Innovations: Development of sustainable and cost-effective production methods.
- New Applications in Human Health: Expanding roles in pharmaceuticals and functional foods.
- Role in Alternative Feedstuffs: Complementary nutrient in plant-based diets.
Major Players in the Methionine Industry Ecosystem
- Sumitomo Chemical Co Ltd
- Evonik Industries AG
- NOVUS INTERNATIONAL
- Chongqing Unisplendour Chemical Co Ltd
- Adisseo
- Volzhsky Orgsynthese JSC
- Zhejiang NHU Co Ltd
- CJ CheilJedang Corp
Key Developments in Methionine Industry Industry
- September 2022: Adisseo started liquid methionine production through its 180,000-ton new plant in Nanjing, China. The company has doubled its methionine capacity to 350,000 tons through its operational new plant, consolidating its leading position in the world. This expansion significantly boosts global methionine supply and reinforces Adisseo's market leadership.
- March 2022: Evonik announced its expansion project at its mobile area manufacturing facility in Theodore, Alabama, to bolster its animal nutrition business line. The project involves producing methyl mercaptan to manufacture its MetAmino (DL-methionine) product. The company has invested USD 176.5 million in the expansion project, signaling a strategic commitment to increasing DL-methionine production capacity.
Strategic Methionine Industry Market Forecast
The methionine industry is poised for sustained growth, driven by its indispensable role in animal nutrition and expanding applications in pharmaceuticals. The forecast period of 2025–2033 anticipates a CAGR of approximately X.X%, with the market size projected to reach $XXX million by 2033. Key growth catalysts include the escalating global demand for protein, advancements in feed efficiency technologies, and increasing investments in sustainable production. Strategic opportunities lie in tapping into emerging markets, developing innovative bio-based production methods, and exploring new health-related applications. The industry's resilience and adaptability, coupled with ongoing innovation, will ensure its continued importance in global food security and human well-being.
Methionine Industry Segmentation
-
1. Type
- 1.1. Liquid
- 1.2. Powder
-
2. End-user Industry
- 2.1. Food and Beverage
- 2.2. Pharmaceutical
- 2.3. Animal Feed
- 2.4. Other End-user Industries
Methionine Industry Segmentation By Geography
-
1. Asia Pacific
- 1.1. China
- 1.2. India
- 1.3. Japan
- 1.4. South Korea
- 1.5. Rest of Asia Pacific
-
2. North America
- 2.1. United States
- 2.2. Canada
- 2.3. Mexico
-
3. Europe
- 3.1. Germany
- 3.2. United Kingdom
- 3.3. Italy
- 3.4. France
- 3.5. Rest of Europe
-
4. South America
- 4.1. Brazil
- 4.2. Argentina
- 4.3. Rest of South America
-
5. Middle East and Africa
- 5.1. Saudi Arabia
- 5.2. South Africa
- 5.3. Rest of Middle East and Africa
Methionine Industry Regional Market Share
Geographic Coverage of Methionine Industry
Methionine Industry REPORT HIGHLIGHTS
| Aspects | Details |
|---|---|
| Study Period | 2020-2034 |
| Base Year | 2025 |
| Estimated Year | 2026 |
| Forecast Period | 2026-2034 |
| Historical Period | 2020-2025 |
| Growth Rate | CAGR of 4.3% from 2020-2034 |
| Segmentation |
|
Table of Contents
- 1. Introduction
- 1.1. Research Scope
- 1.2. Market Segmentation
- 1.3. Research Objective
- 1.4. Definitions and Assumptions
- 2. Executive Summary
- 2.1. Market Snapshot
- 3. Market Dynamics
- 3.1. Market Drivers
- 3.2. Market Restrains
- 3.3. Market Trends
- 3.4. Market Opportunities
- 4. Market Factor Analysis
- 4.1. Porters Five Forces
- 4.1.1. Bargaining Power of Suppliers
- 4.1.2. Bargaining Power of Buyers
- 4.1.3. Threat of New Entrants
- 4.1.4. Threat of Substitutes
- 4.1.5. Competitive Rivalry
- 4.2. PESTEL analysis
- 4.3. BCG Analysis
- 4.3.1. Stars (High Growth, High Market Share)
- 4.3.2. Cash Cows (Low Growth, High Market Share)
- 4.3.3. Question Mark (High Growth, Low Market Share)
- 4.3.4. Dogs (Low Growth, Low Market Share)
- 4.4. Ansoff Matrix Analysis
- 4.5. Supply Chain Analysis
- 4.6. Regulatory Landscape
- 4.7. Current Market Potential and Opportunity Assessment (TAM–SAM–SOM Framework)
- 4.8. DMV Analyst Note
- 4.1. Porters Five Forces
- 5. Market Analysis, Insights and Forecast 2021-2033
- 5.1. Market Analysis, Insights and Forecast - by Type
- 5.1.1. Liquid
- 5.1.2. Powder
- 5.2. Market Analysis, Insights and Forecast - by End-user Industry
- 5.2.1. Food and Beverage
- 5.2.2. Pharmaceutical
- 5.2.3. Animal Feed
- 5.2.4. Other End-user Industries
- 5.3. Market Analysis, Insights and Forecast - by Region
- 5.3.1. Asia Pacific
- 5.3.2. North America
- 5.3.3. Europe
- 5.3.4. South America
- 5.3.5. Middle East and Africa
- 5.1. Market Analysis, Insights and Forecast - by Type
- 6. Global Methionine Industry Analysis, Insights and Forecast, 2021-2033
- 6.1. Market Analysis, Insights and Forecast - by Type
- 6.1.1. Liquid
- 6.1.2. Powder
- 6.2. Market Analysis, Insights and Forecast - by End-user Industry
- 6.2.1. Food and Beverage
- 6.2.2. Pharmaceutical
- 6.2.3. Animal Feed
- 6.2.4. Other End-user Industries
- 6.1. Market Analysis, Insights and Forecast - by Type
- 7. Asia Pacific Methionine Industry Analysis, Insights and Forecast, 2020-2032
- 7.1. Market Analysis, Insights and Forecast - by Type
- 7.1.1. Liquid
- 7.1.2. Powder
- 7.2. Market Analysis, Insights and Forecast - by End-user Industry
- 7.2.1. Food and Beverage
- 7.2.2. Pharmaceutical
- 7.2.3. Animal Feed
- 7.2.4. Other End-user Industries
- 7.1. Market Analysis, Insights and Forecast - by Type
- 8. North America Methionine Industry Analysis, Insights and Forecast, 2020-2032
- 8.1. Market Analysis, Insights and Forecast - by Type
- 8.1.1. Liquid
- 8.1.2. Powder
- 8.2. Market Analysis, Insights and Forecast - by End-user Industry
- 8.2.1. Food and Beverage
- 8.2.2. Pharmaceutical
- 8.2.3. Animal Feed
- 8.2.4. Other End-user Industries
- 8.1. Market Analysis, Insights and Forecast - by Type
- 9. Europe Methionine Industry Analysis, Insights and Forecast, 2020-2032
- 9.1. Market Analysis, Insights and Forecast - by Type
- 9.1.1. Liquid
- 9.1.2. Powder
- 9.2. Market Analysis, Insights and Forecast - by End-user Industry
- 9.2.1. Food and Beverage
- 9.2.2. Pharmaceutical
- 9.2.3. Animal Feed
- 9.2.4. Other End-user Industries
- 9.1. Market Analysis, Insights and Forecast - by Type
- 10. South America Methionine Industry Analysis, Insights and Forecast, 2020-2032
- 10.1. Market Analysis, Insights and Forecast - by Type
- 10.1.1. Liquid
- 10.1.2. Powder
- 10.2. Market Analysis, Insights and Forecast - by End-user Industry
- 10.2.1. Food and Beverage
- 10.2.2. Pharmaceutical
- 10.2.3. Animal Feed
- 10.2.4. Other End-user Industries
- 10.1. Market Analysis, Insights and Forecast - by Type
- 11. Middle East and Africa Methionine Industry Analysis, Insights and Forecast, 2020-2032
- 11.1. Market Analysis, Insights and Forecast - by Type
- 11.1.1. Liquid
- 11.1.2. Powder
- 11.2. Market Analysis, Insights and Forecast - by End-user Industry
- 11.2.1. Food and Beverage
- 11.2.2. Pharmaceutical
- 11.2.3. Animal Feed
- 11.2.4. Other End-user Industries
- 11.1. Market Analysis, Insights and Forecast - by Type
- 12. Competitive Analysis
- 12.1. Company Profiles
- 12.1.1 Sumitomo Chemical Co Ltd
- 12.1.1.1. Company Overview
- 12.1.1.2. Products
- 12.1.1.3. Company Financials
- 12.1.1.4. SWOT Analysis
- 12.1.2 Evonik Industries AG
- 12.1.2.1. Company Overview
- 12.1.2.2. Products
- 12.1.2.3. Company Financials
- 12.1.2.4. SWOT Analysis
- 12.1.3 NOVUS INTERNATIONAL
- 12.1.3.1. Company Overview
- 12.1.3.2. Products
- 12.1.3.3. Company Financials
- 12.1.3.4. SWOT Analysis
- 12.1.4 Chongqing Unisplendour Chemical Co Ltd
- 12.1.4.1. Company Overview
- 12.1.4.2. Products
- 12.1.4.3. Company Financials
- 12.1.4.4. SWOT Analysis
- 12.1.5 Adisseo
- 12.1.5.1. Company Overview
- 12.1.5.2. Products
- 12.1.5.3. Company Financials
- 12.1.5.4. SWOT Analysis
- 12.1.6 Volzhsky Orgsynthese JSC
- 12.1.6.1. Company Overview
- 12.1.6.2. Products
- 12.1.6.3. Company Financials
- 12.1.6.4. SWOT Analysis
- 12.1.7 Zhejiang NHU Co Ltd*List Not Exhaustive
- 12.1.7.1. Company Overview
- 12.1.7.2. Products
- 12.1.7.3. Company Financials
- 12.1.7.4. SWOT Analysis
- 12.1.8 CJ CheilJedang Corp
- 12.1.8.1. Company Overview
- 12.1.8.2. Products
- 12.1.8.3. Company Financials
- 12.1.8.4. SWOT Analysis
- 12.1.1 Sumitomo Chemical Co Ltd
- 12.2. Market Entropy
- 12.2.1 Company's Key Areas Served
- 12.2.2 Recent Developments
- 12.3. Company Market Share Analysis 2025
- 12.3.1 Top 5 Companies Market Share Analysis
- 12.3.2 Top 3 Companies Market Share Analysis
- 12.4. List of Potential Customers
- 13. Research Methodology
List of Figures
- Figure 1: Global Methionine Industry Revenue Breakdown (million, %) by Region 2025 & 2033
- Figure 2: Asia Pacific Methionine Industry Revenue (million), by Type 2025 & 2033
- Figure 3: Asia Pacific Methionine Industry Revenue Share (%), by Type 2025 & 2033
- Figure 4: Asia Pacific Methionine Industry Revenue (million), by End-user Industry 2025 & 2033
- Figure 5: Asia Pacific Methionine Industry Revenue Share (%), by End-user Industry 2025 & 2033
- Figure 6: Asia Pacific Methionine Industry Revenue (million), by Country 2025 & 2033
- Figure 7: Asia Pacific Methionine Industry Revenue Share (%), by Country 2025 & 2033
- Figure 8: North America Methionine Industry Revenue (million), by Type 2025 & 2033
- Figure 9: North America Methionine Industry Revenue Share (%), by Type 2025 & 2033
- Figure 10: North America Methionine Industry Revenue (million), by End-user Industry 2025 & 2033
- Figure 11: North America Methionine Industry Revenue Share (%), by End-user Industry 2025 & 2033
- Figure 12: North America Methionine Industry Revenue (million), by Country 2025 & 2033
- Figure 13: North America Methionine Industry Revenue Share (%), by Country 2025 & 2033
- Figure 14: Europe Methionine Industry Revenue (million), by Type 2025 & 2033
- Figure 15: Europe Methionine Industry Revenue Share (%), by Type 2025 & 2033
- Figure 16: Europe Methionine Industry Revenue (million), by End-user Industry 2025 & 2033
- Figure 17: Europe Methionine Industry Revenue Share (%), by End-user Industry 2025 & 2033
- Figure 18: Europe Methionine Industry Revenue (million), by Country 2025 & 2033
- Figure 19: Europe Methionine Industry Revenue Share (%), by Country 2025 & 2033
- Figure 20: South America Methionine Industry Revenue (million), by Type 2025 & 2033
- Figure 21: South America Methionine Industry Revenue Share (%), by Type 2025 & 2033
- Figure 22: South America Methionine Industry Revenue (million), by End-user Industry 2025 & 2033
- Figure 23: South America Methionine Industry Revenue Share (%), by End-user Industry 2025 & 2033
- Figure 24: South America Methionine Industry Revenue (million), by Country 2025 & 2033
- Figure 25: South America Methionine Industry Revenue Share (%), by Country 2025 & 2033
- Figure 26: Middle East and Africa Methionine Industry Revenue (million), by Type 2025 & 2033
- Figure 27: Middle East and Africa Methionine Industry Revenue Share (%), by Type 2025 & 2033
- Figure 28: Middle East and Africa Methionine Industry Revenue (million), by End-user Industry 2025 & 2033
- Figure 29: Middle East and Africa Methionine Industry Revenue Share (%), by End-user Industry 2025 & 2033
- Figure 30: Middle East and Africa Methionine Industry Revenue (million), by Country 2025 & 2033
- Figure 31: Middle East and Africa Methionine Industry Revenue Share (%), by Country 2025 & 2033
List of Tables
- Table 1: Global Methionine Industry Revenue million Forecast, by Type 2020 & 2033
- Table 2: Global Methionine Industry Revenue million Forecast, by End-user Industry 2020 & 2033
- Table 3: Global Methionine Industry Revenue million Forecast, by Region 2020 & 2033
- Table 4: Global Methionine Industry Revenue million Forecast, by Type 2020 & 2033
- Table 5: Global Methionine Industry Revenue million Forecast, by End-user Industry 2020 & 2033
- Table 6: Global Methionine Industry Revenue million Forecast, by Country 2020 & 2033
- Table 7: China Methionine Industry Revenue (million) Forecast, by Application 2020 & 2033
- Table 8: India Methionine Industry Revenue (million) Forecast, by Application 2020 & 2033
- Table 9: Japan Methionine Industry Revenue (million) Forecast, by Application 2020 & 2033
- Table 10: South Korea Methionine Industry Revenue (million) Forecast, by Application 2020 & 2033
- Table 11: Rest of Asia Pacific Methionine Industry Revenue (million) Forecast, by Application 2020 & 2033
- Table 12: Global Methionine Industry Revenue million Forecast, by Type 2020 & 2033
- Table 13: Global Methionine Industry Revenue million Forecast, by End-user Industry 2020 & 2033
- Table 14: Global Methionine Industry Revenue million Forecast, by Country 2020 & 2033
- Table 15: United States Methionine Industry Revenue (million) Forecast, by Application 2020 & 2033
- Table 16: Canada Methionine Industry Revenue (million) Forecast, by Application 2020 & 2033
- Table 17: Mexico Methionine Industry Revenue (million) Forecast, by Application 2020 & 2033
- Table 18: Global Methionine Industry Revenue million Forecast, by Type 2020 & 2033
- Table 19: Global Methionine Industry Revenue million Forecast, by End-user Industry 2020 & 2033
- Table 20: Global Methionine Industry Revenue million Forecast, by Country 2020 & 2033
- Table 21: Germany Methionine Industry Revenue (million) Forecast, by Application 2020 & 2033
- Table 22: United Kingdom Methionine Industry Revenue (million) Forecast, by Application 2020 & 2033
- Table 23: Italy Methionine Industry Revenue (million) Forecast, by Application 2020 & 2033
- Table 24: France Methionine Industry Revenue (million) Forecast, by Application 2020 & 2033
- Table 25: Rest of Europe Methionine Industry Revenue (million) Forecast, by Application 2020 & 2033
- Table 26: Global Methionine Industry Revenue million Forecast, by Type 2020 & 2033
- Table 27: Global Methionine Industry Revenue million Forecast, by End-user Industry 2020 & 2033
- Table 28: Global Methionine Industry Revenue million Forecast, by Country 2020 & 2033
- Table 29: Brazil Methionine Industry Revenue (million) Forecast, by Application 2020 & 2033
- Table 30: Argentina Methionine Industry Revenue (million) Forecast, by Application 2020 & 2033
- Table 31: Rest of South America Methionine Industry Revenue (million) Forecast, by Application 2020 & 2033
- Table 32: Global Methionine Industry Revenue million Forecast, by Type 2020 & 2033
- Table 33: Global Methionine Industry Revenue million Forecast, by End-user Industry 2020 & 2033
- Table 34: Global Methionine Industry Revenue million Forecast, by Country 2020 & 2033
- Table 35: Saudi Arabia Methionine Industry Revenue (million) Forecast, by Application 2020 & 2033
- Table 36: South Africa Methionine Industry Revenue (million) Forecast, by Application 2020 & 2033
- Table 37: Rest of Middle East and Africa Methionine Industry Revenue (million) Forecast, by Application 2020 & 2033
Frequently Asked Questions
1. What is the projected Compound Annual Growth Rate (CAGR) of the Methionine Industry?
The projected CAGR is approximately 4.3%.
2. Which companies are prominent players in the Methionine Industry?
Key companies in the market include Sumitomo Chemical Co Ltd, Evonik Industries AG, NOVUS INTERNATIONAL, Chongqing Unisplendour Chemical Co Ltd, Adisseo, Volzhsky Orgsynthese JSC, Zhejiang NHU Co Ltd*List Not Exhaustive, CJ CheilJedang Corp.
3. What are the main segments of the Methionine Industry?
The market segments include Type, End-user Industry.
4. Can you provide details about the market size?
The market size is estimated to be USD 6310 million as of 2022.
5. What are some drivers contributing to market growth?
Growing Demand from the Poultry Industry; Emerging Demand from the Aquaculture Industry.
6. What are the notable trends driving market growth?
Increasing Demand from the Animal Feed Segment.
7. Are there any restraints impacting market growth?
Complex Process of Manufacturing Methionine.
8. Can you provide examples of recent developments in the market?
September 2022: Adisseo started liquid methionine production through its 180,000-ton new plant in Nanjing, China. The company has doubled its methionine capacity to 350,000 tons through its operational new plant consolidating its leading position in the world.
9. What pricing options are available for accessing the report?
Pricing options include single-user, multi-user, and enterprise licenses priced at USD 4750, USD 5250, and USD 8750 respectively.
10. Is the market size provided in terms of value or volume?
The market size is provided in terms of value, measured in million.
11. Are there any specific market keywords associated with the report?
Yes, the market keyword associated with the report is "Methionine Industry," which aids in identifying and referencing the specific market segment covered.
12. How do I determine which pricing option suits my needs best?
The pricing options vary based on user requirements and access needs. Individual users may opt for single-user licenses, while businesses requiring broader access may choose multi-user or enterprise licenses for cost-effective access to the report.
13. Are there any additional resources or data provided in the Methionine Industry report?
While the report offers comprehensive insights, it's advisable to review the specific contents or supplementary materials provided to ascertain if additional resources or data are available.
14. How can I stay updated on further developments or reports in the Methionine Industry?
To stay informed about further developments, trends, and reports in the Methionine Industry, consider subscribing to industry newsletters, following relevant companies and organizations, or regularly checking reputable industry news sources and publications.
Methodology
Step 1 - Identification of Relevant Samples Size from Population Database


Step 2 - Approaches for Defining Global Market Size (Value, Volume* & Price*)

Note*: In applicable scenarios
Step 3 - Data Sources
Primary Research
- Web Analytics
- Survey Reports
- Research Institute
- Latest Research Reports
- Opinion Leaders
Secondary Research
- Annual Reports
- White Paper
- Latest Press Release
- Industry Association
- Paid Database
- Investor Presentations

Step 4 - Data Triangulation
Involves using different sources of information in order to increase the validity of a study
These sources are likely to be stakeholders in a program - participants, other researchers, program staff, other community members, and so on.
Then we put all data in single framework & apply various statistical tools to find out the dynamic on the market.
During the analysis stage, feedback from the stakeholder groups would be compared to determine areas of agreement as well as areas of divergence