

Key Insights
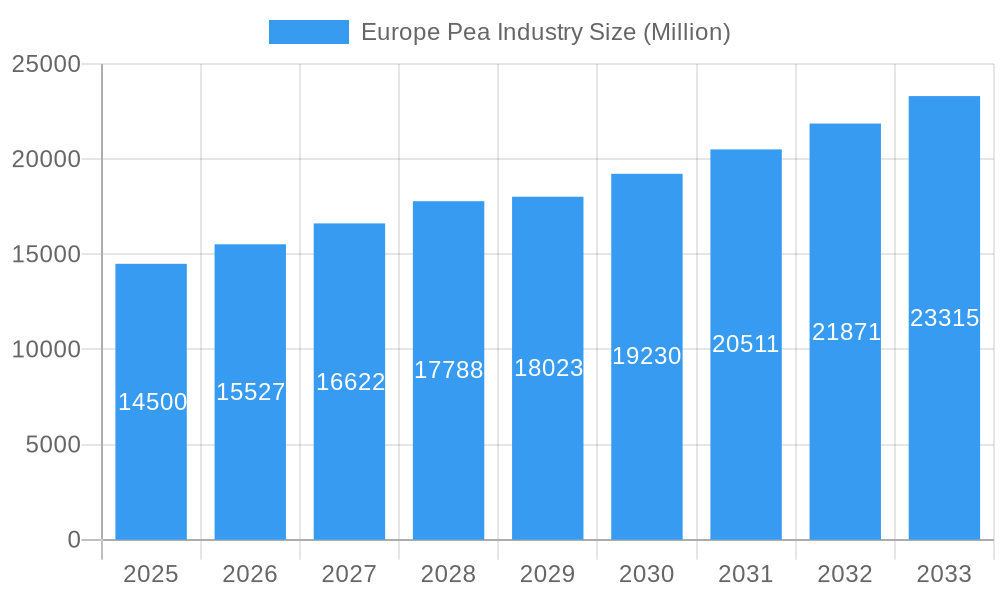
The European pea industry, valued at €14.5 billion in 2025, is projected to experience robust growth, driven by increasing consumer demand for plant-based protein sources and the growing popularity of pea-based products in food and beverage applications. This surge in demand is fueled by the rising awareness of health and sustainability concerns among European consumers, leading to a shift towards plant-based diets. Furthermore, the industry benefits from ongoing innovation in pea processing technologies, leading to improved product quality and expanded applications across diverse sectors such as food, feed, and biomaterials. Key players like Sensus, Tereos, Lantmännen, AGRANA, and Roquette are actively investing in research and development to enhance pea production efficiency and product diversification, further contributing to market growth. The CAGR of 6.88% indicates a steady and predictable upward trend through 2033, with Germany, France, and the UK expected to remain significant contributors to the overall market size. Challenges include fluctuating agricultural yields due to climate variability and competition from other plant-based protein sources, such as soy and lentils. However, the industry's adaptability and innovation capacity mitigate these risks. Regional variations exist within the European market, with some countries like Germany exhibiting higher growth rates due to factors such as favorable government policies and strong domestic demand. The market is segmented by production (Russia being a key production hub) and price trends across major countries like Ukraine, France, Spain, and the Netherlands.
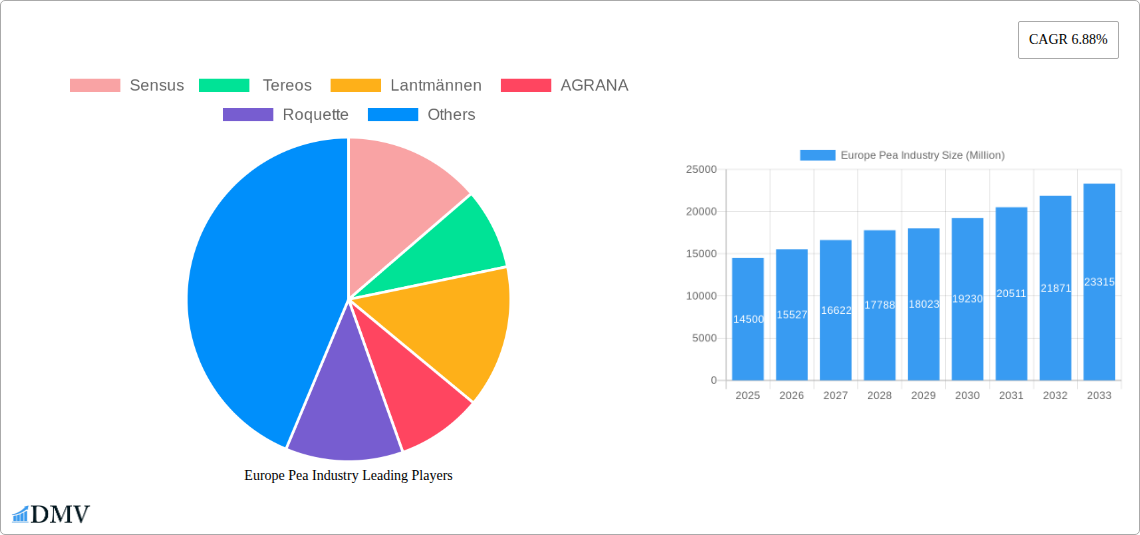
Europe Pea Industry Market Size (In Billion)
The projected growth trajectory suggests substantial investment opportunities in the European pea industry. The continuous development of new pea-based products and the expanding applications in food processing, animal feed, and industrial sectors promise to solidify the long-term viability and profitability of this market. Strategies for sustainable farming practices, along with investments in efficient processing technologies and supply chain optimization, will be crucial for industry players to capitalize on the expanding market opportunities and address potential challenges, including climate change and competition. The focus on value-added pea products, like protein isolates and flours, holds particularly promising growth potential in the coming years.
Europe Pea Industry Company Market Share
Europe Pea Industry: A Comprehensive Market Report (2019-2033)
This insightful report provides a comprehensive analysis of the Europe pea industry, encompassing market dynamics, key players, and future growth projections from 2019 to 2033. We delve into production, pricing trends, innovation, and regulatory landscapes, offering critical insights for stakeholders across the value chain. The report leverages extensive data analysis and expert insights to deliver a detailed understanding of this evolving market, projecting a market value exceeding xx Million by 2033. Our base year is 2025, with a forecast period spanning 2025-2033 and a historical period covering 2019-2024.
Europe Pea Industry Market Composition & Trends
This section examines the competitive landscape, innovation drivers, regulatory environment, substitute products, end-user profiles, and mergers & acquisitions (M&A) within the European pea industry. The market is characterized by a moderately concentrated structure, with key players like Roquette, Lantmännen, Tereos, AGRANA, and Sensus holding significant market share. However, the entry of smaller, specialized companies focusing on organic and specialty pea products is increasing competition.
- Market Share Distribution (2024): Roquette (25%), Lantmännen (18%), Tereos (15%), AGRANA (12%), Sensus (10%), Others (20%). These figures are estimations based on available market data.
- Innovation Catalysts: Growing consumer demand for plant-based proteins, coupled with technological advancements in pea processing and extraction, is driving innovation.
- Regulatory Landscape: EU regulations on food safety and labeling influence product development and market access.
- Substitute Products: Other pulses (beans, lentils), soy protein, and other plant-based proteins pose competition.
- End-User Profiles: Food and beverage manufacturers, animal feed producers, and the health and wellness sector are major end-users.
- M&A Activities: The past five years have witnessed xx Million worth of M&A activity, primarily focused on expanding production capacity and gaining access to new markets.
Europe Pea Industry Industry Evolution
The European pea industry has witnessed significant growth during the historical period (2019-2024), driven by rising consumer demand for plant-based alternatives and increasing awareness of the nutritional benefits of peas. Technological advancements in pea protein extraction and processing have further enhanced the industry's growth trajectory. The forecast period (2025-2033) anticipates continued expansion, with an estimated Compound Annual Growth Rate (CAGR) of xx%. This growth is fueled by several factors including the increasing adoption of plant-based diets, the development of innovative pea-based products, and rising investments in pea processing technologies. Consumer preferences are shifting towards sustainable and ethically sourced food products, creating a favorable environment for the growth of the European pea industry. The market is expected to reach xx Million by 2033.
Leading Regions, Countries, or Segments in Europe Pea Industry
The European pea industry exhibits regional variations in production and consumption. While data for all regions is incomplete, current trends suggest France, Spain, and the Netherlands remain significant producers and consumers of peas. Russia's production volume is also notable, despite challenges impacting market access.
Key Drivers:
- France: Strong agricultural infrastructure, established processing capabilities, and proximity to major European markets contribute to France's leading role.
- Spain: Favorable climate and growing demand for plant-based products drive Spain's expanding pea market.
- Netherlands: Advanced agricultural technology and a focus on sustainable food production support its considerable role.
- Russia: Despite geopolitical factors, Russia holds a substantial portion of the European pea production, especially for specific varieties. Production analysis reveals an output fluctuating between xx and xx million tons annually, but export data remains impacted by the above-mentioned issues.
- Ukraine: Price trend analysis in Ukraine reflects volatility due to recent geopolitical events. Prices experienced spikes followed by periods of fluctuation and uncertainty.
- Rest of Europe: A diverse landscape exists, where smaller producers and processors adapt to the local context.
Europe Pea Industry Product Innovations
Recent innovations focus on expanding the applications of pea ingredients. Roquette's launch of organic pea starch and protein in 2022 exemplifies the trend toward high-quality, sustainable alternatives. Technological advancements in extraction processes improve the functionality of pea proteins, broadening their application in food and beverage products, making them a viable replacement in diverse food products, from meat substitutes to dairy alternatives. Novel applications include the development of pea-based snacks, ready meals and ingredient usage in cosmetics.
Propelling Factors for Europe Pea Industry Growth
Several factors are driving growth in the European pea industry. The surge in consumer demand for plant-based foods is a significant catalyst, along with increasing investments in research and development of improved pea varieties and processing technologies. Favorable government policies supporting sustainable agriculture and the growing awareness of the nutritional and health benefits of peas further contribute to industry expansion.
Obstacles in the Europe Pea Industry Market
Challenges include fluctuating raw material prices, potential supply chain disruptions, and intense competition from other plant-based protein sources, such as soy. Regulatory hurdles relating to food safety and labeling could also impact growth. Geopolitical events and weather variability can influence the availability and costs of pea production.
Future Opportunities in Europe Pea Industry
Emerging opportunities lie in exploring new applications for pea proteins and starches in areas such as bioplastics and pharmaceuticals. The growing demand for sustainable and ethical products presents significant potential for expanding market share. Further research and development could lead to new pea varieties with improved yields and nutritional profiles. Penetration into new markets and partnerships with food and beverage companies are major opportunities.
Major Players in the Europe Pea Industry Ecosystem
- Sensus
- Tereos
- Lantmännen
- AGRANA
- Roquette
Key Developments in Europe Pea Industry Industry
- October 2022: Roquette launches a new line of organic pea ingredients, strengthening its position in the growing organic food market.
- September 2022: Lantmännen invests USD 95.7 Million in a new pea protein production facility, signaling a significant commitment to expanding capacity.
- May 2022: The phytosanitary protocol signed between China and Russia opens new export avenues for peas, potentially altering global market dynamics and increasing competition for Canadian pea exports.
Strategic Europe Pea Industry Market Forecast
The European pea industry is poised for continued growth, driven by increasing demand for plant-based proteins, ongoing innovation in processing technologies, and supportive regulatory environments. The market is expected to experience significant expansion over the forecast period (2025-2033), driven by the rising adoption of plant-based diets, investments in new technologies, and expansion into new markets. The industry will remain competitive, requiring companies to innovate and adapt to evolving consumer preferences. Successful companies will invest in research and development and build sustainable supply chains.
Europe Pea Industry Segmentation
-
1. Russia
-
1.1. Production Analysis
- 1.1.1. Consumption Analysis and Market Value
- 1.1.2. Import Market Analysis (Volume and Value)
- 1.1.3. Export Market Analysis (Volume and Value)
- 1.1.4. Price Trend Analysis
- 1.2. Ukraine
- 1.3. France
- 1.4. Spain
- 1.5. Netherlands
- 1.6. Rest of Europe
-
1.1. Production Analysis
-
2. Russia
-
2.1. Production Analysis
- 2.1.1. Consumption Analysis and Market Value
- 2.1.2. Import Market Analysis (Volume and Value)
- 2.1.3. Export Market Analysis (Volume and Value)
- 2.1.4. Price Trend Analysis
- 2.2. Ukraine
- 2.3. France
- 2.4. Spain
- 2.5. Netherlands
- 2.6. Rest of Europe
-
2.1. Production Analysis
Europe Pea Industry Segmentation By Geography
-
1. Europe
- 1.1. United Kingdom
- 1.2. Germany
- 1.3. France
- 1.4. Italy
- 1.5. Spain
- 1.6. Netherlands
- 1.7. Belgium
- 1.8. Sweden
- 1.9. Norway
- 1.10. Poland
- 1.11. Denmark
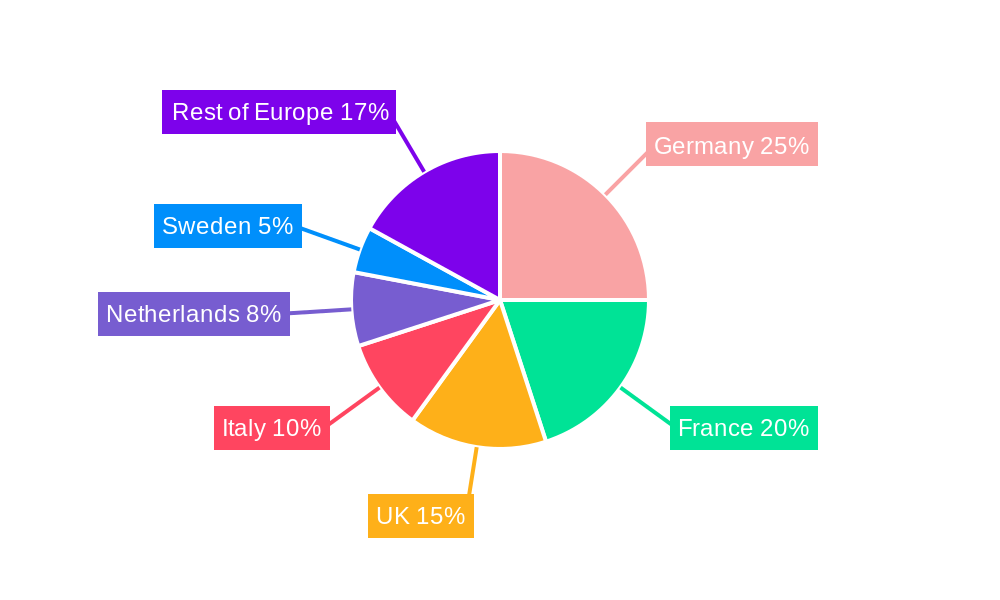
Europe Pea Industry Regional Market Share
Geographic Coverage of Europe Pea Industry
Europe Pea Industry REPORT HIGHLIGHTS
| Aspects | Details |
|---|---|
| Study Period | 2020-2034 |
| Base Year | 2025 |
| Estimated Year | 2026 |
| Forecast Period | 2026-2034 |
| Historical Period | 2020-2025 |
| Growth Rate | CAGR of 6.88% from 2020-2034 |
| Segmentation |
|
Table of Contents
- 1. Introduction
- 1.1. Research Scope
- 1.2. Market Segmentation
- 1.3. Research Methodology
- 1.4. Definitions and Assumptions
- 2. Executive Summary
- 2.1. Introduction
- 3. Market Dynamics
- 3.1. Introduction
- 3.2. Market Drivers
- 3.2.1. Rising Consumption of Cashew Nuts in the Country; Favorable Government Initiatives
- 3.3. Market Restrains
- 3.3.1. Hazardous Climatic Condition Hinders Cashew Production; Stringent Regulations Related to Food Quality Standards
- 3.4. Market Trends
- 3.4.1. Growing Export Opportunity
- 4. Market Factor Analysis
- 4.1. Porters Five Forces
- 4.2. Supply/Value Chain
- 4.3. PESTEL analysis
- 4.4. Market Entropy
- 4.5. Patent/Trademark Analysis
- 5. Europe Pea Industry Analysis, Insights and Forecast, 2020-2032
- 5.1. Market Analysis, Insights and Forecast - by Russia
- 5.1.1. Production Analysis
- 5.1.1.1. Consumption Analysis and Market Value
- 5.1.1.2. Import Market Analysis (Volume and Value)
- 5.1.1.3. Export Market Analysis (Volume and Value)
- 5.1.1.4. Price Trend Analysis
- 5.1.2. Ukraine
- 5.1.3. France
- 5.1.4. Spain
- 5.1.5. Netherlands
- 5.1.6. Rest of Europe
- 5.1.1. Production Analysis
- 5.2. Market Analysis, Insights and Forecast - by Russia
- 5.2.1. Production Analysis
- 5.2.1.1. Consumption Analysis and Market Value
- 5.2.1.2. Import Market Analysis (Volume and Value)
- 5.2.1.3. Export Market Analysis (Volume and Value)
- 5.2.1.4. Price Trend Analysis
- 5.2.2. Ukraine
- 5.2.3. France
- 5.2.4. Spain
- 5.2.5. Netherlands
- 5.2.6. Rest of Europe
- 5.2.1. Production Analysis
- 5.3. Market Analysis, Insights and Forecast - by Region
- 5.3.1. Europe
- 5.1. Market Analysis, Insights and Forecast - by Russia
- 6. Competitive Analysis
- 6.1. Market Share Analysis 2025
- 6.2. Company Profiles
- 6.2.1 Sensus
- 6.2.1.1. Overview
- 6.2.1.2. Products
- 6.2.1.3. SWOT Analysis
- 6.2.1.4. Recent Developments
- 6.2.1.5. Financials (Based on Availability)
- 6.2.2 Tereos
- 6.2.2.1. Overview
- 6.2.2.2. Products
- 6.2.2.3. SWOT Analysis
- 6.2.2.4. Recent Developments
- 6.2.2.5. Financials (Based on Availability)
- 6.2.3 Lantmännen
- 6.2.3.1. Overview
- 6.2.3.2. Products
- 6.2.3.3. SWOT Analysis
- 6.2.3.4. Recent Developments
- 6.2.3.5. Financials (Based on Availability)
- 6.2.4 AGRANA
- 6.2.4.1. Overview
- 6.2.4.2. Products
- 6.2.4.3. SWOT Analysis
- 6.2.4.4. Recent Developments
- 6.2.4.5. Financials (Based on Availability)
- 6.2.5 Roquette
- 6.2.5.1. Overview
- 6.2.5.2. Products
- 6.2.5.3. SWOT Analysis
- 6.2.5.4. Recent Developments
- 6.2.5.5. Financials (Based on Availability)
- 6.2.1 Sensus
List of Figures
- Figure 1: Europe Pea Industry Revenue Breakdown (Million, %) by Product 2025 & 2033
- Figure 2: Europe Pea Industry Share (%) by Company 2025
List of Tables
- Table 1: Europe Pea Industry Revenue Million Forecast, by Russia 2020 & 2033
- Table 2: Europe Pea Industry Volume million units Forecast, by Russia 2020 & 2033
- Table 3: Europe Pea Industry Revenue Million Forecast, by Russia 2020 & 2033
- Table 4: Europe Pea Industry Volume million units Forecast, by Russia 2020 & 2033
- Table 5: Europe Pea Industry Revenue Million Forecast, by Region 2020 & 2033
- Table 6: Europe Pea Industry Volume million units Forecast, by Region 2020 & 2033
- Table 7: Europe Pea Industry Revenue Million Forecast, by Russia 2020 & 2033
- Table 8: Europe Pea Industry Volume million units Forecast, by Russia 2020 & 2033
- Table 9: Europe Pea Industry Revenue Million Forecast, by Russia 2020 & 2033
- Table 10: Europe Pea Industry Volume million units Forecast, by Russia 2020 & 2033
- Table 11: Europe Pea Industry Revenue Million Forecast, by Country 2020 & 2033
- Table 12: Europe Pea Industry Volume million units Forecast, by Country 2020 & 2033
- Table 13: United Kingdom Europe Pea Industry Revenue (Million) Forecast, by Application 2020 & 2033
- Table 14: United Kingdom Europe Pea Industry Volume (million units) Forecast, by Application 2020 & 2033
- Table 15: Germany Europe Pea Industry Revenue (Million) Forecast, by Application 2020 & 2033
- Table 16: Germany Europe Pea Industry Volume (million units) Forecast, by Application 2020 & 2033
- Table 17: France Europe Pea Industry Revenue (Million) Forecast, by Application 2020 & 2033
- Table 18: France Europe Pea Industry Volume (million units) Forecast, by Application 2020 & 2033
- Table 19: Italy Europe Pea Industry Revenue (Million) Forecast, by Application 2020 & 2033
- Table 20: Italy Europe Pea Industry Volume (million units) Forecast, by Application 2020 & 2033
- Table 21: Spain Europe Pea Industry Revenue (Million) Forecast, by Application 2020 & 2033
- Table 22: Spain Europe Pea Industry Volume (million units) Forecast, by Application 2020 & 2033
- Table 23: Netherlands Europe Pea Industry Revenue (Million) Forecast, by Application 2020 & 2033
- Table 24: Netherlands Europe Pea Industry Volume (million units) Forecast, by Application 2020 & 2033
- Table 25: Belgium Europe Pea Industry Revenue (Million) Forecast, by Application 2020 & 2033
- Table 26: Belgium Europe Pea Industry Volume (million units) Forecast, by Application 2020 & 2033
- Table 27: Sweden Europe Pea Industry Revenue (Million) Forecast, by Application 2020 & 2033
- Table 28: Sweden Europe Pea Industry Volume (million units) Forecast, by Application 2020 & 2033
- Table 29: Norway Europe Pea Industry Revenue (Million) Forecast, by Application 2020 & 2033
- Table 30: Norway Europe Pea Industry Volume (million units) Forecast, by Application 2020 & 2033
- Table 31: Poland Europe Pea Industry Revenue (Million) Forecast, by Application 2020 & 2033
- Table 32: Poland Europe Pea Industry Volume (million units) Forecast, by Application 2020 & 2033
- Table 33: Denmark Europe Pea Industry Revenue (Million) Forecast, by Application 2020 & 2033
- Table 34: Denmark Europe Pea Industry Volume (million units) Forecast, by Application 2020 & 2033
Frequently Asked Questions
1. What is the projected Compound Annual Growth Rate (CAGR) of the Europe Pea Industry?
The projected CAGR is approximately 6.88%.
2. Which companies are prominent players in the Europe Pea Industry?
Key companies in the market include Sensus, Tereos , Lantmännen , AGRANA, Roquette .
3. What are the main segments of the Europe Pea Industry?
The market segments include Russia, Russia.
4. Can you provide details about the market size?
The market size is estimated to be USD 14.50 Million as of 2022.
5. What are some drivers contributing to market growth?
Rising Consumption of Cashew Nuts in the Country; Favorable Government Initiatives.
6. What are the notable trends driving market growth?
Growing Export Opportunity.
7. Are there any restraints impacting market growth?
Hazardous Climatic Condition Hinders Cashew Production; Stringent Regulations Related to Food Quality Standards.
8. Can you provide examples of recent developments in the market?
October 2022: Roquette, a global leader in plant-based ingredients and a pioneer of plant proteins, launched a new line of organic pea ingredients: organic pea starch and organic pea protein to the Europe market.
9. What pricing options are available for accessing the report?
Pricing options include single-user, multi-user, and enterprise licenses priced at USD 4750, USD 4950, and USD 6800 respectively.
10. Is the market size provided in terms of value or volume?
The market size is provided in terms of value, measured in Million and volume, measured in million units.
11. Are there any specific market keywords associated with the report?
Yes, the market keyword associated with the report is "Europe Pea Industry," which aids in identifying and referencing the specific market segment covered.
12. How do I determine which pricing option suits my needs best?
The pricing options vary based on user requirements and access needs. Individual users may opt for single-user licenses, while businesses requiring broader access may choose multi-user or enterprise licenses for cost-effective access to the report.
13. Are there any additional resources or data provided in the Europe Pea Industry report?
While the report offers comprehensive insights, it's advisable to review the specific contents or supplementary materials provided to ascertain if additional resources or data are available.
14. How can I stay updated on further developments or reports in the Europe Pea Industry?
To stay informed about further developments, trends, and reports in the Europe Pea Industry, consider subscribing to industry newsletters, following relevant companies and organizations, or regularly checking reputable industry news sources and publications.
Methodology
Step 1 - Identification of Relevant Samples Size from Population Database


Step 2 - Approaches for Defining Global Market Size (Value, Volume* & Price*)

Note*: In applicable scenarios
Step 3 - Data Sources
Primary Research
- Web Analytics
- Survey Reports
- Research Institute
- Latest Research Reports
- Opinion Leaders
Secondary Research
- Annual Reports
- White Paper
- Latest Press Release
- Industry Association
- Paid Database
- Investor Presentations

Step 4 - Data Triangulation
Involves using different sources of information in order to increase the validity of a study
These sources are likely to be stakeholders in a program - participants, other researchers, program staff, other community members, and so on.
Then we put all data in single framework & apply various statistical tools to find out the dynamic on the market.
During the analysis stage, feedback from the stakeholder groups would be compared to determine areas of agreement as well as areas of divergence