

Key Insights
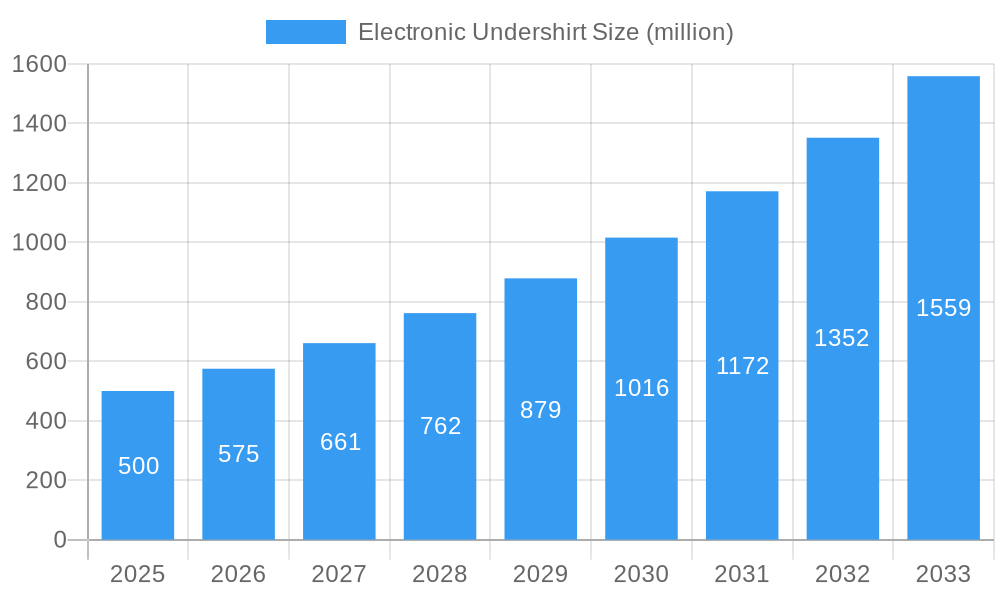
The global electronic undershirt market is experiencing robust growth, driven by increasing demand for wearable health monitoring technologies and a rising geriatric population requiring continuous health surveillance. The market, estimated at $500 million in 2025, is projected to exhibit a Compound Annual Growth Rate (CAGR) of 15% from 2025 to 2033, reaching a value exceeding $1.5 billion by 2033. Key drivers include advancements in sensor technology enabling more accurate and comprehensive data collection, miniaturization of electronic components allowing for greater comfort and discreet wear, and the increasing affordability of these devices. Furthermore, the growing adoption of telehealth and remote patient monitoring further fuels market expansion, as electronic undershirts offer a convenient and effective method for continuous health data transmission to healthcare providers. The market segmentation is diverse, with variations in functionalities (ECG monitoring, respiratory rate tracking, temperature sensing), target demographics (elderly, athletes, patients with chronic conditions), and pricing strategies. Companies like GlideWear, Hill-Rom, and Stryker are key players, competing on innovation, product features, and distribution networks. While challenges remain, such as ensuring data privacy and security and addressing potential skin irritations from prolonged wear, the long-term outlook for the electronic undershirt market remains highly positive.
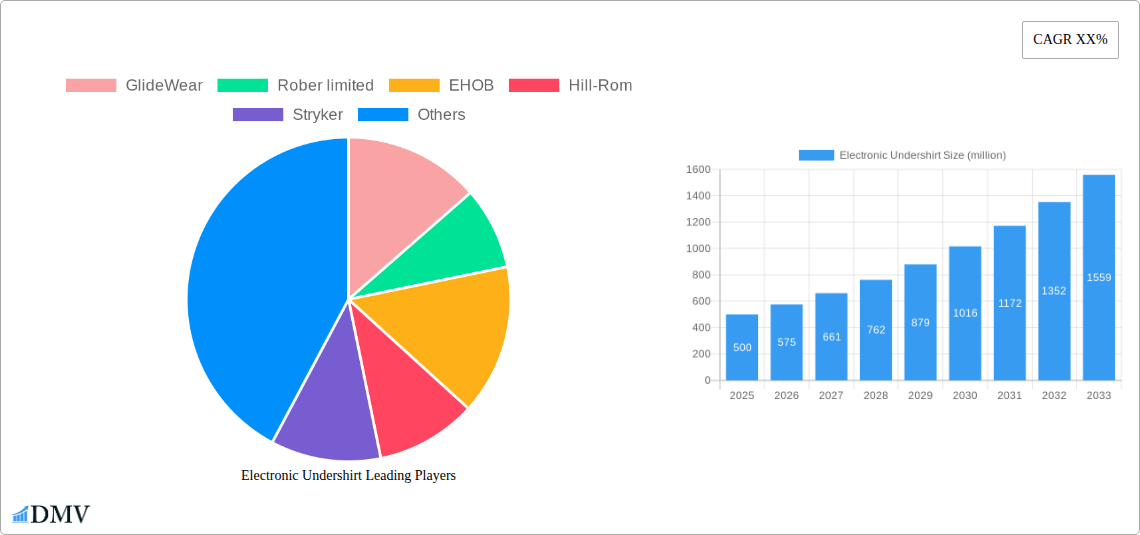
Electronic Undershirt Market Size (In Million)
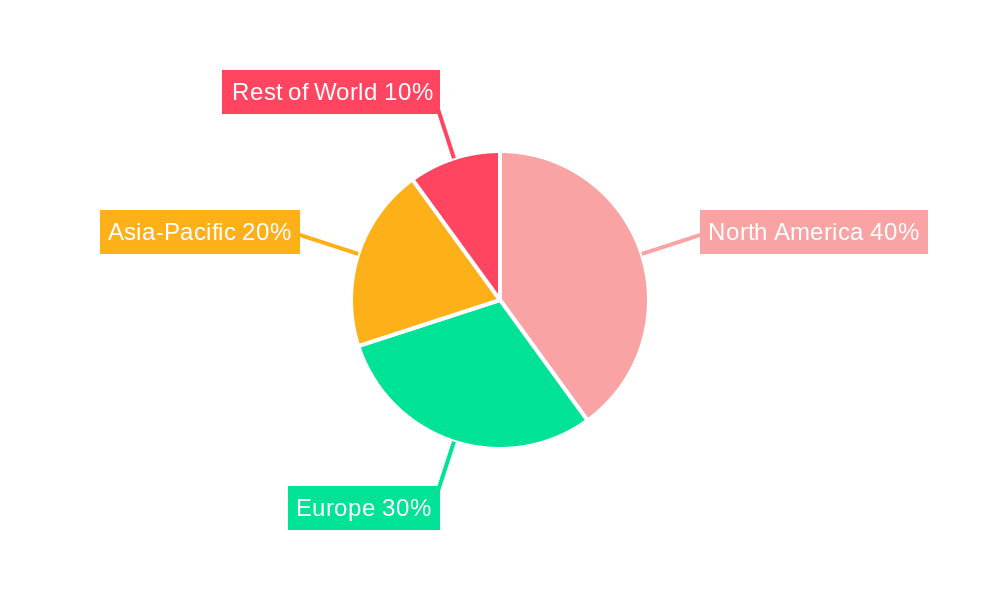
The competitive landscape is marked by both established medical device manufacturers and emerging technology companies vying for market share. Strategic partnerships between these players and healthcare providers are increasingly common, aiding in wider adoption. Geographical growth is expected to be varied, with North America and Europe maintaining a significant share due to advanced healthcare infrastructure and high technology adoption rates. However, Asia-Pacific is anticipated to witness rapid growth driven by rising disposable incomes and increasing awareness of health and wellness. Future innovation will focus on enhancing the functionality of electronic undershirts by integrating additional health parameters and improving data analytics capabilities to provide actionable insights for better patient care and disease management. This integration will likely involve Artificial Intelligence (AI) and machine learning to create more personalized and effective healthcare solutions.
Electronic Undershirt Company Market Share
Electronic Undershirt Market Report: A Comprehensive Analysis (2019-2033)
This insightful report provides a comprehensive analysis of the Electronic Undershirt market, projecting a multi-million dollar valuation by 2033. The study covers the period 2019-2033, with a base year of 2025 and a forecast period of 2025-2033. It offers a detailed examination of market composition, technological advancements, leading players, and future opportunities, providing crucial insights for stakeholders seeking to navigate this dynamic market. The report utilizes data from the historical period (2019-2024) to inform robust predictions for the future. Expect millions of data points showcasing market share, growth rates, and deal values, highlighting the lucrative potential of this innovative technology sector.
Electronic Undershirt Market Composition & Trends
This section meticulously analyzes the Electronic Undershirt market's competitive landscape, innovation drivers, regulatory frameworks, substitute products, and end-user demographics. We delve into the market concentration, revealing the share held by key players like GlideWear, Rober limited, and EHOB, while considering the impact of mergers and acquisitions (M&A) activity on market dynamics. Deal values exceeding xx million dollars in recent M&A activity are explored, influencing market share distribution. The regulatory landscape's effect on innovation and market expansion is analyzed, assessing factors such as product approvals and safety standards. Further analysis includes a deep dive into substitute products and their impact on market penetration. Finally, detailed end-user profiles are presented, offering a comprehensive view of the market’s diverse customer base.
- Market Share Distribution (2025): GlideWear (xx%), Rober limited (xx%), EHOB (xx%), Others (xx%)
- M&A Activity (2019-2024): xx deals totaling over xx million dollars.
- Key Regulatory Bodies: [List relevant regulatory bodies and their influence]
- Substitute Products: [List and analyze substitute products and their market impact]
Electronic Undershirt Industry Evolution
This section charts the evolution of the Electronic Undershirt industry, tracing its growth trajectory from 2019 to 2033. We examine technological advancements that have fueled market growth, including improvements in sensor technology, battery life, and data processing capabilities. The report analyzes shifting consumer demands, highlighting the growing preference for comfort, convenience, and personalized healthcare solutions. We incorporate data points like compound annual growth rates (CAGR) and adoption rates, presenting a clear picture of the industry's remarkable expansion. The analysis covers the impact of factors such as increased awareness of health and wellness, technological advancements and the increasing affordability of electronic undershirts on driving market growth. The influence of technological innovations on product development, consumer preferences, and market size are also closely scrutinized.
Leading Regions, Countries, or Segments in Electronic Undershirt
This section identifies the dominant regions, countries, or segments within the Electronic Undershirt market. Detailed analysis explores the factors driving the dominance of the leading region/country/segment, considering market size, economic conditions, and consumer behavior. Key drivers are highlighted using bullet points, providing a succinct overview of influential factors.
- Dominant Region/Country/Segment: [Specify the leading region, country, or segment]
- Key Drivers:
- Investment Trends: [Specific details on investment flows in the dominant region]
- Regulatory Support: [Details on supportive regulations in the dominant region]
- Consumer Preferences: [Analysis of consumer preferences driving market growth in the dominant region]
- Technological Advancements: [Specific examples of technological advancements impacting the region's market]
Electronic Undershirt Product Innovations
This section explores recent product innovations, encompassing new applications and performance metrics. It highlights the unique selling propositions (USPs) of various Electronic Undershirt products, such as enhanced comfort, improved data accuracy, and longer battery life. Technological advancements like the integration of artificial intelligence (AI) and machine learning (ML) are analyzed, showcasing their impact on product functionality and user experience.
Propelling Factors for Electronic Undershirt Growth
Several factors contribute to the growth of the Electronic Undershirt market. Technological advancements, including miniaturization of sensors and improved battery technology, are driving the adoption of these products. Economic factors, like increased disposable incomes and rising healthcare spending, further fuel market expansion. Furthermore, supportive government regulations and initiatives promoting health monitoring contribute significantly to market growth.
Obstacles in the Electronic Undershirt Market
Despite promising growth, challenges exist within the Electronic Undershirt market. Regulatory hurdles, such as stringent approval processes and data privacy concerns, can impede market expansion. Supply chain disruptions, potentially caused by geopolitical events or material shortages, can impact production and availability. Intense competition among established players and new entrants further creates pressure on pricing and market share. These factors may collectively restrain market growth by a projected xx million dollars by 2033.
Future Opportunities in Electronic Undershirt
The Electronic Undershirt market presents significant future opportunities. Expansion into new markets, such as emerging economies with growing healthcare awareness, holds immense potential. Development of advanced functionalities, including integration with wearable technology and telehealth platforms, offers substantial growth opportunities. Moreover, catering to emerging consumer trends like personalized healthcare and preventative medicine will create new market niches and drive demand for innovative Electronic Undershirt products.
Major Players in the Electronic Undershirt Ecosystem
- GlideWear
- Rober limited
- EHOB
- Hill-Rom
- Stryker
- Apex
- Skiin
- Proma Reha
- Besco
- Graham Field
- Invacare
- ARDO
- Victoria's Secret
- Aimer
- Chromat
- Greenyarn
- TORAY
- New Textile Technologies
- GUNZE LIMITED
- Cyrcadia Health
Key Developments in Electronic Undershirt Industry
- [Month, Year]: GlideWear launches a new Electronic Undershirt with enhanced sensor technology.
- [Month, Year]: Rober limited acquires a smaller competitor, expanding its market share.
- [Month, Year]: New regulations regarding data privacy are implemented, impacting market dynamics.
- [Month, Year]: EHOB introduces an Electronic Undershirt with improved battery life.
- [Month, Year]: A major technological breakthrough in sensor technology leads to the development of more accurate and reliable Electronic Undershirts.
Strategic Electronic Undershirt Market Forecast
The Electronic Undershirt market is poised for significant growth driven by technological innovation, expanding consumer awareness, and supportive regulatory frameworks. The forecast indicates continued market expansion, with a projected value of xx million dollars by 2033. Opportunities lie in technological advancements, particularly in AI and machine learning integration, and in tapping into new market segments, creating a strong outlook for long-term growth.
Electronic Undershirt Segmentation
-
1. Application
- 1.1. Comprehensive Shopping Mall
- 1.2. Department Store
- 1.3. Brand Shop
- 1.4. Underwear Store
- 1.5. Online Store
- 1.6. Other
-
2. Types
- 2.1. Men Electric Undershirt
- 2.2. Women Electric Undershirt
- 2.3. Unisex Electric Undershirt
Electronic Undershirt Segmentation By Geography
-
1. North America
- 1.1. United States
- 1.2. Canada
- 1.3. Mexico
-
2. South America
- 2.1. Brazil
- 2.2. Argentina
- 2.3. Rest of South America
-
3. Europe
- 3.1. United Kingdom
- 3.2. Germany
- 3.3. France
- 3.4. Italy
- 3.5. Spain
- 3.6. Russia
- 3.7. Benelux
- 3.8. Nordics
- 3.9. Rest of Europe
-
4. Middle East & Africa
- 4.1. Turkey
- 4.2. Israel
- 4.3. GCC
- 4.4. North Africa
- 4.5. South Africa
- 4.6. Rest of Middle East & Africa
-
5. Asia Pacific
- 5.1. China
- 5.2. India
- 5.3. Japan
- 5.4. South Korea
- 5.5. ASEAN
- 5.6. Oceania
- 5.7. Rest of Asia Pacific
Electronic Undershirt Regional Market Share
Geographic Coverage of Electronic Undershirt
Electronic Undershirt REPORT HIGHLIGHTS
| Aspects | Details |
|---|---|
| Study Period | 2020-2034 |
| Base Year | 2025 |
| Estimated Year | 2026 |
| Forecast Period | 2026-2034 |
| Historical Period | 2020-2025 |
| Growth Rate | CAGR of 14% from 2020-2034 |
| Segmentation |
|
Table of Contents
- 1. Introduction
- 1.1. Research Scope
- 1.2. Market Segmentation
- 1.3. Research Objective
- 1.4. Definitions and Assumptions
- 2. Executive Summary
- 2.1. Market Snapshot
- 3. Market Dynamics
- 3.1. Market Drivers
- 3.2. Market Restrains
- 3.3. Market Trends
- 3.4. Market Opportunities
- 4. Market Factor Analysis
- 4.1. Porters Five Forces
- 4.1.1. Bargaining Power of Suppliers
- 4.1.2. Bargaining Power of Buyers
- 4.1.3. Threat of New Entrants
- 4.1.4. Threat of Substitutes
- 4.1.5. Competitive Rivalry
- 4.2. PESTEL analysis
- 4.3. BCG Analysis
- 4.3.1. Stars (High Growth, High Market Share)
- 4.3.2. Cash Cows (Low Growth, High Market Share)
- 4.3.3. Question Mark (High Growth, Low Market Share)
- 4.3.4. Dogs (Low Growth, Low Market Share)
- 4.4. Ansoff Matrix Analysis
- 4.5. Supply Chain Analysis
- 4.6. Regulatory Landscape
- 4.7. Current Market Potential and Opportunity Assessment (TAM–SAM–SOM Framework)
- 4.8. DMV Analyst Note
- 4.1. Porters Five Forces
- 5. Market Analysis, Insights and Forecast 2021-2033
- 5.1. Market Analysis, Insights and Forecast - by Application
- 5.1.1. Comprehensive Shopping Mall
- 5.1.2. Department Store
- 5.1.3. Brand Shop
- 5.1.4. Underwear Store
- 5.1.5. Online Store
- 5.1.6. Other
- 5.2. Market Analysis, Insights and Forecast - by Types
- 5.2.1. Men Electric Undershirt
- 5.2.2. Women Electric Undershirt
- 5.2.3. Unisex Electric Undershirt
- 5.3. Market Analysis, Insights and Forecast - by Region
- 5.3.1. North America
- 5.3.2. South America
- 5.3.3. Europe
- 5.3.4. Middle East & Africa
- 5.3.5. Asia Pacific
- 5.1. Market Analysis, Insights and Forecast - by Application
- 6. Global Electronic Undershirt Analysis, Insights and Forecast, 2021-2033
- 6.1. Market Analysis, Insights and Forecast - by Application
- 6.1.1. Comprehensive Shopping Mall
- 6.1.2. Department Store
- 6.1.3. Brand Shop
- 6.1.4. Underwear Store
- 6.1.5. Online Store
- 6.1.6. Other
- 6.2. Market Analysis, Insights and Forecast - by Types
- 6.2.1. Men Electric Undershirt
- 6.2.2. Women Electric Undershirt
- 6.2.3. Unisex Electric Undershirt
- 6.1. Market Analysis, Insights and Forecast - by Application
- 7. North America Electronic Undershirt Analysis, Insights and Forecast, 2020-2032
- 7.1. Market Analysis, Insights and Forecast - by Application
- 7.1.1. Comprehensive Shopping Mall
- 7.1.2. Department Store
- 7.1.3. Brand Shop
- 7.1.4. Underwear Store
- 7.1.5. Online Store
- 7.1.6. Other
- 7.2. Market Analysis, Insights and Forecast - by Types
- 7.2.1. Men Electric Undershirt
- 7.2.2. Women Electric Undershirt
- 7.2.3. Unisex Electric Undershirt
- 7.1. Market Analysis, Insights and Forecast - by Application
- 8. South America Electronic Undershirt Analysis, Insights and Forecast, 2020-2032
- 8.1. Market Analysis, Insights and Forecast - by Application
- 8.1.1. Comprehensive Shopping Mall
- 8.1.2. Department Store
- 8.1.3. Brand Shop
- 8.1.4. Underwear Store
- 8.1.5. Online Store
- 8.1.6. Other
- 8.2. Market Analysis, Insights and Forecast - by Types
- 8.2.1. Men Electric Undershirt
- 8.2.2. Women Electric Undershirt
- 8.2.3. Unisex Electric Undershirt
- 8.1. Market Analysis, Insights and Forecast - by Application
- 9. Europe Electronic Undershirt Analysis, Insights and Forecast, 2020-2032
- 9.1. Market Analysis, Insights and Forecast - by Application
- 9.1.1. Comprehensive Shopping Mall
- 9.1.2. Department Store
- 9.1.3. Brand Shop
- 9.1.4. Underwear Store
- 9.1.5. Online Store
- 9.1.6. Other
- 9.2. Market Analysis, Insights and Forecast - by Types
- 9.2.1. Men Electric Undershirt
- 9.2.2. Women Electric Undershirt
- 9.2.3. Unisex Electric Undershirt
- 9.1. Market Analysis, Insights and Forecast - by Application
- 10. Middle East & Africa Electronic Undershirt Analysis, Insights and Forecast, 2020-2032
- 10.1. Market Analysis, Insights and Forecast - by Application
- 10.1.1. Comprehensive Shopping Mall
- 10.1.2. Department Store
- 10.1.3. Brand Shop
- 10.1.4. Underwear Store
- 10.1.5. Online Store
- 10.1.6. Other
- 10.2. Market Analysis, Insights and Forecast - by Types
- 10.2.1. Men Electric Undershirt
- 10.2.2. Women Electric Undershirt
- 10.2.3. Unisex Electric Undershirt
- 10.1. Market Analysis, Insights and Forecast - by Application
- 11. Asia Pacific Electronic Undershirt Analysis, Insights and Forecast, 2020-2032
- 11.1. Market Analysis, Insights and Forecast - by Application
- 11.1.1. Comprehensive Shopping Mall
- 11.1.2. Department Store
- 11.1.3. Brand Shop
- 11.1.4. Underwear Store
- 11.1.5. Online Store
- 11.1.6. Other
- 11.2. Market Analysis, Insights and Forecast - by Types
- 11.2.1. Men Electric Undershirt
- 11.2.2. Women Electric Undershirt
- 11.2.3. Unisex Electric Undershirt
- 11.1. Market Analysis, Insights and Forecast - by Application
- 12. Competitive Analysis
- 12.1. Company Profiles
- 12.1.1 GlideWear
- 12.1.1.1. Company Overview
- 12.1.1.2. Products
- 12.1.1.3. Company Financials
- 12.1.1.4. SWOT Analysis
- 12.1.2 Rober limited
- 12.1.2.1. Company Overview
- 12.1.2.2. Products
- 12.1.2.3. Company Financials
- 12.1.2.4. SWOT Analysis
- 12.1.3 EHOB
- 12.1.3.1. Company Overview
- 12.1.3.2. Products
- 12.1.3.3. Company Financials
- 12.1.3.4. SWOT Analysis
- 12.1.4 Hill-Rom
- 12.1.4.1. Company Overview
- 12.1.4.2. Products
- 12.1.4.3. Company Financials
- 12.1.4.4. SWOT Analysis
- 12.1.5 Stryker
- 12.1.5.1. Company Overview
- 12.1.5.2. Products
- 12.1.5.3. Company Financials
- 12.1.5.4. SWOT Analysis
- 12.1.6 Apex
- 12.1.6.1. Company Overview
- 12.1.6.2. Products
- 12.1.6.3. Company Financials
- 12.1.6.4. SWOT Analysis
- 12.1.7 Skiin
- 12.1.7.1. Company Overview
- 12.1.7.2. Products
- 12.1.7.3. Company Financials
- 12.1.7.4. SWOT Analysis
- 12.1.8 Proma Reha
- 12.1.8.1. Company Overview
- 12.1.8.2. Products
- 12.1.8.3. Company Financials
- 12.1.8.4. SWOT Analysis
- 12.1.9 Besco
- 12.1.9.1. Company Overview
- 12.1.9.2. Products
- 12.1.9.3. Company Financials
- 12.1.9.4. SWOT Analysis
- 12.1.10 Graham Field
- 12.1.10.1. Company Overview
- 12.1.10.2. Products
- 12.1.10.3. Company Financials
- 12.1.10.4. SWOT Analysis
- 12.1.11 Invacare
- 12.1.11.1. Company Overview
- 12.1.11.2. Products
- 12.1.11.3. Company Financials
- 12.1.11.4. SWOT Analysis
- 12.1.12 ARDO
- 12.1.12.1. Company Overview
- 12.1.12.2. Products
- 12.1.12.3. Company Financials
- 12.1.12.4. SWOT Analysis
- 12.1.13 Victoria's Secret
- 12.1.13.1. Company Overview
- 12.1.13.2. Products
- 12.1.13.3. Company Financials
- 12.1.13.4. SWOT Analysis
- 12.1.14 Aimer
- 12.1.14.1. Company Overview
- 12.1.14.2. Products
- 12.1.14.3. Company Financials
- 12.1.14.4. SWOT Analysis
- 12.1.15 Chromat
- 12.1.15.1. Company Overview
- 12.1.15.2. Products
- 12.1.15.3. Company Financials
- 12.1.15.4. SWOT Analysis
- 12.1.16 Greenyarn
- 12.1.16.1. Company Overview
- 12.1.16.2. Products
- 12.1.16.3. Company Financials
- 12.1.16.4. SWOT Analysis
- 12.1.17 TORAY
- 12.1.17.1. Company Overview
- 12.1.17.2. Products
- 12.1.17.3. Company Financials
- 12.1.17.4. SWOT Analysis
- 12.1.18 New Textile Technologies
- 12.1.18.1. Company Overview
- 12.1.18.2. Products
- 12.1.18.3. Company Financials
- 12.1.18.4. SWOT Analysis
- 12.1.19 GUNZE LIMITED
- 12.1.19.1. Company Overview
- 12.1.19.2. Products
- 12.1.19.3. Company Financials
- 12.1.19.4. SWOT Analysis
- 12.1.20 Cyrcadia Health
- 12.1.20.1. Company Overview
- 12.1.20.2. Products
- 12.1.20.3. Company Financials
- 12.1.20.4. SWOT Analysis
- 12.1.1 GlideWear
- 12.2. Market Entropy
- 12.2.1 Company's Key Areas Served
- 12.2.2 Recent Developments
- 12.3. Company Market Share Analysis 2025
- 12.3.1 Top 5 Companies Market Share Analysis
- 12.3.2 Top 3 Companies Market Share Analysis
- 12.4. List of Potential Customers
- 13. Research Methodology
List of Figures
- Figure 1: Global Electronic Undershirt Revenue Breakdown (undefined, %) by Region 2025 & 2033
- Figure 2: North America Electronic Undershirt Revenue (undefined), by Application 2025 & 2033
- Figure 3: North America Electronic Undershirt Revenue Share (%), by Application 2025 & 2033
- Figure 4: North America Electronic Undershirt Revenue (undefined), by Types 2025 & 2033
- Figure 5: North America Electronic Undershirt Revenue Share (%), by Types 2025 & 2033
- Figure 6: North America Electronic Undershirt Revenue (undefined), by Country 2025 & 2033
- Figure 7: North America Electronic Undershirt Revenue Share (%), by Country 2025 & 2033
- Figure 8: South America Electronic Undershirt Revenue (undefined), by Application 2025 & 2033
- Figure 9: South America Electronic Undershirt Revenue Share (%), by Application 2025 & 2033
- Figure 10: South America Electronic Undershirt Revenue (undefined), by Types 2025 & 2033
- Figure 11: South America Electronic Undershirt Revenue Share (%), by Types 2025 & 2033
- Figure 12: South America Electronic Undershirt Revenue (undefined), by Country 2025 & 2033
- Figure 13: South America Electronic Undershirt Revenue Share (%), by Country 2025 & 2033
- Figure 14: Europe Electronic Undershirt Revenue (undefined), by Application 2025 & 2033
- Figure 15: Europe Electronic Undershirt Revenue Share (%), by Application 2025 & 2033
- Figure 16: Europe Electronic Undershirt Revenue (undefined), by Types 2025 & 2033
- Figure 17: Europe Electronic Undershirt Revenue Share (%), by Types 2025 & 2033
- Figure 18: Europe Electronic Undershirt Revenue (undefined), by Country 2025 & 2033
- Figure 19: Europe Electronic Undershirt Revenue Share (%), by Country 2025 & 2033
- Figure 20: Middle East & Africa Electronic Undershirt Revenue (undefined), by Application 2025 & 2033
- Figure 21: Middle East & Africa Electronic Undershirt Revenue Share (%), by Application 2025 & 2033
- Figure 22: Middle East & Africa Electronic Undershirt Revenue (undefined), by Types 2025 & 2033
- Figure 23: Middle East & Africa Electronic Undershirt Revenue Share (%), by Types 2025 & 2033
- Figure 24: Middle East & Africa Electronic Undershirt Revenue (undefined), by Country 2025 & 2033
- Figure 25: Middle East & Africa Electronic Undershirt Revenue Share (%), by Country 2025 & 2033
- Figure 26: Asia Pacific Electronic Undershirt Revenue (undefined), by Application 2025 & 2033
- Figure 27: Asia Pacific Electronic Undershirt Revenue Share (%), by Application 2025 & 2033
- Figure 28: Asia Pacific Electronic Undershirt Revenue (undefined), by Types 2025 & 2033
- Figure 29: Asia Pacific Electronic Undershirt Revenue Share (%), by Types 2025 & 2033
- Figure 30: Asia Pacific Electronic Undershirt Revenue (undefined), by Country 2025 & 2033
- Figure 31: Asia Pacific Electronic Undershirt Revenue Share (%), by Country 2025 & 2033
List of Tables
- Table 1: Global Electronic Undershirt Revenue undefined Forecast, by Application 2020 & 2033
- Table 2: Global Electronic Undershirt Revenue undefined Forecast, by Types 2020 & 2033
- Table 3: Global Electronic Undershirt Revenue undefined Forecast, by Region 2020 & 2033
- Table 4: Global Electronic Undershirt Revenue undefined Forecast, by Application 2020 & 2033
- Table 5: Global Electronic Undershirt Revenue undefined Forecast, by Types 2020 & 2033
- Table 6: Global Electronic Undershirt Revenue undefined Forecast, by Country 2020 & 2033
- Table 7: United States Electronic Undershirt Revenue (undefined) Forecast, by Application 2020 & 2033
- Table 8: Canada Electronic Undershirt Revenue (undefined) Forecast, by Application 2020 & 2033
- Table 9: Mexico Electronic Undershirt Revenue (undefined) Forecast, by Application 2020 & 2033
- Table 10: Global Electronic Undershirt Revenue undefined Forecast, by Application 2020 & 2033
- Table 11: Global Electronic Undershirt Revenue undefined Forecast, by Types 2020 & 2033
- Table 12: Global Electronic Undershirt Revenue undefined Forecast, by Country 2020 & 2033
- Table 13: Brazil Electronic Undershirt Revenue (undefined) Forecast, by Application 2020 & 2033
- Table 14: Argentina Electronic Undershirt Revenue (undefined) Forecast, by Application 2020 & 2033
- Table 15: Rest of South America Electronic Undershirt Revenue (undefined) Forecast, by Application 2020 & 2033
- Table 16: Global Electronic Undershirt Revenue undefined Forecast, by Application 2020 & 2033
- Table 17: Global Electronic Undershirt Revenue undefined Forecast, by Types 2020 & 2033
- Table 18: Global Electronic Undershirt Revenue undefined Forecast, by Country 2020 & 2033
- Table 19: United Kingdom Electronic Undershirt Revenue (undefined) Forecast, by Application 2020 & 2033
- Table 20: Germany Electronic Undershirt Revenue (undefined) Forecast, by Application 2020 & 2033
- Table 21: France Electronic Undershirt Revenue (undefined) Forecast, by Application 2020 & 2033
- Table 22: Italy Electronic Undershirt Revenue (undefined) Forecast, by Application 2020 & 2033
- Table 23: Spain Electronic Undershirt Revenue (undefined) Forecast, by Application 2020 & 2033
- Table 24: Russia Electronic Undershirt Revenue (undefined) Forecast, by Application 2020 & 2033
- Table 25: Benelux Electronic Undershirt Revenue (undefined) Forecast, by Application 2020 & 2033
- Table 26: Nordics Electronic Undershirt Revenue (undefined) Forecast, by Application 2020 & 2033
- Table 27: Rest of Europe Electronic Undershirt Revenue (undefined) Forecast, by Application 2020 & 2033
- Table 28: Global Electronic Undershirt Revenue undefined Forecast, by Application 2020 & 2033
- Table 29: Global Electronic Undershirt Revenue undefined Forecast, by Types 2020 & 2033
- Table 30: Global Electronic Undershirt Revenue undefined Forecast, by Country 2020 & 2033
- Table 31: Turkey Electronic Undershirt Revenue (undefined) Forecast, by Application 2020 & 2033
- Table 32: Israel Electronic Undershirt Revenue (undefined) Forecast, by Application 2020 & 2033
- Table 33: GCC Electronic Undershirt Revenue (undefined) Forecast, by Application 2020 & 2033
- Table 34: North Africa Electronic Undershirt Revenue (undefined) Forecast, by Application 2020 & 2033
- Table 35: South Africa Electronic Undershirt Revenue (undefined) Forecast, by Application 2020 & 2033
- Table 36: Rest of Middle East & Africa Electronic Undershirt Revenue (undefined) Forecast, by Application 2020 & 2033
- Table 37: Global Electronic Undershirt Revenue undefined Forecast, by Application 2020 & 2033
- Table 38: Global Electronic Undershirt Revenue undefined Forecast, by Types 2020 & 2033
- Table 39: Global Electronic Undershirt Revenue undefined Forecast, by Country 2020 & 2033
- Table 40: China Electronic Undershirt Revenue (undefined) Forecast, by Application 2020 & 2033
- Table 41: India Electronic Undershirt Revenue (undefined) Forecast, by Application 2020 & 2033
- Table 42: Japan Electronic Undershirt Revenue (undefined) Forecast, by Application 2020 & 2033
- Table 43: South Korea Electronic Undershirt Revenue (undefined) Forecast, by Application 2020 & 2033
- Table 44: ASEAN Electronic Undershirt Revenue (undefined) Forecast, by Application 2020 & 2033
- Table 45: Oceania Electronic Undershirt Revenue (undefined) Forecast, by Application 2020 & 2033
- Table 46: Rest of Asia Pacific Electronic Undershirt Revenue (undefined) Forecast, by Application 2020 & 2033
Frequently Asked Questions
1. What is the projected Compound Annual Growth Rate (CAGR) of the Electronic Undershirt?
The projected CAGR is approximately 14%.
2. Which companies are prominent players in the Electronic Undershirt?
Key companies in the market include GlideWear, Rober limited, EHOB, Hill-Rom, Stryker, Apex, Skiin, Proma Reha, Besco, Graham Field, Invacare, ARDO, Victoria's Secret, Aimer, Chromat, Greenyarn, TORAY, New Textile Technologies, GUNZE LIMITED, Cyrcadia Health.
3. What are the main segments of the Electronic Undershirt?
The market segments include Application, Types.
4. Can you provide details about the market size?
The market size is estimated to be USD XXX N/A as of 2022.
5. What are some drivers contributing to market growth?
N/A
6. What are the notable trends driving market growth?
N/A
7. Are there any restraints impacting market growth?
N/A
8. Can you provide examples of recent developments in the market?
N/A
9. What pricing options are available for accessing the report?
Pricing options include single-user, multi-user, and enterprise licenses priced at USD 4900.00, USD 7350.00, and USD 9800.00 respectively.
10. Is the market size provided in terms of value or volume?
The market size is provided in terms of value, measured in N/A.
11. Are there any specific market keywords associated with the report?
Yes, the market keyword associated with the report is "Electronic Undershirt," which aids in identifying and referencing the specific market segment covered.
12. How do I determine which pricing option suits my needs best?
The pricing options vary based on user requirements and access needs. Individual users may opt for single-user licenses, while businesses requiring broader access may choose multi-user or enterprise licenses for cost-effective access to the report.
13. Are there any additional resources or data provided in the Electronic Undershirt report?
While the report offers comprehensive insights, it's advisable to review the specific contents or supplementary materials provided to ascertain if additional resources or data are available.
14. How can I stay updated on further developments or reports in the Electronic Undershirt?
To stay informed about further developments, trends, and reports in the Electronic Undershirt, consider subscribing to industry newsletters, following relevant companies and organizations, or regularly checking reputable industry news sources and publications.
Methodology
Step 1 - Identification of Relevant Samples Size from Population Database


Step 2 - Approaches for Defining Global Market Size (Value, Volume* & Price*)

Note*: In applicable scenarios
Step 3 - Data Sources
Primary Research
- Web Analytics
- Survey Reports
- Research Institute
- Latest Research Reports
- Opinion Leaders
Secondary Research
- Annual Reports
- White Paper
- Latest Press Release
- Industry Association
- Paid Database
- Investor Presentations

Step 4 - Data Triangulation
Involves using different sources of information in order to increase the validity of a study
These sources are likely to be stakeholders in a program - participants, other researchers, program staff, other community members, and so on.
Then we put all data in single framework & apply various statistical tools to find out the dynamic on the market.
During the analysis stage, feedback from the stakeholder groups would be compared to determine areas of agreement as well as areas of divergence