

Key Insights
The global Eco-Friendly Fast Food Box market is projected for robust expansion, driven by a significant shift towards sustainable packaging solutions. With an estimated market size of $200.0 billion in 2024, the industry is set to experience a Compound Annual Growth Rate (CAGR) of 6.97% over the forecast period, reaching substantial valuations by 2033. This growth is primarily fueled by increasing consumer awareness and regulatory pressures advocating for the reduction of single-use plastics. Food delivery services, a major application segment, are at the forefront of this transformation, demanding innovative and environmentally responsible packaging to align with their brand image and customer expectations. The growing preference for convenience, coupled with a conscious effort to minimize environmental impact, positions eco-friendly fast food boxes as an indispensable component of the modern food service industry. The market is witnessing a surge in demand for biodegradable, compostable, and recyclable materials, reflecting a broader commitment to a circular economy and reduced waste generation.
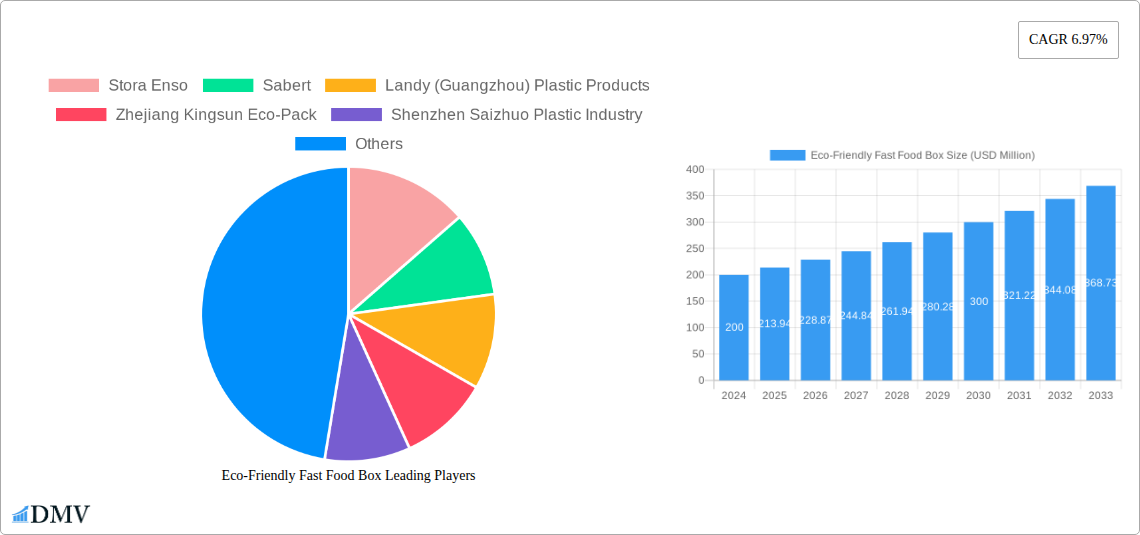
Eco-Friendly Fast Food Box Market Size (In Million)
The market's dynamism is further shaped by key trends such as the development of advanced, bio-based materials and innovative designs that enhance product protection while maintaining sustainability credentials. Transparent and non-transparent variants are catering to diverse consumer preferences and product visibility needs, with ongoing research focusing on improving barrier properties and cost-effectiveness. While the market presents considerable opportunities, certain restraints, such as the initial higher cost of some eco-friendly materials compared to conventional plastics and the need for robust end-of-life management infrastructure, are being addressed through technological advancements and policy support. Major players like Stora Enso, Sabert, and Zhejiang Kingsun Eco-Pack are actively investing in research and development, expanding production capacities, and forging strategic partnerships to meet the escalating global demand for sustainable fast food packaging. The Asia Pacific region, particularly China and India, is emerging as a significant growth engine due to its large population, rapidly expanding food service sector, and increasing environmental consciousness.
Eco-Friendly Fast Food Box Company Market Share
Eco-Friendly Fast Food Box Market Composition & Trends
The global eco-friendly fast food box market is experiencing dynamic shifts, driven by a growing conscience for environmental sustainability and escalating regulatory pressures. Market concentration, while present, is evolving with new entrants challenging established players. Innovation catalysts are primarily focused on material science advancements, seeking biodegradable and compostable alternatives to traditional plastics, alongside enhanced functionalities like leak-proof designs and improved insulation. The regulatory landscape is increasingly stringent, with bans on single-use plastics in numerous jurisdictions creating significant tailwinds for sustainable packaging solutions. Substitute products, including reusable containers and plant-based packaging materials, are gaining traction, albeit with varying cost and convenience implications for consumers and businesses. End-user profiles are diverse, encompassing quick-service restaurants (QSRs), catering services, and individual consumers prioritizing environmental impact in their purchasing decisions. Mergers and acquisitions (M&A) activities are on the rise as larger corporations seek to consolidate their positions and acquire innovative technologies. For instance, the M&A deal value in this sector is projected to reach approximately XXX billion dollars by 2033. Key market players like Stora Enso and Sabert are actively engaged in strategic acquisitions to expand their product portfolios and geographical reach.
- Market Share Distribution: Estimated to be fragmented, with the top 5 companies holding around 45% of the market share by 2025, and projected to reach 55% by 2033.
- M&A Deal Values: Projected to exceed XXX billion by 2033, indicating a significant consolidation trend.
- Innovation Focus: Biodegradability, compostability, reduced carbon footprint, and enhanced barrier properties.
- Regulatory Impact: Growing stringency in developed economies, driving demand for compliant solutions.
Eco-Friendly Fast Food Box Industry Evolution
The eco-friendly fast food box industry has witnessed a transformative evolution over the historical period of 2019–2024, catalyzed by a confluence of environmental awareness, technological innovation, and evolving consumer preferences. Beginning from a nascent stage, the market has rapidly matured, demonstrating robust growth trajectories. The base year of 2025 marks a pivotal point, with a projected compound annual growth rate (CAGR) of approximately 8.5% expected to be sustained throughout the forecast period of 2025–2033. This sustained expansion is underpinned by significant technological advancements in material science. Innovations in bioplastics, such as polylactic acid (PLA) and starch-based polymers, have significantly improved the functionality and cost-effectiveness of eco-friendly packaging. Furthermore, advancements in paper-based packaging, including improved barrier coatings and structural designs, have enhanced their performance for a wider range of food applications. Consumer demands have shifted dramatically, with a pronounced preference for sustainable and ethically sourced products. This growing consumer consciousness is a primary driver, compelling food service providers to adopt eco-friendly packaging solutions to maintain brand loyalty and appeal to a wider customer base. The industry has also seen a rise in circular economy initiatives, with increased focus on recyclability and compostability. The estimated market size for eco-friendly fast food boxes in 2025 is valued at XXX billion dollars, a substantial increase from the historical figures. By the estimated year of 2025, the market is projected to further expand, reaching approximately XXX billion dollars. The study period from 2019 to 2033 encompasses this significant growth phase, capturing the transition from initial adoption to widespread integration of sustainable packaging practices. Adoption metrics for compostable and biodegradable materials have seen a significant uptick, with an estimated XXX% increase in their use for food deliveries by 2025. The industry's commitment to reducing its environmental footprint is reflected in the development of lightweight yet durable packaging, minimizing material usage and transportation emissions. This continuous innovation and responsiveness to market demands are propelling the eco-friendly fast food box sector into a sustainable and growth-oriented future.
Leading Regions, Countries, or Segments in Eco-Friendly Fast Food Box
The Application segment of "Food Deliveries" stands as the dominant force within the global eco-friendly fast food box market. This dominance is intricately linked to the explosive growth of online food ordering platforms and the increasing reliance of consumers on convenient delivery services. The convenience factor, coupled with a growing awareness of the environmental impact of traditional single-use packaging, has propelled the demand for sustainable solutions in this segment. Regions like North America and Europe are at the forefront, driven by strong consumer demand for eco-friendly products and stringent environmental regulations. For instance, the "Food Deliveries" segment is projected to account for an estimated 60% of the total market share by 2025, expanding to approximately 65% by 2033.
Dominant Application Segment: Food Deliveries
- Key Drivers: Surge in online food ordering, consumer preference for convenience and sustainability, presence of major food delivery aggregators.
- Investment Trends: Significant investment by QSRs and delivery platforms in sustainable packaging solutions.
- Regulatory Support: Bans on single-use plastics in many countries directly benefit this segment.
- Market Size Projection: Expected to reach XXX billion dollars by 2033.
Leading Regions: North America and Europe
- Key Drivers: High disposable incomes, strong environmental consciousness among consumers, proactive government policies promoting sustainable packaging.
- Market Penetration: High adoption rates of eco-friendly packaging in foodservice establishments.
- Economic Factors: Growing economies and increasing consumer spending on convenience.
Prominent Type: Non-Transparent
- Key Drivers: Often perceived as more robust and offering better insulation for hot foods, wider material availability, and established manufacturing processes. While transparent options are growing, non-transparent materials like molded fiber and coated paperboard are currently dominant due to their versatility and cost-effectiveness in various fast-food applications.
Eco-Friendly Fast Food Box Product Innovations
Product innovation in the eco-friendly fast food box market is primarily focused on enhancing sustainability, functionality, and aesthetics. Companies are developing boxes made from renewable resources such as sugarcane bagasse, bamboo, and recycled paper pulp, offering compostable and biodegradable alternatives. Advancements in barrier coatings are improving resistance to grease and moisture, extending the shelf life of packaged food. Furthermore, innovations in structural design are leading to leak-proof and stackable boxes, enhancing convenience for both consumers and delivery personnel. The performance metrics for these new products often surpass conventional packaging in terms of biodegradability (achieving up to 90% decomposition within 90 days) and reduction in carbon footprint (up to 30% lower emissions compared to plastic alternatives). Unique selling propositions include customizable branding options and the development of compostable cutlery and lid systems that integrate seamlessly with the boxes.
Propelling Factors for Eco-Friendly Fast Food Box Growth
The eco-friendly fast food box market is experiencing robust growth, propelled by several interconnected factors. Growing consumer awareness regarding environmental pollution, particularly plastic waste, is a primary driver, leading to increased demand for sustainable packaging alternatives. Regulatory initiatives, such as single-use plastic bans and extended producer responsibility schemes implemented by governments worldwide, are compelling businesses to adopt eco-friendly solutions. Technological advancements in material science have made biodegradable and compostable packaging more affordable and functional, overcoming previous limitations. Furthermore, the corporate social responsibility (CSR) initiatives of major food chains, aiming to reduce their environmental footprint and enhance brand image, are significantly boosting market adoption.
- Increasing Consumer Environmental Consciousness: Leading to a preference for sustainable options.
- Stringent Government Regulations: Bans on single-use plastics and incentives for green packaging.
- Technological Advancements: Development of cost-effective and high-performance biodegradable materials.
- Corporate Sustainability Goals: Food companies actively seeking to reduce their environmental impact.
Obstacles in the Eco-Friendly Fast Food Box Market
Despite its strong growth trajectory, the eco-friendly fast food box market faces several obstacles. The cost of some sustainable materials can still be higher than conventional plastics, posing a challenge for price-sensitive businesses and consumers. Ensuring proper composting or recycling infrastructure is available at a scale to handle the increased volume of compostable packaging remains a significant challenge in many regions. Supply chain disruptions and the availability of raw materials for certain biodegradable plastics can also lead to price volatility and inconsistent supply. Intense competition from established non-eco-friendly packaging manufacturers and the inertia of deeply ingrained consumer habits also present hurdles to widespread adoption.
- Higher Material Costs: Compared to traditional plastic packaging.
- Inadequate Composting/Recycling Infrastructure: Limiting effective end-of-life solutions.
- Supply Chain Volatility: Affecting raw material availability and pricing.
- Consumer Inertia: Resistance to change and awareness gaps regarding proper disposal.
Future Opportunities in Eco-Friendly Fast Food Box
The future of the eco-friendly fast food box market is ripe with opportunities. The growing demand for customized and personalized packaging solutions presents a niche for innovative designs and branding. Emerging markets, particularly in Asia and Latin America, offer significant untapped potential as environmental awareness and regulatory frameworks evolve. The development of advanced bioplastics with enhanced properties, such as improved heat resistance and barrier capabilities, will open up new application areas. Furthermore, the integration of smart packaging features, including QR codes for traceability and disposal instructions, could enhance consumer engagement and facilitate circular economy initiatives. The increasing focus on circular economy models also presents opportunities for innovative collection and reprocessing systems.
- Emerging Market Expansion: Tapping into rapidly developing economies.
- Advanced Material Development: Creating next-generation biodegradable and compostable solutions.
- Smart Packaging Integration: Enhancing consumer interaction and traceability.
- Circular Economy Solutions: Developing robust collection and recycling systems.
Major Players in the Eco-Friendly Fast Food Box Ecosystem
- Stora Enso
- Sabert
- Landy (Guangzhou) Plastic Products
- Zhejiang Kingsun Eco-Pack
- Shenzhen Saizhuo Plastic Industry
- Sichuan HongChang Plastics Industrial
- Meichu
- LOCK&LOCK
- Shenzhen Heli Environmental Technology Development
Key Developments in Eco-Friendly Fast Food Box Industry
- 2023/Q4: Stora Enso launches a new range of fiber-based barrier solutions for food packaging, enhancing recyclability.
- 2024/Q1: Sabert announces its commitment to achieving 100% recyclable, compostable, or reusable packaging by 2030.
- 2024/Q2: Landy (Guangzhou) Plastic Products expands its production capacity for biodegradable PLA containers.
- 2024/Q3: Zhejiang Kingsun Eco-Pack introduces innovative compostable paper bowls for hot food applications.
- 2024/Q4: Shenzhen Saizhuo Plastic Industry invests in R&D for advanced plant-based plastic alternatives.
- 2025/Q1: Sichuan HongChang Plastics Industrial partners with a major food delivery platform to promote sustainable packaging.
- 2025/Q2: Meichu develops a new line of leak-proof, compostable food containers for takeout.
- 2025/Q3: LOCK&LOCK introduces reusable smart food containers with integrated tracking capabilities.
- 2025/Q4: Shenzhen Heli Environmental Technology Development receives significant funding to scale its biodegradable packaging solutions.
Strategic Eco-Friendly Fast Food Box Market Forecast
The strategic outlook for the eco-friendly fast food box market is exceptionally positive, driven by an unwavering global commitment to sustainability. Future growth will be fueled by continued innovation in biodegradable and compostable materials, coupled with advancements in production efficiency and cost reduction. Emerging markets will present significant expansion opportunities as environmental consciousness rises and regulatory frameworks become more robust. The increasing integration of circular economy principles, focusing on resource efficiency and waste reduction, will further shape market dynamics. Companies that prioritize technological development, strategic partnerships, and consumer education will be well-positioned to capitalize on the substantial market potential estimated to reach XXX billion dollars by 2033.
Eco-Friendly Fast Food Box Segmentation
-
1. Application
- 1.1. Food Deliveries
- 1.2. Boxed Fruits
- 1.3. Others
-
2. Types
- 2.1. Transparent
- 2.2. Non-Transparent
Eco-Friendly Fast Food Box Segmentation By Geography
-
1. North America
- 1.1. United States
- 1.2. Canada
- 1.3. Mexico
-
2. South America
- 2.1. Brazil
- 2.2. Argentina
- 2.3. Rest of South America
-
3. Europe
- 3.1. United Kingdom
- 3.2. Germany
- 3.3. France
- 3.4. Italy
- 3.5. Spain
- 3.6. Russia
- 3.7. Benelux
- 3.8. Nordics
- 3.9. Rest of Europe
-
4. Middle East & Africa
- 4.1. Turkey
- 4.2. Israel
- 4.3. GCC
- 4.4. North Africa
- 4.5. South Africa
- 4.6. Rest of Middle East & Africa
-
5. Asia Pacific
- 5.1. China
- 5.2. India
- 5.3. Japan
- 5.4. South Korea
- 5.5. ASEAN
- 5.6. Oceania
- 5.7. Rest of Asia Pacific
Eco-Friendly Fast Food Box Regional Market Share
Geographic Coverage of Eco-Friendly Fast Food Box
Eco-Friendly Fast Food Box REPORT HIGHLIGHTS
| Aspects | Details |
|---|---|
| Study Period | 2020-2034 |
| Base Year | 2025 |
| Estimated Year | 2026 |
| Forecast Period | 2026-2034 |
| Historical Period | 2020-2025 |
| Growth Rate | CAGR of 6.97% from 2020-2034 |
| Segmentation |
|
Table of Contents
- 1. Introduction
- 1.1. Research Scope
- 1.2. Market Segmentation
- 1.3. Research Objective
- 1.4. Definitions and Assumptions
- 2. Executive Summary
- 2.1. Market Snapshot
- 3. Market Dynamics
- 3.1. Market Drivers
- 3.2. Market Restrains
- 3.3. Market Trends
- 3.4. Market Opportunities
- 4. Market Factor Analysis
- 4.1. Porters Five Forces
- 4.1.1. Bargaining Power of Suppliers
- 4.1.2. Bargaining Power of Buyers
- 4.1.3. Threat of New Entrants
- 4.1.4. Threat of Substitutes
- 4.1.5. Competitive Rivalry
- 4.2. PESTEL analysis
- 4.3. BCG Analysis
- 4.3.1. Stars (High Growth, High Market Share)
- 4.3.2. Cash Cows (Low Growth, High Market Share)
- 4.3.3. Question Mark (High Growth, Low Market Share)
- 4.3.4. Dogs (Low Growth, Low Market Share)
- 4.4. Ansoff Matrix Analysis
- 4.5. Supply Chain Analysis
- 4.6. Regulatory Landscape
- 4.7. Current Market Potential and Opportunity Assessment (TAM–SAM–SOM Framework)
- 4.8. DMV Analyst Note
- 4.1. Porters Five Forces
- 5. Market Analysis, Insights and Forecast 2021-2033
- 5.1. Market Analysis, Insights and Forecast - by Application
- 5.1.1. Food Deliveries
- 5.1.2. Boxed Fruits
- 5.1.3. Others
- 5.2. Market Analysis, Insights and Forecast - by Types
- 5.2.1. Transparent
- 5.2.2. Non-Transparent
- 5.3. Market Analysis, Insights and Forecast - by Region
- 5.3.1. North America
- 5.3.2. South America
- 5.3.3. Europe
- 5.3.4. Middle East & Africa
- 5.3.5. Asia Pacific
- 5.1. Market Analysis, Insights and Forecast - by Application
- 6. Global Eco-Friendly Fast Food Box Analysis, Insights and Forecast, 2021-2033
- 6.1. Market Analysis, Insights and Forecast - by Application
- 6.1.1. Food Deliveries
- 6.1.2. Boxed Fruits
- 6.1.3. Others
- 6.2. Market Analysis, Insights and Forecast - by Types
- 6.2.1. Transparent
- 6.2.2. Non-Transparent
- 6.1. Market Analysis, Insights and Forecast - by Application
- 7. North America Eco-Friendly Fast Food Box Analysis, Insights and Forecast, 2020-2032
- 7.1. Market Analysis, Insights and Forecast - by Application
- 7.1.1. Food Deliveries
- 7.1.2. Boxed Fruits
- 7.1.3. Others
- 7.2. Market Analysis, Insights and Forecast - by Types
- 7.2.1. Transparent
- 7.2.2. Non-Transparent
- 7.1. Market Analysis, Insights and Forecast - by Application
- 8. South America Eco-Friendly Fast Food Box Analysis, Insights and Forecast, 2020-2032
- 8.1. Market Analysis, Insights and Forecast - by Application
- 8.1.1. Food Deliveries
- 8.1.2. Boxed Fruits
- 8.1.3. Others
- 8.2. Market Analysis, Insights and Forecast - by Types
- 8.2.1. Transparent
- 8.2.2. Non-Transparent
- 8.1. Market Analysis, Insights and Forecast - by Application
- 9. Europe Eco-Friendly Fast Food Box Analysis, Insights and Forecast, 2020-2032
- 9.1. Market Analysis, Insights and Forecast - by Application
- 9.1.1. Food Deliveries
- 9.1.2. Boxed Fruits
- 9.1.3. Others
- 9.2. Market Analysis, Insights and Forecast - by Types
- 9.2.1. Transparent
- 9.2.2. Non-Transparent
- 9.1. Market Analysis, Insights and Forecast - by Application
- 10. Middle East & Africa Eco-Friendly Fast Food Box Analysis, Insights and Forecast, 2020-2032
- 10.1. Market Analysis, Insights and Forecast - by Application
- 10.1.1. Food Deliveries
- 10.1.2. Boxed Fruits
- 10.1.3. Others
- 10.2. Market Analysis, Insights and Forecast - by Types
- 10.2.1. Transparent
- 10.2.2. Non-Transparent
- 10.1. Market Analysis, Insights and Forecast - by Application
- 11. Asia Pacific Eco-Friendly Fast Food Box Analysis, Insights and Forecast, 2020-2032
- 11.1. Market Analysis, Insights and Forecast - by Application
- 11.1.1. Food Deliveries
- 11.1.2. Boxed Fruits
- 11.1.3. Others
- 11.2. Market Analysis, Insights and Forecast - by Types
- 11.2.1. Transparent
- 11.2.2. Non-Transparent
- 11.1. Market Analysis, Insights and Forecast - by Application
- 12. Competitive Analysis
- 12.1. Company Profiles
- 12.1.1 Stora Enso
- 12.1.1.1. Company Overview
- 12.1.1.2. Products
- 12.1.1.3. Company Financials
- 12.1.1.4. SWOT Analysis
- 12.1.2 Sabert
- 12.1.2.1. Company Overview
- 12.1.2.2. Products
- 12.1.2.3. Company Financials
- 12.1.2.4. SWOT Analysis
- 12.1.3 Landy (Guangzhou) Plastic Products
- 12.1.3.1. Company Overview
- 12.1.3.2. Products
- 12.1.3.3. Company Financials
- 12.1.3.4. SWOT Analysis
- 12.1.4 Zhejiang Kingsun Eco-Pack
- 12.1.4.1. Company Overview
- 12.1.4.2. Products
- 12.1.4.3. Company Financials
- 12.1.4.4. SWOT Analysis
- 12.1.5 Shenzhen Saizhuo Plastic Industry
- 12.1.5.1. Company Overview
- 12.1.5.2. Products
- 12.1.5.3. Company Financials
- 12.1.5.4. SWOT Analysis
- 12.1.6 Sichuan HongChang Plastics Industrial
- 12.1.6.1. Company Overview
- 12.1.6.2. Products
- 12.1.6.3. Company Financials
- 12.1.6.4. SWOT Analysis
- 12.1.7 Meichu
- 12.1.7.1. Company Overview
- 12.1.7.2. Products
- 12.1.7.3. Company Financials
- 12.1.7.4. SWOT Analysis
- 12.1.8 LOCK&LOCK
- 12.1.8.1. Company Overview
- 12.1.8.2. Products
- 12.1.8.3. Company Financials
- 12.1.8.4. SWOT Analysis
- 12.1.9 Shenzhen Heli Environmental Technology Development
- 12.1.9.1. Company Overview
- 12.1.9.2. Products
- 12.1.9.3. Company Financials
- 12.1.9.4. SWOT Analysis
- 12.1.1 Stora Enso
- 12.2. Market Entropy
- 12.2.1 Company's Key Areas Served
- 12.2.2 Recent Developments
- 12.3. Company Market Share Analysis 2025
- 12.3.1 Top 5 Companies Market Share Analysis
- 12.3.2 Top 3 Companies Market Share Analysis
- 12.4. List of Potential Customers
- 13. Research Methodology
List of Figures
- Figure 1: Global Eco-Friendly Fast Food Box Revenue Breakdown (undefined, %) by Region 2025 & 2033
- Figure 2: Global Eco-Friendly Fast Food Box Volume Breakdown (K, %) by Region 2025 & 2033
- Figure 3: North America Eco-Friendly Fast Food Box Revenue (undefined), by Application 2025 & 2033
- Figure 4: North America Eco-Friendly Fast Food Box Volume (K), by Application 2025 & 2033
- Figure 5: North America Eco-Friendly Fast Food Box Revenue Share (%), by Application 2025 & 2033
- Figure 6: North America Eco-Friendly Fast Food Box Volume Share (%), by Application 2025 & 2033
- Figure 7: North America Eco-Friendly Fast Food Box Revenue (undefined), by Types 2025 & 2033
- Figure 8: North America Eco-Friendly Fast Food Box Volume (K), by Types 2025 & 2033
- Figure 9: North America Eco-Friendly Fast Food Box Revenue Share (%), by Types 2025 & 2033
- Figure 10: North America Eco-Friendly Fast Food Box Volume Share (%), by Types 2025 & 2033
- Figure 11: North America Eco-Friendly Fast Food Box Revenue (undefined), by Country 2025 & 2033
- Figure 12: North America Eco-Friendly Fast Food Box Volume (K), by Country 2025 & 2033
- Figure 13: North America Eco-Friendly Fast Food Box Revenue Share (%), by Country 2025 & 2033
- Figure 14: North America Eco-Friendly Fast Food Box Volume Share (%), by Country 2025 & 2033
- Figure 15: South America Eco-Friendly Fast Food Box Revenue (undefined), by Application 2025 & 2033
- Figure 16: South America Eco-Friendly Fast Food Box Volume (K), by Application 2025 & 2033
- Figure 17: South America Eco-Friendly Fast Food Box Revenue Share (%), by Application 2025 & 2033
- Figure 18: South America Eco-Friendly Fast Food Box Volume Share (%), by Application 2025 & 2033
- Figure 19: South America Eco-Friendly Fast Food Box Revenue (undefined), by Types 2025 & 2033
- Figure 20: South America Eco-Friendly Fast Food Box Volume (K), by Types 2025 & 2033
- Figure 21: South America Eco-Friendly Fast Food Box Revenue Share (%), by Types 2025 & 2033
- Figure 22: South America Eco-Friendly Fast Food Box Volume Share (%), by Types 2025 & 2033
- Figure 23: South America Eco-Friendly Fast Food Box Revenue (undefined), by Country 2025 & 2033
- Figure 24: South America Eco-Friendly Fast Food Box Volume (K), by Country 2025 & 2033
- Figure 25: South America Eco-Friendly Fast Food Box Revenue Share (%), by Country 2025 & 2033
- Figure 26: South America Eco-Friendly Fast Food Box Volume Share (%), by Country 2025 & 2033
- Figure 27: Europe Eco-Friendly Fast Food Box Revenue (undefined), by Application 2025 & 2033
- Figure 28: Europe Eco-Friendly Fast Food Box Volume (K), by Application 2025 & 2033
- Figure 29: Europe Eco-Friendly Fast Food Box Revenue Share (%), by Application 2025 & 2033
- Figure 30: Europe Eco-Friendly Fast Food Box Volume Share (%), by Application 2025 & 2033
- Figure 31: Europe Eco-Friendly Fast Food Box Revenue (undefined), by Types 2025 & 2033
- Figure 32: Europe Eco-Friendly Fast Food Box Volume (K), by Types 2025 & 2033
- Figure 33: Europe Eco-Friendly Fast Food Box Revenue Share (%), by Types 2025 & 2033
- Figure 34: Europe Eco-Friendly Fast Food Box Volume Share (%), by Types 2025 & 2033
- Figure 35: Europe Eco-Friendly Fast Food Box Revenue (undefined), by Country 2025 & 2033
- Figure 36: Europe Eco-Friendly Fast Food Box Volume (K), by Country 2025 & 2033
- Figure 37: Europe Eco-Friendly Fast Food Box Revenue Share (%), by Country 2025 & 2033
- Figure 38: Europe Eco-Friendly Fast Food Box Volume Share (%), by Country 2025 & 2033
- Figure 39: Middle East & Africa Eco-Friendly Fast Food Box Revenue (undefined), by Application 2025 & 2033
- Figure 40: Middle East & Africa Eco-Friendly Fast Food Box Volume (K), by Application 2025 & 2033
- Figure 41: Middle East & Africa Eco-Friendly Fast Food Box Revenue Share (%), by Application 2025 & 2033
- Figure 42: Middle East & Africa Eco-Friendly Fast Food Box Volume Share (%), by Application 2025 & 2033
- Figure 43: Middle East & Africa Eco-Friendly Fast Food Box Revenue (undefined), by Types 2025 & 2033
- Figure 44: Middle East & Africa Eco-Friendly Fast Food Box Volume (K), by Types 2025 & 2033
- Figure 45: Middle East & Africa Eco-Friendly Fast Food Box Revenue Share (%), by Types 2025 & 2033
- Figure 46: Middle East & Africa Eco-Friendly Fast Food Box Volume Share (%), by Types 2025 & 2033
- Figure 47: Middle East & Africa Eco-Friendly Fast Food Box Revenue (undefined), by Country 2025 & 2033
- Figure 48: Middle East & Africa Eco-Friendly Fast Food Box Volume (K), by Country 2025 & 2033
- Figure 49: Middle East & Africa Eco-Friendly Fast Food Box Revenue Share (%), by Country 2025 & 2033
- Figure 50: Middle East & Africa Eco-Friendly Fast Food Box Volume Share (%), by Country 2025 & 2033
- Figure 51: Asia Pacific Eco-Friendly Fast Food Box Revenue (undefined), by Application 2025 & 2033
- Figure 52: Asia Pacific Eco-Friendly Fast Food Box Volume (K), by Application 2025 & 2033
- Figure 53: Asia Pacific Eco-Friendly Fast Food Box Revenue Share (%), by Application 2025 & 2033
- Figure 54: Asia Pacific Eco-Friendly Fast Food Box Volume Share (%), by Application 2025 & 2033
- Figure 55: Asia Pacific Eco-Friendly Fast Food Box Revenue (undefined), by Types 2025 & 2033
- Figure 56: Asia Pacific Eco-Friendly Fast Food Box Volume (K), by Types 2025 & 2033
- Figure 57: Asia Pacific Eco-Friendly Fast Food Box Revenue Share (%), by Types 2025 & 2033
- Figure 58: Asia Pacific Eco-Friendly Fast Food Box Volume Share (%), by Types 2025 & 2033
- Figure 59: Asia Pacific Eco-Friendly Fast Food Box Revenue (undefined), by Country 2025 & 2033
- Figure 60: Asia Pacific Eco-Friendly Fast Food Box Volume (K), by Country 2025 & 2033
- Figure 61: Asia Pacific Eco-Friendly Fast Food Box Revenue Share (%), by Country 2025 & 2033
- Figure 62: Asia Pacific Eco-Friendly Fast Food Box Volume Share (%), by Country 2025 & 2033
List of Tables
- Table 1: Global Eco-Friendly Fast Food Box Revenue undefined Forecast, by Application 2020 & 2033
- Table 2: Global Eco-Friendly Fast Food Box Volume K Forecast, by Application 2020 & 2033
- Table 3: Global Eco-Friendly Fast Food Box Revenue undefined Forecast, by Types 2020 & 2033
- Table 4: Global Eco-Friendly Fast Food Box Volume K Forecast, by Types 2020 & 2033
- Table 5: Global Eco-Friendly Fast Food Box Revenue undefined Forecast, by Region 2020 & 2033
- Table 6: Global Eco-Friendly Fast Food Box Volume K Forecast, by Region 2020 & 2033
- Table 7: Global Eco-Friendly Fast Food Box Revenue undefined Forecast, by Application 2020 & 2033
- Table 8: Global Eco-Friendly Fast Food Box Volume K Forecast, by Application 2020 & 2033
- Table 9: Global Eco-Friendly Fast Food Box Revenue undefined Forecast, by Types 2020 & 2033
- Table 10: Global Eco-Friendly Fast Food Box Volume K Forecast, by Types 2020 & 2033
- Table 11: Global Eco-Friendly Fast Food Box Revenue undefined Forecast, by Country 2020 & 2033
- Table 12: Global Eco-Friendly Fast Food Box Volume K Forecast, by Country 2020 & 2033
- Table 13: United States Eco-Friendly Fast Food Box Revenue (undefined) Forecast, by Application 2020 & 2033
- Table 14: United States Eco-Friendly Fast Food Box Volume (K) Forecast, by Application 2020 & 2033
- Table 15: Canada Eco-Friendly Fast Food Box Revenue (undefined) Forecast, by Application 2020 & 2033
- Table 16: Canada Eco-Friendly Fast Food Box Volume (K) Forecast, by Application 2020 & 2033
- Table 17: Mexico Eco-Friendly Fast Food Box Revenue (undefined) Forecast, by Application 2020 & 2033
- Table 18: Mexico Eco-Friendly Fast Food Box Volume (K) Forecast, by Application 2020 & 2033
- Table 19: Global Eco-Friendly Fast Food Box Revenue undefined Forecast, by Application 2020 & 2033
- Table 20: Global Eco-Friendly Fast Food Box Volume K Forecast, by Application 2020 & 2033
- Table 21: Global Eco-Friendly Fast Food Box Revenue undefined Forecast, by Types 2020 & 2033
- Table 22: Global Eco-Friendly Fast Food Box Volume K Forecast, by Types 2020 & 2033
- Table 23: Global Eco-Friendly Fast Food Box Revenue undefined Forecast, by Country 2020 & 2033
- Table 24: Global Eco-Friendly Fast Food Box Volume K Forecast, by Country 2020 & 2033
- Table 25: Brazil Eco-Friendly Fast Food Box Revenue (undefined) Forecast, by Application 2020 & 2033
- Table 26: Brazil Eco-Friendly Fast Food Box Volume (K) Forecast, by Application 2020 & 2033
- Table 27: Argentina Eco-Friendly Fast Food Box Revenue (undefined) Forecast, by Application 2020 & 2033
- Table 28: Argentina Eco-Friendly Fast Food Box Volume (K) Forecast, by Application 2020 & 2033
- Table 29: Rest of South America Eco-Friendly Fast Food Box Revenue (undefined) Forecast, by Application 2020 & 2033
- Table 30: Rest of South America Eco-Friendly Fast Food Box Volume (K) Forecast, by Application 2020 & 2033
- Table 31: Global Eco-Friendly Fast Food Box Revenue undefined Forecast, by Application 2020 & 2033
- Table 32: Global Eco-Friendly Fast Food Box Volume K Forecast, by Application 2020 & 2033
- Table 33: Global Eco-Friendly Fast Food Box Revenue undefined Forecast, by Types 2020 & 2033
- Table 34: Global Eco-Friendly Fast Food Box Volume K Forecast, by Types 2020 & 2033
- Table 35: Global Eco-Friendly Fast Food Box Revenue undefined Forecast, by Country 2020 & 2033
- Table 36: Global Eco-Friendly Fast Food Box Volume K Forecast, by Country 2020 & 2033
- Table 37: United Kingdom Eco-Friendly Fast Food Box Revenue (undefined) Forecast, by Application 2020 & 2033
- Table 38: United Kingdom Eco-Friendly Fast Food Box Volume (K) Forecast, by Application 2020 & 2033
- Table 39: Germany Eco-Friendly Fast Food Box Revenue (undefined) Forecast, by Application 2020 & 2033
- Table 40: Germany Eco-Friendly Fast Food Box Volume (K) Forecast, by Application 2020 & 2033
- Table 41: France Eco-Friendly Fast Food Box Revenue (undefined) Forecast, by Application 2020 & 2033
- Table 42: France Eco-Friendly Fast Food Box Volume (K) Forecast, by Application 2020 & 2033
- Table 43: Italy Eco-Friendly Fast Food Box Revenue (undefined) Forecast, by Application 2020 & 2033
- Table 44: Italy Eco-Friendly Fast Food Box Volume (K) Forecast, by Application 2020 & 2033
- Table 45: Spain Eco-Friendly Fast Food Box Revenue (undefined) Forecast, by Application 2020 & 2033
- Table 46: Spain Eco-Friendly Fast Food Box Volume (K) Forecast, by Application 2020 & 2033
- Table 47: Russia Eco-Friendly Fast Food Box Revenue (undefined) Forecast, by Application 2020 & 2033
- Table 48: Russia Eco-Friendly Fast Food Box Volume (K) Forecast, by Application 2020 & 2033
- Table 49: Benelux Eco-Friendly Fast Food Box Revenue (undefined) Forecast, by Application 2020 & 2033
- Table 50: Benelux Eco-Friendly Fast Food Box Volume (K) Forecast, by Application 2020 & 2033
- Table 51: Nordics Eco-Friendly Fast Food Box Revenue (undefined) Forecast, by Application 2020 & 2033
- Table 52: Nordics Eco-Friendly Fast Food Box Volume (K) Forecast, by Application 2020 & 2033
- Table 53: Rest of Europe Eco-Friendly Fast Food Box Revenue (undefined) Forecast, by Application 2020 & 2033
- Table 54: Rest of Europe Eco-Friendly Fast Food Box Volume (K) Forecast, by Application 2020 & 2033
- Table 55: Global Eco-Friendly Fast Food Box Revenue undefined Forecast, by Application 2020 & 2033
- Table 56: Global Eco-Friendly Fast Food Box Volume K Forecast, by Application 2020 & 2033
- Table 57: Global Eco-Friendly Fast Food Box Revenue undefined Forecast, by Types 2020 & 2033
- Table 58: Global Eco-Friendly Fast Food Box Volume K Forecast, by Types 2020 & 2033
- Table 59: Global Eco-Friendly Fast Food Box Revenue undefined Forecast, by Country 2020 & 2033
- Table 60: Global Eco-Friendly Fast Food Box Volume K Forecast, by Country 2020 & 2033
- Table 61: Turkey Eco-Friendly Fast Food Box Revenue (undefined) Forecast, by Application 2020 & 2033
- Table 62: Turkey Eco-Friendly Fast Food Box Volume (K) Forecast, by Application 2020 & 2033
- Table 63: Israel Eco-Friendly Fast Food Box Revenue (undefined) Forecast, by Application 2020 & 2033
- Table 64: Israel Eco-Friendly Fast Food Box Volume (K) Forecast, by Application 2020 & 2033
- Table 65: GCC Eco-Friendly Fast Food Box Revenue (undefined) Forecast, by Application 2020 & 2033
- Table 66: GCC Eco-Friendly Fast Food Box Volume (K) Forecast, by Application 2020 & 2033
- Table 67: North Africa Eco-Friendly Fast Food Box Revenue (undefined) Forecast, by Application 2020 & 2033
- Table 68: North Africa Eco-Friendly Fast Food Box Volume (K) Forecast, by Application 2020 & 2033
- Table 69: South Africa Eco-Friendly Fast Food Box Revenue (undefined) Forecast, by Application 2020 & 2033
- Table 70: South Africa Eco-Friendly Fast Food Box Volume (K) Forecast, by Application 2020 & 2033
- Table 71: Rest of Middle East & Africa Eco-Friendly Fast Food Box Revenue (undefined) Forecast, by Application 2020 & 2033
- Table 72: Rest of Middle East & Africa Eco-Friendly Fast Food Box Volume (K) Forecast, by Application 2020 & 2033
- Table 73: Global Eco-Friendly Fast Food Box Revenue undefined Forecast, by Application 2020 & 2033
- Table 74: Global Eco-Friendly Fast Food Box Volume K Forecast, by Application 2020 & 2033
- Table 75: Global Eco-Friendly Fast Food Box Revenue undefined Forecast, by Types 2020 & 2033
- Table 76: Global Eco-Friendly Fast Food Box Volume K Forecast, by Types 2020 & 2033
- Table 77: Global Eco-Friendly Fast Food Box Revenue undefined Forecast, by Country 2020 & 2033
- Table 78: Global Eco-Friendly Fast Food Box Volume K Forecast, by Country 2020 & 2033
- Table 79: China Eco-Friendly Fast Food Box Revenue (undefined) Forecast, by Application 2020 & 2033
- Table 80: China Eco-Friendly Fast Food Box Volume (K) Forecast, by Application 2020 & 2033
- Table 81: India Eco-Friendly Fast Food Box Revenue (undefined) Forecast, by Application 2020 & 2033
- Table 82: India Eco-Friendly Fast Food Box Volume (K) Forecast, by Application 2020 & 2033
- Table 83: Japan Eco-Friendly Fast Food Box Revenue (undefined) Forecast, by Application 2020 & 2033
- Table 84: Japan Eco-Friendly Fast Food Box Volume (K) Forecast, by Application 2020 & 2033
- Table 85: South Korea Eco-Friendly Fast Food Box Revenue (undefined) Forecast, by Application 2020 & 2033
- Table 86: South Korea Eco-Friendly Fast Food Box Volume (K) Forecast, by Application 2020 & 2033
- Table 87: ASEAN Eco-Friendly Fast Food Box Revenue (undefined) Forecast, by Application 2020 & 2033
- Table 88: ASEAN Eco-Friendly Fast Food Box Volume (K) Forecast, by Application 2020 & 2033
- Table 89: Oceania Eco-Friendly Fast Food Box Revenue (undefined) Forecast, by Application 2020 & 2033
- Table 90: Oceania Eco-Friendly Fast Food Box Volume (K) Forecast, by Application 2020 & 2033
- Table 91: Rest of Asia Pacific Eco-Friendly Fast Food Box Revenue (undefined) Forecast, by Application 2020 & 2033
- Table 92: Rest of Asia Pacific Eco-Friendly Fast Food Box Volume (K) Forecast, by Application 2020 & 2033
Frequently Asked Questions
1. What is the projected Compound Annual Growth Rate (CAGR) of the Eco-Friendly Fast Food Box?
The projected CAGR is approximately 6.97%.
2. Which companies are prominent players in the Eco-Friendly Fast Food Box?
Key companies in the market include Stora Enso, Sabert, Landy (Guangzhou) Plastic Products, Zhejiang Kingsun Eco-Pack, Shenzhen Saizhuo Plastic Industry, Sichuan HongChang Plastics Industrial, Meichu, LOCK&LOCK, Shenzhen Heli Environmental Technology Development.
3. What are the main segments of the Eco-Friendly Fast Food Box?
The market segments include Application, Types.
4. Can you provide details about the market size?
The market size is estimated to be USD XXX N/A as of 2022.
5. What are some drivers contributing to market growth?
N/A
6. What are the notable trends driving market growth?
N/A
7. Are there any restraints impacting market growth?
N/A
8. Can you provide examples of recent developments in the market?
N/A
9. What pricing options are available for accessing the report?
Pricing options include single-user, multi-user, and enterprise licenses priced at USD 4350.00, USD 6525.00, and USD 8700.00 respectively.
10. Is the market size provided in terms of value or volume?
The market size is provided in terms of value, measured in N/A and volume, measured in K.
11. Are there any specific market keywords associated with the report?
Yes, the market keyword associated with the report is "Eco-Friendly Fast Food Box," which aids in identifying and referencing the specific market segment covered.
12. How do I determine which pricing option suits my needs best?
The pricing options vary based on user requirements and access needs. Individual users may opt for single-user licenses, while businesses requiring broader access may choose multi-user or enterprise licenses for cost-effective access to the report.
13. Are there any additional resources or data provided in the Eco-Friendly Fast Food Box report?
While the report offers comprehensive insights, it's advisable to review the specific contents or supplementary materials provided to ascertain if additional resources or data are available.
14. How can I stay updated on further developments or reports in the Eco-Friendly Fast Food Box?
To stay informed about further developments, trends, and reports in the Eco-Friendly Fast Food Box, consider subscribing to industry newsletters, following relevant companies and organizations, or regularly checking reputable industry news sources and publications.
Methodology
Step 1 - Identification of Relevant Samples Size from Population Database


Step 2 - Approaches for Defining Global Market Size (Value, Volume* & Price*)

Note*: In applicable scenarios
Step 3 - Data Sources
Primary Research
- Web Analytics
- Survey Reports
- Research Institute
- Latest Research Reports
- Opinion Leaders
Secondary Research
- Annual Reports
- White Paper
- Latest Press Release
- Industry Association
- Paid Database
- Investor Presentations

Step 4 - Data Triangulation
Involves using different sources of information in order to increase the validity of a study
These sources are likely to be stakeholders in a program - participants, other researchers, program staff, other community members, and so on.
Then we put all data in single framework & apply various statistical tools to find out the dynamic on the market.
During the analysis stage, feedback from the stakeholder groups would be compared to determine areas of agreement as well as areas of divergence