

Key Insights
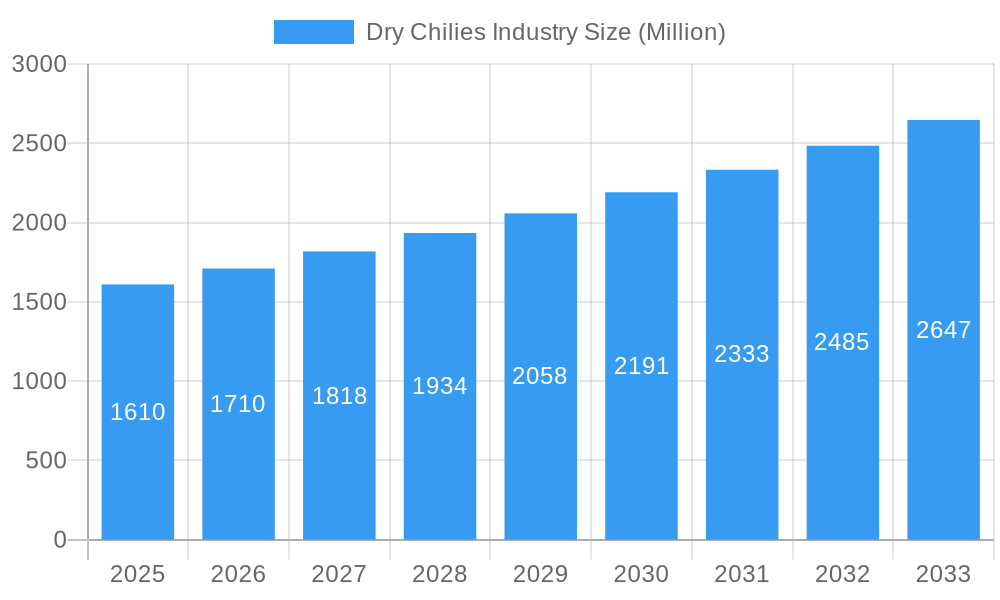
The global dry chilies market, valued at $1.61 billion in 2025, is projected to experience robust growth, driven by a Compound Annual Growth Rate (CAGR) of 6.11% from 2025 to 2033. This expansion is fueled by several key factors. Increasing demand for chili peppers in diverse culinary applications across the globe, particularly in food and beverage products, is a primary driver. The growing popularity of spicy food, both in traditional cuisines and fusion dishes, significantly boosts consumption. Furthermore, the use of chili extracts in pharmaceuticals, cosmetics, and even pesticides is contributing to market growth. The rising health consciousness among consumers, coupled with the recognized health benefits of capsaicin (the compound that gives chilies their heat), is another factor driving demand for dry chilies. Finally, innovations in processing and packaging techniques are improving product shelf-life and quality, further enhancing market appeal.
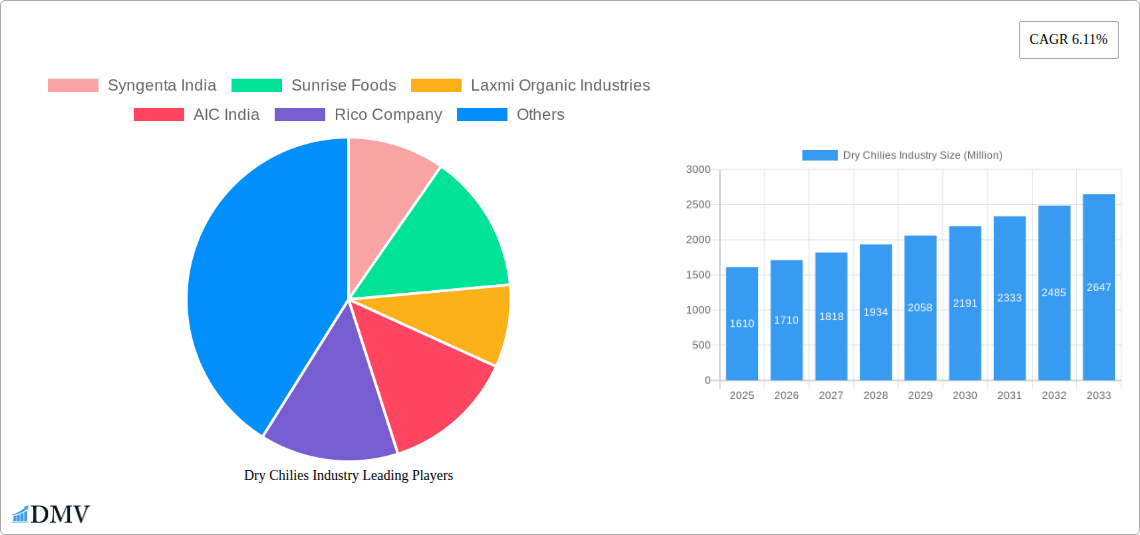
Dry Chilies Industry Market Size (In Billion)
However, the market's growth trajectory is not without its challenges. Climate change poses a significant threat, impacting chili pepper yields and leading to price fluctuations. Supply chain disruptions, particularly in transportation and logistics, also present obstacles. Furthermore, competition from other spice varieties and the availability of substitutes could potentially impede market expansion in certain segments. Despite these restraints, the versatility of dry chilies across various applications, coupled with the rising global population and changing dietary habits, suggests a positive outlook for continued market growth throughout the forecast period. Regional variations are also expected, with regions like Asia-Pacific and North America expected to lead market share owing to high consumption rates and expanding food processing industries.
Dry Chilies Industry Company Market Share
Dry Chilies Industry: A Comprehensive Market Report (2019-2033)
This insightful report provides a detailed analysis of the global dry chilies industry, offering valuable insights for stakeholders seeking to navigate this dynamic market. With a study period spanning 2019-2033, a base year of 2025, and a forecast period of 2025-2033, this report leverages historical data (2019-2024) and incorporates current market trends to project future growth. The report covers key product types (Guajillo, Ancho, Chipotle, Pasilla, California Chili), applications (food and beverage, pharmaceuticals, cosmetics, pesticides), and major players including Syngenta India, Sunrise Foods, Laxmi Organic Industries, AIC India, and Rico Company. The market is projected to reach xx Million by 2033.
Dry Chilies Industry Market Composition & Trends
This section delves into the competitive landscape of the dry chilies market, analyzing market concentration, innovation drivers, regulatory frameworks, substitute products, end-user profiles, and mergers & acquisitions (M&A) activities. The report assesses the market share distribution among key players, revealing the dominance of specific companies and outlining strategic partnerships and acquisitions. Data on M&A deal values will provide insights into investment trends and market consolidation. The analysis includes:
- Market Concentration: A detailed examination of the market's competitive intensity, highlighting the presence of dominant players and the level of fragmentation. The Herfindahl-Hirschman Index (HHI) or similar metrics will be used to quantify market concentration. xx% of the market is controlled by the top 5 players.
- Innovation Catalysts: Identification of key technological advancements and their impact on production efficiency, product quality, and market expansion. Specific examples of innovative processing techniques and product development will be showcased.
- Regulatory Landscape: An overview of global and regional regulations governing the production, processing, and trade of dry chilies, including food safety standards and labeling requirements. This section will also address the impact of these regulations on market dynamics.
- Substitute Products: Analysis of potential substitute products and their impact on the dry chilies market, focusing on factors like price competitiveness and functional equivalence.
- End-User Profiles: A comprehensive profile of end-users across various applications, highlighting their preferences, purchasing behavior, and overall impact on market demand. Segmentation by application will be detailed, with market size projections for each.
- M&A Activities: A review of recent M&A activities in the dry chilies industry, including deal values and their strategic implications for market consolidation and competitiveness. For example, the impact of potential acquisitions on market share distribution will be assessed.
Dry Chilies Industry Industry Evolution
This section provides a comprehensive analysis of the dry chilies industry's growth trajectory, encompassing technological advancements and evolving consumer demands. Historical data from 2019-2024 will be utilized to establish growth trends, and these trends will be extrapolated to forecast market growth until 2033. The report will assess the adoption rate of new technologies and their effects on production, processing, and distribution efficiency. Factors like changes in consumer preferences toward organic and sustainably produced chilies will also be analyzed. The section will include:
- Market Growth Trajectories: Analysis of historical and projected market growth rates, considering factors such as population growth, changing consumption patterns, and economic conditions. The Compound Annual Growth Rate (CAGR) will be calculated and presented.
- Technological Advancements: Examination of innovations in chili cultivation, processing, and packaging, focusing on their impact on production efficiency, product quality, and market competitiveness. Examples of specific technological advancements like precision agriculture techniques will be highlighted.
- Shifting Consumer Demands: A deep dive into the evolving preferences of consumers, examining trends toward specific chili varieties, organic options, and sustainably sourced products. The impact of these demands on market segmentation and pricing will be discussed.
Leading Regions, Countries, or Segments in Dry Chilies Industry
This section identifies the leading regions, countries, and segments within the dry chilies industry. Focusing on key product types (Guajillo, Ancho, Chipotle, Pasilla, California Chili) and applications (Food and beverage industry, Pharmaceuticals, Cosmetics, Pesticides), it will pinpoint the dominant areas and analyze the drivers behind their success.
Dominant Region/Country: The report will identify the leading geographic region or country, supported by detailed market share data and an in-depth analysis of contributing factors. xx is currently the leading region with a market share of xx%.
Key Drivers (Bullet Points):
- Investment Trends: Analysis of investment patterns in chili production and processing within the dominant region(s).
- Regulatory Support: Examination of governmental policies and regulations that foster industry growth in specific locations.
- Favorable Climatic Conditions: Assessment of the impact of climate and geographical factors on chili cultivation.
- Access to Resources: Analysis of the availability of land, labor, and other resources needed for chili production.
- Established Supply Chains: Evaluation of the efficiency and robustness of existing supply chain networks.
Dry Chilies Industry Product Innovations
This section will showcase recent product innovations, their applications, and key performance indicators (KPIs). It will highlight unique selling propositions (USPs) of innovative products and detail advancements in processing and packaging technologies. The report will focus on the introduction of new chili varieties with improved flavor profiles, higher yields, and enhanced resistance to diseases. Innovations in drying techniques and packaging to maintain product quality will also be highlighted.
Propelling Factors for Dry Chilies Industry Growth
This section identifies key growth drivers, focusing on technological, economic, and regulatory influences. The increasing demand for chilies in diverse applications (food, pharmaceuticals, cosmetics) will be examined, along with the role of government support and favorable economic conditions. Technological advancements, such as improved farming practices and processing techniques, will be discussed for their contribution to increased yields and reduced production costs.
Obstacles in the Dry Chilies Industry Market
This section addresses the challenges faced by the dry chilies industry, including regulatory hurdles, supply chain disruptions, and competitive pressures. The impacts of these challenges on market growth will be quantified using data on production losses, increased costs, and reduced market share. Examples include weather-related yield fluctuations, geopolitical instability affecting trade, and the entrance of new competitors.
Future Opportunities in Dry Chilies Industry
This section highlights future opportunities for growth, focusing on emerging markets, innovative technologies, and evolving consumer trends. The expansion into new geographical regions with high chili consumption potential will be discussed, along with the application of advanced technologies such as precision agriculture and automation. The shift in consumer demand towards organic and sustainably sourced chilies will also be explored as a major opportunity.
Major Players in the Dry Chilies Industry Ecosystem
- Syngenta India
- Sunrise Foods
- Laxmi Organic Industries
- AIC India
- Rico Company
Key Developments in Dry Chilies Industry Industry
- June 2022: Syngenta India partnered with the Agriculture Insurance Company of India (AIC) to protect farmers from price fluctuations. This initiative bolstered farmer confidence and supported stable chili production.
- November 2022: The Indonesian government implemented strategic policies to boost domestic chili production, including improved farming infrastructure, hybrid seeds, and better fertilization techniques. This significantly reduced reliance on imports and stimulated domestic growth.
Strategic Dry Chilies Industry Market Forecast
This section summarizes the growth catalysts identified in the report, emphasizing future opportunities and the overall market potential. The report predicts substantial growth in the dry chilies market driven by increasing demand, technological advancements, and favorable regulatory environments. The forecast considers factors such as evolving consumer preferences, expanding applications, and the potential for innovation within the industry. The market is poised for significant expansion in the coming years, presenting lucrative opportunities for investors and industry players.
Dry Chilies Industry Segmentation
- 1. Production Analysis
- 2. Consumption Analysis
- 3. Import Market Analysis (Value & Volume)
- 4. Export Market Analysis (Value & Volume)
- 5. Price Trend Analysis
Dry Chilies Industry Segmentation By Geography
-
1. North America
- 1.1. United States
- 1.2. Canada
- 1.3. Mexico
-
2. Europe
- 2.1. United Kingdom
- 2.2. Germany
- 2.3. France
- 2.4. Spain
-
3. Asia Pacific
- 3.1. China
- 3.2. Australia
- 3.3. India
-
4. South America
- 4.1. Brazil
- 4.2. Argentina
-
5. Africa
- 5.1. South Africa
- 5.2. Egypt
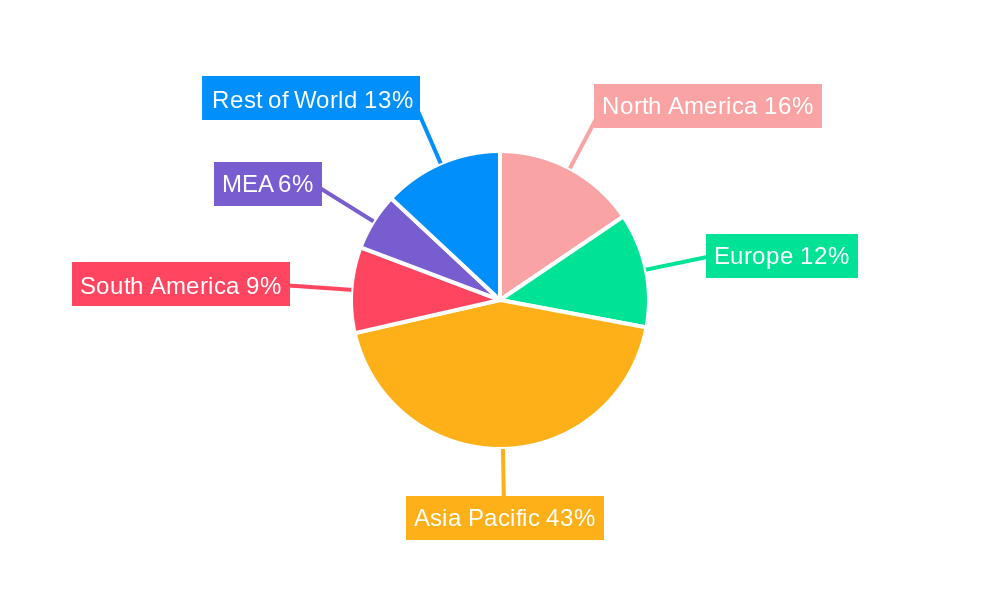
Dry Chilies Industry Regional Market Share
Geographic Coverage of Dry Chilies Industry
Dry Chilies Industry REPORT HIGHLIGHTS
| Aspects | Details |
|---|---|
| Study Period | 2020-2034 |
| Base Year | 2025 |
| Estimated Year | 2026 |
| Forecast Period | 2026-2034 |
| Historical Period | 2020-2025 |
| Growth Rate | CAGR of 6.11% from 2020-2034 |
| Segmentation |
|
Table of Contents
- 1. Introduction
- 1.1. Research Scope
- 1.2. Market Segmentation
- 1.3. Research Objective
- 1.4. Definitions and Assumptions
- 2. Executive Summary
- 2.1. Market Snapshot
- 3. Market Dynamics
- 3.1. Market Drivers
- 3.2. Market Restrains
- 3.3. Market Trends
- 3.4. Market Opportunities
- 4. Market Factor Analysis
- 4.1. Porters Five Forces
- 4.1.1. Bargaining Power of Suppliers
- 4.1.2. Bargaining Power of Buyers
- 4.1.3. Threat of New Entrants
- 4.1.4. Threat of Substitutes
- 4.1.5. Competitive Rivalry
- 4.2. PESTEL analysis
- 4.3. BCG Analysis
- 4.3.1. Stars (High Growth, High Market Share)
- 4.3.2. Cash Cows (Low Growth, High Market Share)
- 4.3.3. Question Mark (High Growth, Low Market Share)
- 4.3.4. Dogs (Low Growth, Low Market Share)
- 4.4. Ansoff Matrix Analysis
- 4.5. Supply Chain Analysis
- 4.6. Regulatory Landscape
- 4.7. Current Market Potential and Opportunity Assessment (TAM–SAM–SOM Framework)
- 4.8. DMV Analyst Note
- 4.1. Porters Five Forces
- 5. Market Analysis, Insights and Forecast 2021-2033
- 5.1. Market Analysis, Insights and Forecast - by Production Analysis
- 5.2. Market Analysis, Insights and Forecast - by Consumption Analysis
- 5.3. Market Analysis, Insights and Forecast - by Import Market Analysis (Value & Volume)
- 5.4. Market Analysis, Insights and Forecast - by Export Market Analysis (Value & Volume)
- 5.5. Market Analysis, Insights and Forecast - by Price Trend Analysis
- 5.6. Market Analysis, Insights and Forecast - by Region
- 5.6.1. North America
- 5.6.2. Europe
- 5.6.3. Asia Pacific
- 5.6.4. South America
- 5.6.5. Africa
- 6. Global Dry Chilies Industry Analysis, Insights and Forecast, 2021-2033
- 6.1. Market Analysis, Insights and Forecast - by Production Analysis
- 6.2. Market Analysis, Insights and Forecast - by Consumption Analysis
- 6.3. Market Analysis, Insights and Forecast - by Import Market Analysis (Value & Volume)
- 6.4. Market Analysis, Insights and Forecast - by Export Market Analysis (Value & Volume)
- 6.5. Market Analysis, Insights and Forecast - by Price Trend Analysis
- 7. North America Dry Chilies Industry Analysis, Insights and Forecast, 2020-2032
- 7.1. Market Analysis, Insights and Forecast - by Production Analysis
- 7.2. Market Analysis, Insights and Forecast - by Consumption Analysis
- 7.3. Market Analysis, Insights and Forecast - by Import Market Analysis (Value & Volume)
- 7.4. Market Analysis, Insights and Forecast - by Export Market Analysis (Value & Volume)
- 7.5. Market Analysis, Insights and Forecast - by Price Trend Analysis
- 8. Europe Dry Chilies Industry Analysis, Insights and Forecast, 2020-2032
- 8.1. Market Analysis, Insights and Forecast - by Production Analysis
- 8.2. Market Analysis, Insights and Forecast - by Consumption Analysis
- 8.3. Market Analysis, Insights and Forecast - by Import Market Analysis (Value & Volume)
- 8.4. Market Analysis, Insights and Forecast - by Export Market Analysis (Value & Volume)
- 8.5. Market Analysis, Insights and Forecast - by Price Trend Analysis
- 9. Asia Pacific Dry Chilies Industry Analysis, Insights and Forecast, 2020-2032
- 9.1. Market Analysis, Insights and Forecast - by Production Analysis
- 9.2. Market Analysis, Insights and Forecast - by Consumption Analysis
- 9.3. Market Analysis, Insights and Forecast - by Import Market Analysis (Value & Volume)
- 9.4. Market Analysis, Insights and Forecast - by Export Market Analysis (Value & Volume)
- 9.5. Market Analysis, Insights and Forecast - by Price Trend Analysis
- 10. South America Dry Chilies Industry Analysis, Insights and Forecast, 2020-2032
- 10.1. Market Analysis, Insights and Forecast - by Production Analysis
- 10.2. Market Analysis, Insights and Forecast - by Consumption Analysis
- 10.3. Market Analysis, Insights and Forecast - by Import Market Analysis (Value & Volume)
- 10.4. Market Analysis, Insights and Forecast - by Export Market Analysis (Value & Volume)
- 10.5. Market Analysis, Insights and Forecast - by Price Trend Analysis
- 11. Africa Dry Chilies Industry Analysis, Insights and Forecast, 2020-2032
- 11.1. Market Analysis, Insights and Forecast - by Production Analysis
- 11.2. Market Analysis, Insights and Forecast - by Consumption Analysis
- 11.3. Market Analysis, Insights and Forecast - by Import Market Analysis (Value & Volume)
- 11.4. Market Analysis, Insights and Forecast - by Export Market Analysis (Value & Volume)
- 11.5. Market Analysis, Insights and Forecast - by Price Trend Analysis
- 12. Competitive Analysis
- 12.1. Company Profiles
- 12.1.1 Syngenta India
- 12.1.1.1. Company Overview
- 12.1.1.2. Products
- 12.1.1.3. Company Financials
- 12.1.1.4. SWOT Analysis
- 12.1.2 Sunrise Foods
- 12.1.2.1. Company Overview
- 12.1.2.2. Products
- 12.1.2.3. Company Financials
- 12.1.2.4. SWOT Analysis
- 12.1.3 Laxmi Organic Industries
- 12.1.3.1. Company Overview
- 12.1.3.2. Products
- 12.1.3.3. Company Financials
- 12.1.3.4. SWOT Analysis
- 12.1.4 AIC India
- 12.1.4.1. Company Overview
- 12.1.4.2. Products
- 12.1.4.3. Company Financials
- 12.1.4.4. SWOT Analysis
- 12.1.5 Rico Company
- 12.1.5.1. Company Overview
- 12.1.5.2. Products
- 12.1.5.3. Company Financials
- 12.1.5.4. SWOT Analysis
- 12.1.1 Syngenta India
- 12.2. Market Entropy
- 12.2.1 Company's Key Areas Served
- 12.2.2 Recent Developments
- 12.3. Company Market Share Analysis 2025
- 12.3.1 Top 5 Companies Market Share Analysis
- 12.3.2 Top 3 Companies Market Share Analysis
- 12.4. List of Potential Customers
- 13. Research Methodology
List of Figures
- Figure 1: Global Dry Chilies Industry Revenue Breakdown (Million, %) by Region 2025 & 2033
- Figure 2: North America Dry Chilies Industry Revenue (Million), by Production Analysis 2025 & 2033
- Figure 3: North America Dry Chilies Industry Revenue Share (%), by Production Analysis 2025 & 2033
- Figure 4: North America Dry Chilies Industry Revenue (Million), by Consumption Analysis 2025 & 2033
- Figure 5: North America Dry Chilies Industry Revenue Share (%), by Consumption Analysis 2025 & 2033
- Figure 6: North America Dry Chilies Industry Revenue (Million), by Import Market Analysis (Value & Volume) 2025 & 2033
- Figure 7: North America Dry Chilies Industry Revenue Share (%), by Import Market Analysis (Value & Volume) 2025 & 2033
- Figure 8: North America Dry Chilies Industry Revenue (Million), by Export Market Analysis (Value & Volume) 2025 & 2033
- Figure 9: North America Dry Chilies Industry Revenue Share (%), by Export Market Analysis (Value & Volume) 2025 & 2033
- Figure 10: North America Dry Chilies Industry Revenue (Million), by Price Trend Analysis 2025 & 2033
- Figure 11: North America Dry Chilies Industry Revenue Share (%), by Price Trend Analysis 2025 & 2033
- Figure 12: North America Dry Chilies Industry Revenue (Million), by Country 2025 & 2033
- Figure 13: North America Dry Chilies Industry Revenue Share (%), by Country 2025 & 2033
- Figure 14: Europe Dry Chilies Industry Revenue (Million), by Production Analysis 2025 & 2033
- Figure 15: Europe Dry Chilies Industry Revenue Share (%), by Production Analysis 2025 & 2033
- Figure 16: Europe Dry Chilies Industry Revenue (Million), by Consumption Analysis 2025 & 2033
- Figure 17: Europe Dry Chilies Industry Revenue Share (%), by Consumption Analysis 2025 & 2033
- Figure 18: Europe Dry Chilies Industry Revenue (Million), by Import Market Analysis (Value & Volume) 2025 & 2033
- Figure 19: Europe Dry Chilies Industry Revenue Share (%), by Import Market Analysis (Value & Volume) 2025 & 2033
- Figure 20: Europe Dry Chilies Industry Revenue (Million), by Export Market Analysis (Value & Volume) 2025 & 2033
- Figure 21: Europe Dry Chilies Industry Revenue Share (%), by Export Market Analysis (Value & Volume) 2025 & 2033
- Figure 22: Europe Dry Chilies Industry Revenue (Million), by Price Trend Analysis 2025 & 2033
- Figure 23: Europe Dry Chilies Industry Revenue Share (%), by Price Trend Analysis 2025 & 2033
- Figure 24: Europe Dry Chilies Industry Revenue (Million), by Country 2025 & 2033
- Figure 25: Europe Dry Chilies Industry Revenue Share (%), by Country 2025 & 2033
- Figure 26: Asia Pacific Dry Chilies Industry Revenue (Million), by Production Analysis 2025 & 2033
- Figure 27: Asia Pacific Dry Chilies Industry Revenue Share (%), by Production Analysis 2025 & 2033
- Figure 28: Asia Pacific Dry Chilies Industry Revenue (Million), by Consumption Analysis 2025 & 2033
- Figure 29: Asia Pacific Dry Chilies Industry Revenue Share (%), by Consumption Analysis 2025 & 2033
- Figure 30: Asia Pacific Dry Chilies Industry Revenue (Million), by Import Market Analysis (Value & Volume) 2025 & 2033
- Figure 31: Asia Pacific Dry Chilies Industry Revenue Share (%), by Import Market Analysis (Value & Volume) 2025 & 2033
- Figure 32: Asia Pacific Dry Chilies Industry Revenue (Million), by Export Market Analysis (Value & Volume) 2025 & 2033
- Figure 33: Asia Pacific Dry Chilies Industry Revenue Share (%), by Export Market Analysis (Value & Volume) 2025 & 2033
- Figure 34: Asia Pacific Dry Chilies Industry Revenue (Million), by Price Trend Analysis 2025 & 2033
- Figure 35: Asia Pacific Dry Chilies Industry Revenue Share (%), by Price Trend Analysis 2025 & 2033
- Figure 36: Asia Pacific Dry Chilies Industry Revenue (Million), by Country 2025 & 2033
- Figure 37: Asia Pacific Dry Chilies Industry Revenue Share (%), by Country 2025 & 2033
- Figure 38: South America Dry Chilies Industry Revenue (Million), by Production Analysis 2025 & 2033
- Figure 39: South America Dry Chilies Industry Revenue Share (%), by Production Analysis 2025 & 2033
- Figure 40: South America Dry Chilies Industry Revenue (Million), by Consumption Analysis 2025 & 2033
- Figure 41: South America Dry Chilies Industry Revenue Share (%), by Consumption Analysis 2025 & 2033
- Figure 42: South America Dry Chilies Industry Revenue (Million), by Import Market Analysis (Value & Volume) 2025 & 2033
- Figure 43: South America Dry Chilies Industry Revenue Share (%), by Import Market Analysis (Value & Volume) 2025 & 2033
- Figure 44: South America Dry Chilies Industry Revenue (Million), by Export Market Analysis (Value & Volume) 2025 & 2033
- Figure 45: South America Dry Chilies Industry Revenue Share (%), by Export Market Analysis (Value & Volume) 2025 & 2033
- Figure 46: South America Dry Chilies Industry Revenue (Million), by Price Trend Analysis 2025 & 2033
- Figure 47: South America Dry Chilies Industry Revenue Share (%), by Price Trend Analysis 2025 & 2033
- Figure 48: South America Dry Chilies Industry Revenue (Million), by Country 2025 & 2033
- Figure 49: South America Dry Chilies Industry Revenue Share (%), by Country 2025 & 2033
- Figure 50: Africa Dry Chilies Industry Revenue (Million), by Production Analysis 2025 & 2033
- Figure 51: Africa Dry Chilies Industry Revenue Share (%), by Production Analysis 2025 & 2033
- Figure 52: Africa Dry Chilies Industry Revenue (Million), by Consumption Analysis 2025 & 2033
- Figure 53: Africa Dry Chilies Industry Revenue Share (%), by Consumption Analysis 2025 & 2033
- Figure 54: Africa Dry Chilies Industry Revenue (Million), by Import Market Analysis (Value & Volume) 2025 & 2033
- Figure 55: Africa Dry Chilies Industry Revenue Share (%), by Import Market Analysis (Value & Volume) 2025 & 2033
- Figure 56: Africa Dry Chilies Industry Revenue (Million), by Export Market Analysis (Value & Volume) 2025 & 2033
- Figure 57: Africa Dry Chilies Industry Revenue Share (%), by Export Market Analysis (Value & Volume) 2025 & 2033
- Figure 58: Africa Dry Chilies Industry Revenue (Million), by Price Trend Analysis 2025 & 2033
- Figure 59: Africa Dry Chilies Industry Revenue Share (%), by Price Trend Analysis 2025 & 2033
- Figure 60: Africa Dry Chilies Industry Revenue (Million), by Country 2025 & 2033
- Figure 61: Africa Dry Chilies Industry Revenue Share (%), by Country 2025 & 2033
List of Tables
- Table 1: Global Dry Chilies Industry Revenue Million Forecast, by Production Analysis 2020 & 2033
- Table 2: Global Dry Chilies Industry Revenue Million Forecast, by Consumption Analysis 2020 & 2033
- Table 3: Global Dry Chilies Industry Revenue Million Forecast, by Import Market Analysis (Value & Volume) 2020 & 2033
- Table 4: Global Dry Chilies Industry Revenue Million Forecast, by Export Market Analysis (Value & Volume) 2020 & 2033
- Table 5: Global Dry Chilies Industry Revenue Million Forecast, by Price Trend Analysis 2020 & 2033
- Table 6: Global Dry Chilies Industry Revenue Million Forecast, by Region 2020 & 2033
- Table 7: Global Dry Chilies Industry Revenue Million Forecast, by Production Analysis 2020 & 2033
- Table 8: Global Dry Chilies Industry Revenue Million Forecast, by Consumption Analysis 2020 & 2033
- Table 9: Global Dry Chilies Industry Revenue Million Forecast, by Import Market Analysis (Value & Volume) 2020 & 2033
- Table 10: Global Dry Chilies Industry Revenue Million Forecast, by Export Market Analysis (Value & Volume) 2020 & 2033
- Table 11: Global Dry Chilies Industry Revenue Million Forecast, by Price Trend Analysis 2020 & 2033
- Table 12: Global Dry Chilies Industry Revenue Million Forecast, by Country 2020 & 2033
- Table 13: United States Dry Chilies Industry Revenue (Million) Forecast, by Application 2020 & 2033
- Table 14: Canada Dry Chilies Industry Revenue (Million) Forecast, by Application 2020 & 2033
- Table 15: Mexico Dry Chilies Industry Revenue (Million) Forecast, by Application 2020 & 2033
- Table 16: Global Dry Chilies Industry Revenue Million Forecast, by Production Analysis 2020 & 2033
- Table 17: Global Dry Chilies Industry Revenue Million Forecast, by Consumption Analysis 2020 & 2033
- Table 18: Global Dry Chilies Industry Revenue Million Forecast, by Import Market Analysis (Value & Volume) 2020 & 2033
- Table 19: Global Dry Chilies Industry Revenue Million Forecast, by Export Market Analysis (Value & Volume) 2020 & 2033
- Table 20: Global Dry Chilies Industry Revenue Million Forecast, by Price Trend Analysis 2020 & 2033
- Table 21: Global Dry Chilies Industry Revenue Million Forecast, by Country 2020 & 2033
- Table 22: United Kingdom Dry Chilies Industry Revenue (Million) Forecast, by Application 2020 & 2033
- Table 23: Germany Dry Chilies Industry Revenue (Million) Forecast, by Application 2020 & 2033
- Table 24: France Dry Chilies Industry Revenue (Million) Forecast, by Application 2020 & 2033
- Table 25: Spain Dry Chilies Industry Revenue (Million) Forecast, by Application 2020 & 2033
- Table 26: Global Dry Chilies Industry Revenue Million Forecast, by Production Analysis 2020 & 2033
- Table 27: Global Dry Chilies Industry Revenue Million Forecast, by Consumption Analysis 2020 & 2033
- Table 28: Global Dry Chilies Industry Revenue Million Forecast, by Import Market Analysis (Value & Volume) 2020 & 2033
- Table 29: Global Dry Chilies Industry Revenue Million Forecast, by Export Market Analysis (Value & Volume) 2020 & 2033
- Table 30: Global Dry Chilies Industry Revenue Million Forecast, by Price Trend Analysis 2020 & 2033
- Table 31: Global Dry Chilies Industry Revenue Million Forecast, by Country 2020 & 2033
- Table 32: China Dry Chilies Industry Revenue (Million) Forecast, by Application 2020 & 2033
- Table 33: Australia Dry Chilies Industry Revenue (Million) Forecast, by Application 2020 & 2033
- Table 34: India Dry Chilies Industry Revenue (Million) Forecast, by Application 2020 & 2033
- Table 35: Global Dry Chilies Industry Revenue Million Forecast, by Production Analysis 2020 & 2033
- Table 36: Global Dry Chilies Industry Revenue Million Forecast, by Consumption Analysis 2020 & 2033
- Table 37: Global Dry Chilies Industry Revenue Million Forecast, by Import Market Analysis (Value & Volume) 2020 & 2033
- Table 38: Global Dry Chilies Industry Revenue Million Forecast, by Export Market Analysis (Value & Volume) 2020 & 2033
- Table 39: Global Dry Chilies Industry Revenue Million Forecast, by Price Trend Analysis 2020 & 2033
- Table 40: Global Dry Chilies Industry Revenue Million Forecast, by Country 2020 & 2033
- Table 41: Brazil Dry Chilies Industry Revenue (Million) Forecast, by Application 2020 & 2033
- Table 42: Argentina Dry Chilies Industry Revenue (Million) Forecast, by Application 2020 & 2033
- Table 43: Global Dry Chilies Industry Revenue Million Forecast, by Production Analysis 2020 & 2033
- Table 44: Global Dry Chilies Industry Revenue Million Forecast, by Consumption Analysis 2020 & 2033
- Table 45: Global Dry Chilies Industry Revenue Million Forecast, by Import Market Analysis (Value & Volume) 2020 & 2033
- Table 46: Global Dry Chilies Industry Revenue Million Forecast, by Export Market Analysis (Value & Volume) 2020 & 2033
- Table 47: Global Dry Chilies Industry Revenue Million Forecast, by Price Trend Analysis 2020 & 2033
- Table 48: Global Dry Chilies Industry Revenue Million Forecast, by Country 2020 & 2033
- Table 49: South Africa Dry Chilies Industry Revenue (Million) Forecast, by Application 2020 & 2033
- Table 50: Egypt Dry Chilies Industry Revenue (Million) Forecast, by Application 2020 & 2033
Frequently Asked Questions
1. What is the projected Compound Annual Growth Rate (CAGR) of the Dry Chilies Industry?
The projected CAGR is approximately 6.11%.
2. Which companies are prominent players in the Dry Chilies Industry?
Key companies in the market include Syngenta India, Sunrise Foods, Laxmi Organic Industries, AIC India, Rico Company.
3. What are the main segments of the Dry Chilies Industry?
The market segments include Production Analysis, Consumption Analysis, Import Market Analysis (Value & Volume), Export Market Analysis (Value & Volume), Price Trend Analysis.
4. Can you provide details about the market size?
The market size is estimated to be USD 1.61 Million as of 2022.
5. What are some drivers contributing to market growth?
Increasing Berry Consumption for Health Benefits; Increasing Adoption of High-Technology Farm Practices; Growing Usage of Berries in the Food and Beverage Industries.
6. What are the notable trends driving market growth?
High Demand for the Exotic and Spicy Oriental Dishes.
7. Are there any restraints impacting market growth?
High Production Cost Involved in Berry Production; Increasing Disease and Pest Infestations.
8. Can you provide examples of recent developments in the market?
November 2022: The Indonesian government increased domestic production of chilies rather than importing them from abroad, and to do this, it implemented strategic policies for chili development using hybrid seeds, complete and balanced fertilization, better irrigation infrastructure and farming roads, increasing the capacity of farmers' resources, and expanding the goals and market segments.
9. What pricing options are available for accessing the report?
Pricing options include single-user, multi-user, and enterprise licenses priced at USD 4750, USD 5250, and USD 8750 respectively.
10. Is the market size provided in terms of value or volume?
The market size is provided in terms of value, measured in Million.
11. Are there any specific market keywords associated with the report?
Yes, the market keyword associated with the report is "Dry Chilies Industry," which aids in identifying and referencing the specific market segment covered.
12. How do I determine which pricing option suits my needs best?
The pricing options vary based on user requirements and access needs. Individual users may opt for single-user licenses, while businesses requiring broader access may choose multi-user or enterprise licenses for cost-effective access to the report.
13. Are there any additional resources or data provided in the Dry Chilies Industry report?
While the report offers comprehensive insights, it's advisable to review the specific contents or supplementary materials provided to ascertain if additional resources or data are available.
14. How can I stay updated on further developments or reports in the Dry Chilies Industry?
To stay informed about further developments, trends, and reports in the Dry Chilies Industry, consider subscribing to industry newsletters, following relevant companies and organizations, or regularly checking reputable industry news sources and publications.
Methodology
Step 1 - Identification of Relevant Samples Size from Population Database


Step 2 - Approaches for Defining Global Market Size (Value, Volume* & Price*)

Note*: In applicable scenarios
Step 3 - Data Sources
Primary Research
- Web Analytics
- Survey Reports
- Research Institute
- Latest Research Reports
- Opinion Leaders
Secondary Research
- Annual Reports
- White Paper
- Latest Press Release
- Industry Association
- Paid Database
- Investor Presentations

Step 4 - Data Triangulation
Involves using different sources of information in order to increase the validity of a study
These sources are likely to be stakeholders in a program - participants, other researchers, program staff, other community members, and so on.
Then we put all data in single framework & apply various statistical tools to find out the dynamic on the market.
During the analysis stage, feedback from the stakeholder groups would be compared to determine areas of agreement as well as areas of divergence