

Key Insights
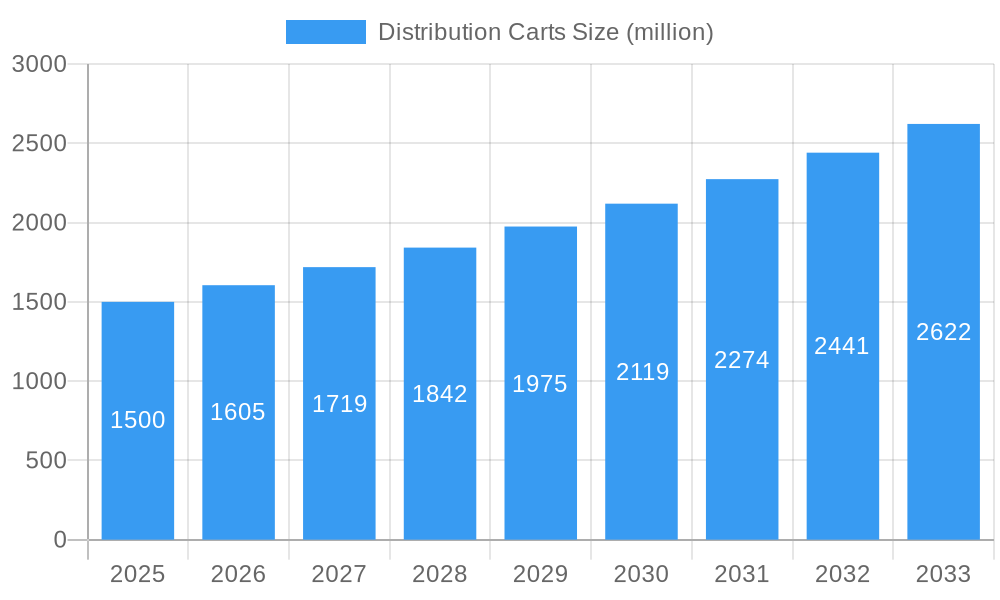
The global Distribution Carts market is poised for robust expansion, projected to reach an estimated USD 1,500 million in 2025 and grow at a Compound Annual Growth Rate (CAGR) of approximately 7.5% through 2033. This significant market trajectory is primarily driven by the escalating demands of the express industry, witnessing an unprecedented surge in e-commerce and same-day delivery services. Warehousing operations are also a major contributor, as automation and efficient material handling become paramount for optimizing supply chains. Furthermore, the hospitality sector, encompassing hotels and catering services, is increasingly adopting distribution carts to streamline internal logistics and enhance customer service. Emerging economies, particularly in the Asia Pacific region, are expected to exhibit the fastest growth due to rapid industrialization and a burgeoning logistics infrastructure.
Distribution Carts Market Size (In Billion)
Key trends shaping the distribution carts market include a strong emphasis on lightweight, durable, and ergonomic designs to improve user experience and reduce physical strain. The integration of smart technologies, such as GPS tracking and inventory management systems, is also gaining traction, enabling real-time monitoring and enhanced operational efficiency. Manufacturers are focusing on sustainable materials and energy-efficient electric models to cater to growing environmental concerns. However, the market faces certain restraints, including the high initial investment cost for advanced or automated cart systems, which can be a barrier for smaller businesses. Fluctuations in raw material prices, particularly for metals and plastics, can also impact profit margins. Despite these challenges, the continuous innovation in cart design and the unwavering demand from key end-use industries are expected to sustain a positive market outlook.
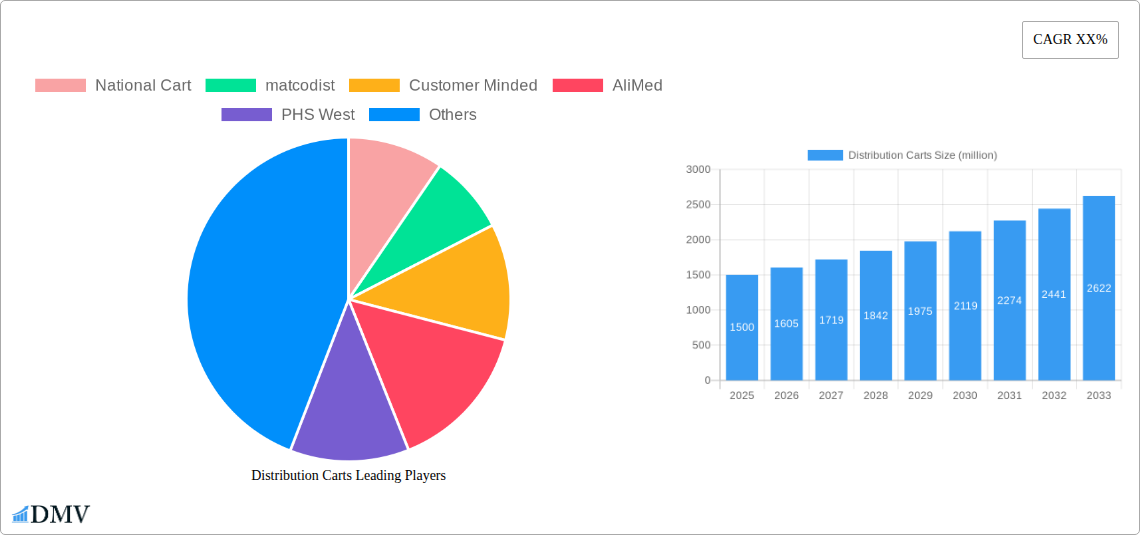
Distribution Carts Company Market Share
Distribution Carts Market Composition & Trends
The global Distribution Carts market is characterized by a moderate level of concentration, with key players like National Cart, matcodist, Customer Minded, AliMed, PHS West, Cannon Equipment, Artitalia Group, Pedigo USA, and LogiQuip strategically vying for market share. Innovation remains a primary catalyst, with companies continuously investing in smart cart technologies, improved ergonomics, and enhanced durability to meet evolving end-user demands across diverse applications. The regulatory landscape, while generally supportive of efficiency and safety in material handling, presents varied compliance requirements across different regions, influencing product design and market entry strategies. Substitute products, though present in the form of forklifts and pallet jacks in certain heavy-duty applications, often lack the flexibility and maneuverability of distribution carts in specialized environments. End-user profiles span the Express Industry, Warehousing Industry, Hotels and Catering, and a broad "Others" segment, each with unique operational needs and purchasing criteria. Mergers and Acquisitions (M&A) activity, though not at its peak, offers strategic opportunities for consolidation and market expansion. Recent M&A deals have averaged values in the tens of millions, indicating a focused approach to acquiring complementary technologies or expanding geographic reach. The distribution of market share is dynamic, with leading players holding approximately 60% of the market, while smaller specialized manufacturers capture the remaining 40%.
Distribution Carts Industry Evolution
The Distribution Carts industry has witnessed a significant evolutionary trajectory driven by escalating demands for operational efficiency, automation, and sustainable logistics solutions. Over the Study Period of 2019–2033, and particularly within the Base Year of 2025 and the Forecast Period of 2025–2033, the market has experienced robust growth, with an estimated Compound Annual Growth Rate (CAGR) of approximately 5.5%. This expansion is directly attributable to the burgeoning Warehousing Industry, fueled by the e-commerce boom, and the increasing adoption of sophisticated material handling equipment in the Express Industry. Technological advancements have been pivotal, introducing features such as integrated GPS tracking, smart inventory management systems, and advanced power-assisted lift mechanisms, thereby enhancing productivity and reducing labor costs. Adoption metrics for these advanced features have seen a substantial increase, with over 40% of new cart acquisitions incorporating some form of smart technology by 2024. Shifting consumer demands, particularly from the Hotels and Catering sector, are leaning towards more hygienic, easily maneuverable, and aesthetically pleasing cart designs that can seamlessly integrate into public-facing operational environments. Furthermore, the "Others" segment, encompassing healthcare, manufacturing, and retail, continues to drive demand through specialized cart solutions designed for specific operational workflows. The historical period of 2019–2024 laid the groundwork for this accelerated growth, characterized by incremental improvements in material science and ergonomic design. The Estimated Year of 2025 marks a significant inflection point, with sustained investment in smart technologies and a growing emphasis on the total cost of ownership, encompassing maintenance, energy efficiency, and operational lifespan.
Leading Regions, Countries, or Segments in Distribution Carts
The Warehousing Industry stands as a dominant segment within the global Distribution Carts market, demonstrating unparalleled growth and adoption rates throughout the Study Period (2019–2033). This dominance is primarily driven by the relentless expansion of e-commerce, which necessitates highly efficient and scalable logistics operations, making advanced distribution carts indispensable. Investment trends within this sector are substantial, with warehousing operators allocating significant capital towards upgrading their material handling infrastructure to optimize order fulfillment and reduce turnaround times. For instance, investments in automated warehousing solutions, which often integrate sophisticated distribution carts, have surged by an estimated 70% since 2020. Regulatory support for efficient logistics, including initiatives promoting supply chain resilience and faster delivery networks, further bolsters the demand for these carts within the Warehousing Industry.
Within applications, the Warehousing Industry's supremacy is further underscored by its consistent demand for all types of distribution carts, from robust Hand Push Trolleys for intricate internal movements to advanced Lift Trolleys and Elevated Trolleys for automated systems. The forecast period (2025–2033) anticipates this trend to intensify, with an estimated market share contribution of over 45% from the warehousing sector.
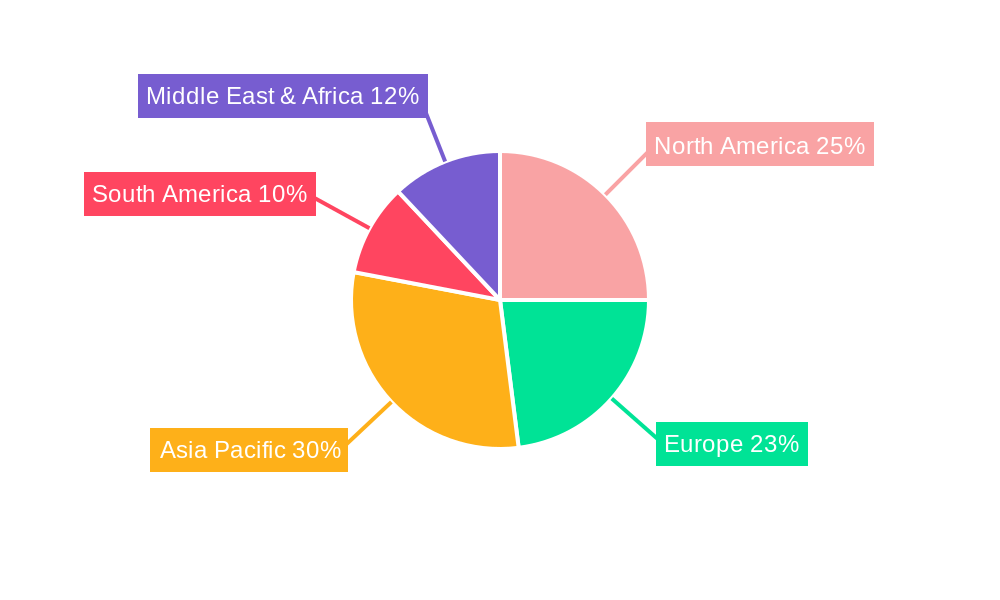
Geographically, North America and Europe currently lead the market due to their mature logistics infrastructure and high adoption rates of technology in warehousing and express delivery services. However, the Asia-Pacific region is emerging as a rapid growth engine, driven by increasing investments in manufacturing, e-commerce penetration, and the development of sophisticated supply chain networks. Countries like China and India are expected to witness significant growth in the distribution cart market, fueled by government initiatives aimed at modernizing logistics and improving trade efficiency. Key drivers in these regions include favorable manufacturing costs, a growing labor force requiring efficient material handling solutions, and the rapid expansion of urban centers demanding faster delivery networks.
Distribution Carts Product Innovations
Product innovations in the distribution carts market are centered on enhancing efficiency, user experience, and smart capabilities. Manufacturers are increasingly incorporating lightweight yet durable materials, such as advanced composites and high-strength aluminum alloys, to improve maneuverability and reduce operator fatigue. Smart features like integrated digital displays for inventory management, GPS tracking for optimized route planning, and sensor technology for collision avoidance are becoming standard in premium models. Performance metrics are witnessing significant improvements, with advancements in load-bearing capacities increasing by up to 20% and maneuverability enhanced through redesigned caster systems, leading to faster movement cycles.
Propelling Factors for Distribution Carts Growth
The growth of the distribution carts market is propelled by several critical factors. The relentless expansion of e-commerce and the subsequent demand for efficient warehousing and last-mile delivery solutions are primary drivers. Technological advancements, including the integration of IoT, AI, and automation, are enhancing the functionality and efficiency of distribution carts, making them indispensable for modern logistics. Furthermore, increasing investments in supply chain infrastructure by governments and private entities globally, coupled with a growing emphasis on workplace safety and ergonomics, are contributing to the sustained demand for advanced distribution cart solutions.
Obstacles in the Distribution Carts Market
Despite robust growth, the distribution carts market faces several obstacles. High initial investment costs for technologically advanced carts can be a deterrent for smaller businesses. Supply chain disruptions, including raw material shortages and logistical challenges, can impact production and lead times. Moreover, intense price competition among manufacturers, particularly in the more commoditized segments, can squeeze profit margins. Evolving regulatory frameworks concerning material handling and workplace safety, while generally beneficial, can also necessitate costly product redesigns and compliance efforts.
Future Opportunities in Distribution Carts
Emerging opportunities in the distribution carts market are abundant, driven by evolving consumer trends and technological breakthroughs. The growing demand for sustainable logistics solutions presents an opportunity for manufacturers to develop eco-friendly and energy-efficient carts. Expansion into emerging economies with rapidly developing logistics sectors offers significant untapped potential. Furthermore, the integration of advanced robotics and autonomous navigation systems into distribution carts promises to revolutionize warehouse operations, creating a niche for highly automated and intelligent cart solutions. The "Others" segment, particularly healthcare and pharmaceuticals, continues to present unique application-specific opportunities for specialized cart development.
Major Players in the Distribution Carts Ecosystem
- National Cart
- matcodist
- Customer Minded
- AliMed
- PHS West
- Cannon Equipment
- Artitalia Group
- Pedigo USA
- LogiQuip
Key Developments in Distribution Carts Industry
- 2023/10: National Cart launches a new line of modular distribution carts with enhanced ergonomic features.
- 2023/08: matcodist announces strategic partnership to expand its smart cart technology offerings.
- 2023/05: AliMed introduces a series of antimicrobial-coated distribution carts for healthcare applications.
- 2022/12: PHS West acquires a competitor to broaden its product portfolio and market reach.
- 2022/09: Cannon Equipment unveils next-generation lift trolleys with improved power efficiency.
- 2022/06: Artitalia Group invests in advanced manufacturing processes to increase production capacity.
- 2021/11: Pedigo USA develops innovative, lightweight materials for enhanced cart maneuverability.
- 2021/07: LogiQuip integrates IoT capabilities into its latest distribution cart models for real-time tracking.
- 2020/10: Major industry players collaborate on developing standardized safety features for distribution carts.
Strategic Distribution Carts Market Forecast
The strategic distribution carts market forecast indicates sustained and robust growth, fueled by continued e-commerce expansion and technological integration. The increasing adoption of smart features and automation within warehouses, express delivery services, and even hospitality sectors will drive demand for advanced, efficient, and user-friendly distribution carts. Emerging markets present significant untapped potential, while a growing focus on sustainability and workplace safety will further shape product development and market strategies. The interplay of these factors positions the distribution carts market for a dynamic and opportunity-rich future, with innovation remaining the key differentiator for market leaders.
Distribution Carts Segmentation
-
1. Application
- 1.1. Express Industry
- 1.2. Warehousing Industry
- 1.3. Hotels and Catering
- 1.4. Others
-
2. Types
- 2.1. Hand Push Trolley
- 2.2. Lift Trolley
- 2.3. Elevated Trolley
- 2.4. Others
Distribution Carts Segmentation By Geography
-
1. North America
- 1.1. United States
- 1.2. Canada
- 1.3. Mexico
-
2. South America
- 2.1. Brazil
- 2.2. Argentina
- 2.3. Rest of South America
-
3. Europe
- 3.1. United Kingdom
- 3.2. Germany
- 3.3. France
- 3.4. Italy
- 3.5. Spain
- 3.6. Russia
- 3.7. Benelux
- 3.8. Nordics
- 3.9. Rest of Europe
-
4. Middle East & Africa
- 4.1. Turkey
- 4.2. Israel
- 4.3. GCC
- 4.4. North Africa
- 4.5. South Africa
- 4.6. Rest of Middle East & Africa
-
5. Asia Pacific
- 5.1. China
- 5.2. India
- 5.3. Japan
- 5.4. South Korea
- 5.5. ASEAN
- 5.6. Oceania
- 5.7. Rest of Asia Pacific
Distribution Carts Regional Market Share
Geographic Coverage of Distribution Carts
Distribution Carts REPORT HIGHLIGHTS
| Aspects | Details |
|---|---|
| Study Period | 2020-2034 |
| Base Year | 2025 |
| Estimated Year | 2026 |
| Forecast Period | 2026-2034 |
| Historical Period | 2020-2025 |
| Growth Rate | CAGR of 8.1% from 2020-2034 |
| Segmentation |
|
Table of Contents
- 1. Introduction
- 1.1. Research Scope
- 1.2. Market Segmentation
- 1.3. Research Methodology
- 1.4. Definitions and Assumptions
- 2. Executive Summary
- 2.1. Introduction
- 3. Market Dynamics
- 3.1. Introduction
- 3.2. Market Drivers
- 3.3. Market Restrains
- 3.4. Market Trends
- 4. Market Factor Analysis
- 4.1. Porters Five Forces
- 4.2. Supply/Value Chain
- 4.3. PESTEL analysis
- 4.4. Market Entropy
- 4.5. Patent/Trademark Analysis
- 5. Global Distribution Carts Analysis, Insights and Forecast, 2020-2032
- 5.1. Market Analysis, Insights and Forecast - by Application
- 5.1.1. Express Industry
- 5.1.2. Warehousing Industry
- 5.1.3. Hotels and Catering
- 5.1.4. Others
- 5.2. Market Analysis, Insights and Forecast - by Types
- 5.2.1. Hand Push Trolley
- 5.2.2. Lift Trolley
- 5.2.3. Elevated Trolley
- 5.2.4. Others
- 5.3. Market Analysis, Insights and Forecast - by Region
- 5.3.1. North America
- 5.3.2. South America
- 5.3.3. Europe
- 5.3.4. Middle East & Africa
- 5.3.5. Asia Pacific
- 5.1. Market Analysis, Insights and Forecast - by Application
- 6. North America Distribution Carts Analysis, Insights and Forecast, 2020-2032
- 6.1. Market Analysis, Insights and Forecast - by Application
- 6.1.1. Express Industry
- 6.1.2. Warehousing Industry
- 6.1.3. Hotels and Catering
- 6.1.4. Others
- 6.2. Market Analysis, Insights and Forecast - by Types
- 6.2.1. Hand Push Trolley
- 6.2.2. Lift Trolley
- 6.2.3. Elevated Trolley
- 6.2.4. Others
- 6.1. Market Analysis, Insights and Forecast - by Application
- 7. South America Distribution Carts Analysis, Insights and Forecast, 2020-2032
- 7.1. Market Analysis, Insights and Forecast - by Application
- 7.1.1. Express Industry
- 7.1.2. Warehousing Industry
- 7.1.3. Hotels and Catering
- 7.1.4. Others
- 7.2. Market Analysis, Insights and Forecast - by Types
- 7.2.1. Hand Push Trolley
- 7.2.2. Lift Trolley
- 7.2.3. Elevated Trolley
- 7.2.4. Others
- 7.1. Market Analysis, Insights and Forecast - by Application
- 8. Europe Distribution Carts Analysis, Insights and Forecast, 2020-2032
- 8.1. Market Analysis, Insights and Forecast - by Application
- 8.1.1. Express Industry
- 8.1.2. Warehousing Industry
- 8.1.3. Hotels and Catering
- 8.1.4. Others
- 8.2. Market Analysis, Insights and Forecast - by Types
- 8.2.1. Hand Push Trolley
- 8.2.2. Lift Trolley
- 8.2.3. Elevated Trolley
- 8.2.4. Others
- 8.1. Market Analysis, Insights and Forecast - by Application
- 9. Middle East & Africa Distribution Carts Analysis, Insights and Forecast, 2020-2032
- 9.1. Market Analysis, Insights and Forecast - by Application
- 9.1.1. Express Industry
- 9.1.2. Warehousing Industry
- 9.1.3. Hotels and Catering
- 9.1.4. Others
- 9.2. Market Analysis, Insights and Forecast - by Types
- 9.2.1. Hand Push Trolley
- 9.2.2. Lift Trolley
- 9.2.3. Elevated Trolley
- 9.2.4. Others
- 9.1. Market Analysis, Insights and Forecast - by Application
- 10. Asia Pacific Distribution Carts Analysis, Insights and Forecast, 2020-2032
- 10.1. Market Analysis, Insights and Forecast - by Application
- 10.1.1. Express Industry
- 10.1.2. Warehousing Industry
- 10.1.3. Hotels and Catering
- 10.1.4. Others
- 10.2. Market Analysis, Insights and Forecast - by Types
- 10.2.1. Hand Push Trolley
- 10.2.2. Lift Trolley
- 10.2.3. Elevated Trolley
- 10.2.4. Others
- 10.1. Market Analysis, Insights and Forecast - by Application
- 11. Competitive Analysis
- 11.1. Global Market Share Analysis 2025
- 11.2. Company Profiles
- 11.2.1 National Cart
- 11.2.1.1. Overview
- 11.2.1.2. Products
- 11.2.1.3. SWOT Analysis
- 11.2.1.4. Recent Developments
- 11.2.1.5. Financials (Based on Availability)
- 11.2.2 matcodist
- 11.2.2.1. Overview
- 11.2.2.2. Products
- 11.2.2.3. SWOT Analysis
- 11.2.2.4. Recent Developments
- 11.2.2.5. Financials (Based on Availability)
- 11.2.3 Customer Minded
- 11.2.3.1. Overview
- 11.2.3.2. Products
- 11.2.3.3. SWOT Analysis
- 11.2.3.4. Recent Developments
- 11.2.3.5. Financials (Based on Availability)
- 11.2.4 AliMed
- 11.2.4.1. Overview
- 11.2.4.2. Products
- 11.2.4.3. SWOT Analysis
- 11.2.4.4. Recent Developments
- 11.2.4.5. Financials (Based on Availability)
- 11.2.5 PHS West
- 11.2.5.1. Overview
- 11.2.5.2. Products
- 11.2.5.3. SWOT Analysis
- 11.2.5.4. Recent Developments
- 11.2.5.5. Financials (Based on Availability)
- 11.2.6 Cannon Equipment
- 11.2.6.1. Overview
- 11.2.6.2. Products
- 11.2.6.3. SWOT Analysis
- 11.2.6.4. Recent Developments
- 11.2.6.5. Financials (Based on Availability)
- 11.2.7 Artitalia Group
- 11.2.7.1. Overview
- 11.2.7.2. Products
- 11.2.7.3. SWOT Analysis
- 11.2.7.4. Recent Developments
- 11.2.7.5. Financials (Based on Availability)
- 11.2.8 Pedigo USA
- 11.2.8.1. Overview
- 11.2.8.2. Products
- 11.2.8.3. SWOT Analysis
- 11.2.8.4. Recent Developments
- 11.2.8.5. Financials (Based on Availability)
- 11.2.9 LogiQuip
- 11.2.9.1. Overview
- 11.2.9.2. Products
- 11.2.9.3. SWOT Analysis
- 11.2.9.4. Recent Developments
- 11.2.9.5. Financials (Based on Availability)
- 11.2.1 National Cart
List of Figures
- Figure 1: Global Distribution Carts Revenue Breakdown (undefined, %) by Region 2025 & 2033
- Figure 2: Global Distribution Carts Volume Breakdown (K, %) by Region 2025 & 2033
- Figure 3: North America Distribution Carts Revenue (undefined), by Application 2025 & 2033
- Figure 4: North America Distribution Carts Volume (K), by Application 2025 & 2033
- Figure 5: North America Distribution Carts Revenue Share (%), by Application 2025 & 2033
- Figure 6: North America Distribution Carts Volume Share (%), by Application 2025 & 2033
- Figure 7: North America Distribution Carts Revenue (undefined), by Types 2025 & 2033
- Figure 8: North America Distribution Carts Volume (K), by Types 2025 & 2033
- Figure 9: North America Distribution Carts Revenue Share (%), by Types 2025 & 2033
- Figure 10: North America Distribution Carts Volume Share (%), by Types 2025 & 2033
- Figure 11: North America Distribution Carts Revenue (undefined), by Country 2025 & 2033
- Figure 12: North America Distribution Carts Volume (K), by Country 2025 & 2033
- Figure 13: North America Distribution Carts Revenue Share (%), by Country 2025 & 2033
- Figure 14: North America Distribution Carts Volume Share (%), by Country 2025 & 2033
- Figure 15: South America Distribution Carts Revenue (undefined), by Application 2025 & 2033
- Figure 16: South America Distribution Carts Volume (K), by Application 2025 & 2033
- Figure 17: South America Distribution Carts Revenue Share (%), by Application 2025 & 2033
- Figure 18: South America Distribution Carts Volume Share (%), by Application 2025 & 2033
- Figure 19: South America Distribution Carts Revenue (undefined), by Types 2025 & 2033
- Figure 20: South America Distribution Carts Volume (K), by Types 2025 & 2033
- Figure 21: South America Distribution Carts Revenue Share (%), by Types 2025 & 2033
- Figure 22: South America Distribution Carts Volume Share (%), by Types 2025 & 2033
- Figure 23: South America Distribution Carts Revenue (undefined), by Country 2025 & 2033
- Figure 24: South America Distribution Carts Volume (K), by Country 2025 & 2033
- Figure 25: South America Distribution Carts Revenue Share (%), by Country 2025 & 2033
- Figure 26: South America Distribution Carts Volume Share (%), by Country 2025 & 2033
- Figure 27: Europe Distribution Carts Revenue (undefined), by Application 2025 & 2033
- Figure 28: Europe Distribution Carts Volume (K), by Application 2025 & 2033
- Figure 29: Europe Distribution Carts Revenue Share (%), by Application 2025 & 2033
- Figure 30: Europe Distribution Carts Volume Share (%), by Application 2025 & 2033
- Figure 31: Europe Distribution Carts Revenue (undefined), by Types 2025 & 2033
- Figure 32: Europe Distribution Carts Volume (K), by Types 2025 & 2033
- Figure 33: Europe Distribution Carts Revenue Share (%), by Types 2025 & 2033
- Figure 34: Europe Distribution Carts Volume Share (%), by Types 2025 & 2033
- Figure 35: Europe Distribution Carts Revenue (undefined), by Country 2025 & 2033
- Figure 36: Europe Distribution Carts Volume (K), by Country 2025 & 2033
- Figure 37: Europe Distribution Carts Revenue Share (%), by Country 2025 & 2033
- Figure 38: Europe Distribution Carts Volume Share (%), by Country 2025 & 2033
- Figure 39: Middle East & Africa Distribution Carts Revenue (undefined), by Application 2025 & 2033
- Figure 40: Middle East & Africa Distribution Carts Volume (K), by Application 2025 & 2033
- Figure 41: Middle East & Africa Distribution Carts Revenue Share (%), by Application 2025 & 2033
- Figure 42: Middle East & Africa Distribution Carts Volume Share (%), by Application 2025 & 2033
- Figure 43: Middle East & Africa Distribution Carts Revenue (undefined), by Types 2025 & 2033
- Figure 44: Middle East & Africa Distribution Carts Volume (K), by Types 2025 & 2033
- Figure 45: Middle East & Africa Distribution Carts Revenue Share (%), by Types 2025 & 2033
- Figure 46: Middle East & Africa Distribution Carts Volume Share (%), by Types 2025 & 2033
- Figure 47: Middle East & Africa Distribution Carts Revenue (undefined), by Country 2025 & 2033
- Figure 48: Middle East & Africa Distribution Carts Volume (K), by Country 2025 & 2033
- Figure 49: Middle East & Africa Distribution Carts Revenue Share (%), by Country 2025 & 2033
- Figure 50: Middle East & Africa Distribution Carts Volume Share (%), by Country 2025 & 2033
- Figure 51: Asia Pacific Distribution Carts Revenue (undefined), by Application 2025 & 2033
- Figure 52: Asia Pacific Distribution Carts Volume (K), by Application 2025 & 2033
- Figure 53: Asia Pacific Distribution Carts Revenue Share (%), by Application 2025 & 2033
- Figure 54: Asia Pacific Distribution Carts Volume Share (%), by Application 2025 & 2033
- Figure 55: Asia Pacific Distribution Carts Revenue (undefined), by Types 2025 & 2033
- Figure 56: Asia Pacific Distribution Carts Volume (K), by Types 2025 & 2033
- Figure 57: Asia Pacific Distribution Carts Revenue Share (%), by Types 2025 & 2033
- Figure 58: Asia Pacific Distribution Carts Volume Share (%), by Types 2025 & 2033
- Figure 59: Asia Pacific Distribution Carts Revenue (undefined), by Country 2025 & 2033
- Figure 60: Asia Pacific Distribution Carts Volume (K), by Country 2025 & 2033
- Figure 61: Asia Pacific Distribution Carts Revenue Share (%), by Country 2025 & 2033
- Figure 62: Asia Pacific Distribution Carts Volume Share (%), by Country 2025 & 2033
List of Tables
- Table 1: Global Distribution Carts Revenue undefined Forecast, by Application 2020 & 2033
- Table 2: Global Distribution Carts Volume K Forecast, by Application 2020 & 2033
- Table 3: Global Distribution Carts Revenue undefined Forecast, by Types 2020 & 2033
- Table 4: Global Distribution Carts Volume K Forecast, by Types 2020 & 2033
- Table 5: Global Distribution Carts Revenue undefined Forecast, by Region 2020 & 2033
- Table 6: Global Distribution Carts Volume K Forecast, by Region 2020 & 2033
- Table 7: Global Distribution Carts Revenue undefined Forecast, by Application 2020 & 2033
- Table 8: Global Distribution Carts Volume K Forecast, by Application 2020 & 2033
- Table 9: Global Distribution Carts Revenue undefined Forecast, by Types 2020 & 2033
- Table 10: Global Distribution Carts Volume K Forecast, by Types 2020 & 2033
- Table 11: Global Distribution Carts Revenue undefined Forecast, by Country 2020 & 2033
- Table 12: Global Distribution Carts Volume K Forecast, by Country 2020 & 2033
- Table 13: United States Distribution Carts Revenue (undefined) Forecast, by Application 2020 & 2033
- Table 14: United States Distribution Carts Volume (K) Forecast, by Application 2020 & 2033
- Table 15: Canada Distribution Carts Revenue (undefined) Forecast, by Application 2020 & 2033
- Table 16: Canada Distribution Carts Volume (K) Forecast, by Application 2020 & 2033
- Table 17: Mexico Distribution Carts Revenue (undefined) Forecast, by Application 2020 & 2033
- Table 18: Mexico Distribution Carts Volume (K) Forecast, by Application 2020 & 2033
- Table 19: Global Distribution Carts Revenue undefined Forecast, by Application 2020 & 2033
- Table 20: Global Distribution Carts Volume K Forecast, by Application 2020 & 2033
- Table 21: Global Distribution Carts Revenue undefined Forecast, by Types 2020 & 2033
- Table 22: Global Distribution Carts Volume K Forecast, by Types 2020 & 2033
- Table 23: Global Distribution Carts Revenue undefined Forecast, by Country 2020 & 2033
- Table 24: Global Distribution Carts Volume K Forecast, by Country 2020 & 2033
- Table 25: Brazil Distribution Carts Revenue (undefined) Forecast, by Application 2020 & 2033
- Table 26: Brazil Distribution Carts Volume (K) Forecast, by Application 2020 & 2033
- Table 27: Argentina Distribution Carts Revenue (undefined) Forecast, by Application 2020 & 2033
- Table 28: Argentina Distribution Carts Volume (K) Forecast, by Application 2020 & 2033
- Table 29: Rest of South America Distribution Carts Revenue (undefined) Forecast, by Application 2020 & 2033
- Table 30: Rest of South America Distribution Carts Volume (K) Forecast, by Application 2020 & 2033
- Table 31: Global Distribution Carts Revenue undefined Forecast, by Application 2020 & 2033
- Table 32: Global Distribution Carts Volume K Forecast, by Application 2020 & 2033
- Table 33: Global Distribution Carts Revenue undefined Forecast, by Types 2020 & 2033
- Table 34: Global Distribution Carts Volume K Forecast, by Types 2020 & 2033
- Table 35: Global Distribution Carts Revenue undefined Forecast, by Country 2020 & 2033
- Table 36: Global Distribution Carts Volume K Forecast, by Country 2020 & 2033
- Table 37: United Kingdom Distribution Carts Revenue (undefined) Forecast, by Application 2020 & 2033
- Table 38: United Kingdom Distribution Carts Volume (K) Forecast, by Application 2020 & 2033
- Table 39: Germany Distribution Carts Revenue (undefined) Forecast, by Application 2020 & 2033
- Table 40: Germany Distribution Carts Volume (K) Forecast, by Application 2020 & 2033
- Table 41: France Distribution Carts Revenue (undefined) Forecast, by Application 2020 & 2033
- Table 42: France Distribution Carts Volume (K) Forecast, by Application 2020 & 2033
- Table 43: Italy Distribution Carts Revenue (undefined) Forecast, by Application 2020 & 2033
- Table 44: Italy Distribution Carts Volume (K) Forecast, by Application 2020 & 2033
- Table 45: Spain Distribution Carts Revenue (undefined) Forecast, by Application 2020 & 2033
- Table 46: Spain Distribution Carts Volume (K) Forecast, by Application 2020 & 2033
- Table 47: Russia Distribution Carts Revenue (undefined) Forecast, by Application 2020 & 2033
- Table 48: Russia Distribution Carts Volume (K) Forecast, by Application 2020 & 2033
- Table 49: Benelux Distribution Carts Revenue (undefined) Forecast, by Application 2020 & 2033
- Table 50: Benelux Distribution Carts Volume (K) Forecast, by Application 2020 & 2033
- Table 51: Nordics Distribution Carts Revenue (undefined) Forecast, by Application 2020 & 2033
- Table 52: Nordics Distribution Carts Volume (K) Forecast, by Application 2020 & 2033
- Table 53: Rest of Europe Distribution Carts Revenue (undefined) Forecast, by Application 2020 & 2033
- Table 54: Rest of Europe Distribution Carts Volume (K) Forecast, by Application 2020 & 2033
- Table 55: Global Distribution Carts Revenue undefined Forecast, by Application 2020 & 2033
- Table 56: Global Distribution Carts Volume K Forecast, by Application 2020 & 2033
- Table 57: Global Distribution Carts Revenue undefined Forecast, by Types 2020 & 2033
- Table 58: Global Distribution Carts Volume K Forecast, by Types 2020 & 2033
- Table 59: Global Distribution Carts Revenue undefined Forecast, by Country 2020 & 2033
- Table 60: Global Distribution Carts Volume K Forecast, by Country 2020 & 2033
- Table 61: Turkey Distribution Carts Revenue (undefined) Forecast, by Application 2020 & 2033
- Table 62: Turkey Distribution Carts Volume (K) Forecast, by Application 2020 & 2033
- Table 63: Israel Distribution Carts Revenue (undefined) Forecast, by Application 2020 & 2033
- Table 64: Israel Distribution Carts Volume (K) Forecast, by Application 2020 & 2033
- Table 65: GCC Distribution Carts Revenue (undefined) Forecast, by Application 2020 & 2033
- Table 66: GCC Distribution Carts Volume (K) Forecast, by Application 2020 & 2033
- Table 67: North Africa Distribution Carts Revenue (undefined) Forecast, by Application 2020 & 2033
- Table 68: North Africa Distribution Carts Volume (K) Forecast, by Application 2020 & 2033
- Table 69: South Africa Distribution Carts Revenue (undefined) Forecast, by Application 2020 & 2033
- Table 70: South Africa Distribution Carts Volume (K) Forecast, by Application 2020 & 2033
- Table 71: Rest of Middle East & Africa Distribution Carts Revenue (undefined) Forecast, by Application 2020 & 2033
- Table 72: Rest of Middle East & Africa Distribution Carts Volume (K) Forecast, by Application 2020 & 2033
- Table 73: Global Distribution Carts Revenue undefined Forecast, by Application 2020 & 2033
- Table 74: Global Distribution Carts Volume K Forecast, by Application 2020 & 2033
- Table 75: Global Distribution Carts Revenue undefined Forecast, by Types 2020 & 2033
- Table 76: Global Distribution Carts Volume K Forecast, by Types 2020 & 2033
- Table 77: Global Distribution Carts Revenue undefined Forecast, by Country 2020 & 2033
- Table 78: Global Distribution Carts Volume K Forecast, by Country 2020 & 2033
- Table 79: China Distribution Carts Revenue (undefined) Forecast, by Application 2020 & 2033
- Table 80: China Distribution Carts Volume (K) Forecast, by Application 2020 & 2033
- Table 81: India Distribution Carts Revenue (undefined) Forecast, by Application 2020 & 2033
- Table 82: India Distribution Carts Volume (K) Forecast, by Application 2020 & 2033
- Table 83: Japan Distribution Carts Revenue (undefined) Forecast, by Application 2020 & 2033
- Table 84: Japan Distribution Carts Volume (K) Forecast, by Application 2020 & 2033
- Table 85: South Korea Distribution Carts Revenue (undefined) Forecast, by Application 2020 & 2033
- Table 86: South Korea Distribution Carts Volume (K) Forecast, by Application 2020 & 2033
- Table 87: ASEAN Distribution Carts Revenue (undefined) Forecast, by Application 2020 & 2033
- Table 88: ASEAN Distribution Carts Volume (K) Forecast, by Application 2020 & 2033
- Table 89: Oceania Distribution Carts Revenue (undefined) Forecast, by Application 2020 & 2033
- Table 90: Oceania Distribution Carts Volume (K) Forecast, by Application 2020 & 2033
- Table 91: Rest of Asia Pacific Distribution Carts Revenue (undefined) Forecast, by Application 2020 & 2033
- Table 92: Rest of Asia Pacific Distribution Carts Volume (K) Forecast, by Application 2020 & 2033
Frequently Asked Questions
1. What is the projected Compound Annual Growth Rate (CAGR) of the Distribution Carts?
The projected CAGR is approximately 8.1%.
2. Which companies are prominent players in the Distribution Carts?
Key companies in the market include National Cart, matcodist, Customer Minded, AliMed, PHS West, Cannon Equipment, Artitalia Group, Pedigo USA, LogiQuip.
3. What are the main segments of the Distribution Carts?
The market segments include Application, Types.
4. Can you provide details about the market size?
The market size is estimated to be USD XXX N/A as of 2022.
5. What are some drivers contributing to market growth?
N/A
6. What are the notable trends driving market growth?
N/A
7. Are there any restraints impacting market growth?
N/A
8. Can you provide examples of recent developments in the market?
N/A
9. What pricing options are available for accessing the report?
Pricing options include single-user, multi-user, and enterprise licenses priced at USD 4350.00, USD 6525.00, and USD 8700.00 respectively.
10. Is the market size provided in terms of value or volume?
The market size is provided in terms of value, measured in N/A and volume, measured in K.
11. Are there any specific market keywords associated with the report?
Yes, the market keyword associated with the report is "Distribution Carts," which aids in identifying and referencing the specific market segment covered.
12. How do I determine which pricing option suits my needs best?
The pricing options vary based on user requirements and access needs. Individual users may opt for single-user licenses, while businesses requiring broader access may choose multi-user or enterprise licenses for cost-effective access to the report.
13. Are there any additional resources or data provided in the Distribution Carts report?
While the report offers comprehensive insights, it's advisable to review the specific contents or supplementary materials provided to ascertain if additional resources or data are available.
14. How can I stay updated on further developments or reports in the Distribution Carts?
To stay informed about further developments, trends, and reports in the Distribution Carts, consider subscribing to industry newsletters, following relevant companies and organizations, or regularly checking reputable industry news sources and publications.
Methodology
Step 1 - Identification of Relevant Samples Size from Population Database


Step 2 - Approaches for Defining Global Market Size (Value, Volume* & Price*)

Note*: In applicable scenarios
Step 3 - Data Sources
Primary Research
- Web Analytics
- Survey Reports
- Research Institute
- Latest Research Reports
- Opinion Leaders
Secondary Research
- Annual Reports
- White Paper
- Latest Press Release
- Industry Association
- Paid Database
- Investor Presentations

Step 4 - Data Triangulation
Involves using different sources of information in order to increase the validity of a study
These sources are likely to be stakeholders in a program - participants, other researchers, program staff, other community members, and so on.
Then we put all data in single framework & apply various statistical tools to find out the dynamic on the market.
During the analysis stage, feedback from the stakeholder groups would be compared to determine areas of agreement as well as areas of divergence