

Key Insights
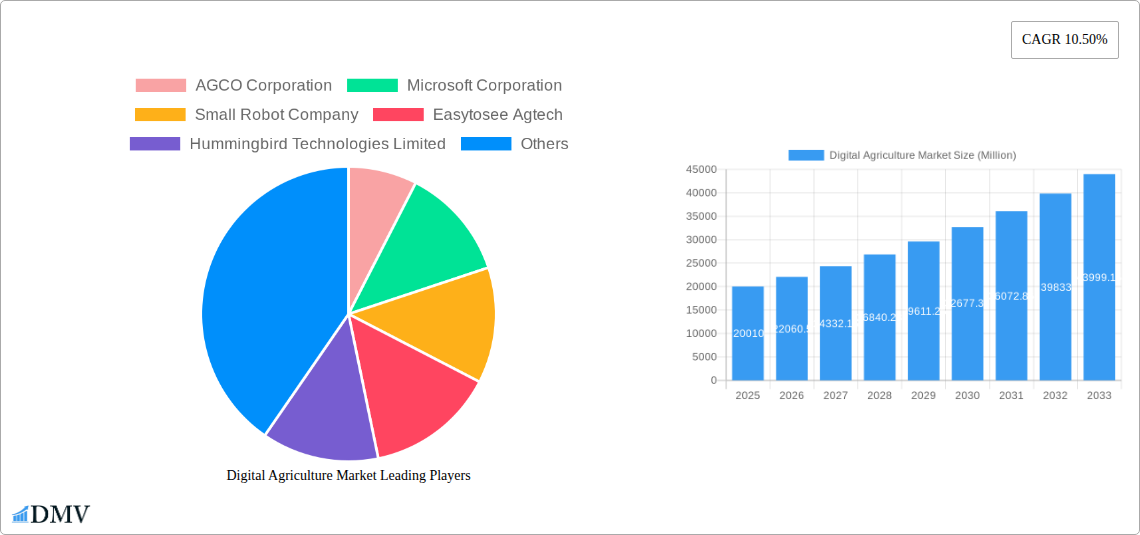
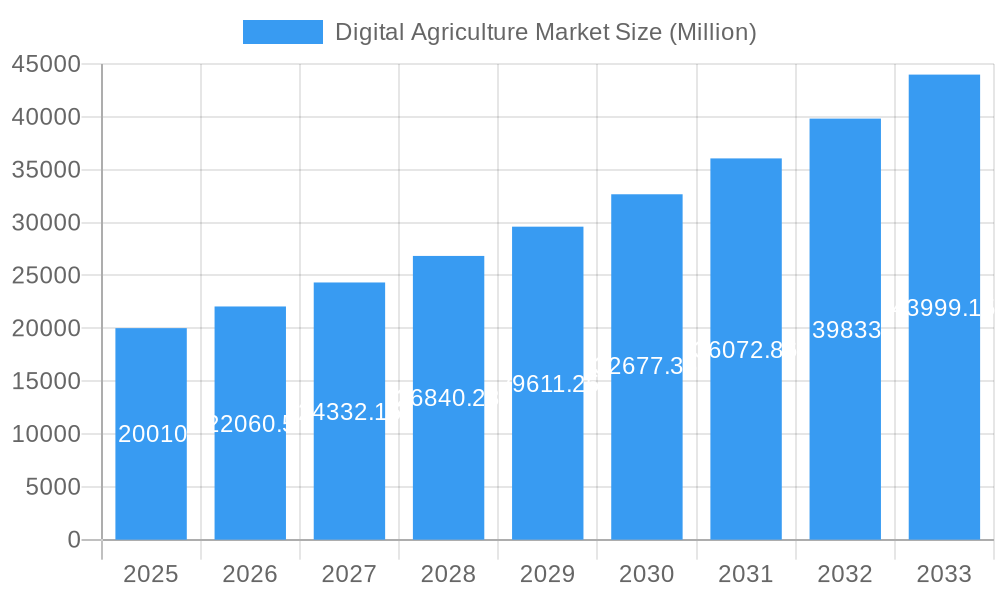
The digital agriculture market, valued at $20.01 billion in 2021, is experiencing robust growth, projected to expand at a compound annual growth rate (CAGR) of 10.5% from 2025 to 2033. This surge is driven by several key factors. Firstly, the increasing need for enhanced crop yields and efficient resource management in the face of a growing global population and climate change is pushing farmers towards data-driven decision-making. Secondly, advancements in technologies like artificial intelligence (AI), drone analytics, and precision farming solutions are offering unprecedented levels of insight into crop health, soil conditions, and weather patterns. This allows for optimized irrigation, fertilization, and pest control, leading to significant cost savings and yield improvements. Thirdly, the growing adoption of variable rate technology (VRT) and other smart farming solutions is streamlining agricultural operations, boosting productivity, and minimizing environmental impact. The market is segmented by application (crop monitoring, precision farming, other applications), technology (AI, drone analytics), solution (VRT, other solutions), and deployment (type). Key players like AGCO Corporation, Microsoft, and Deere & Company are leading the innovation and adoption of these technologies, shaping the future of agriculture.
Digital Agriculture Market Market Size (In Billion)
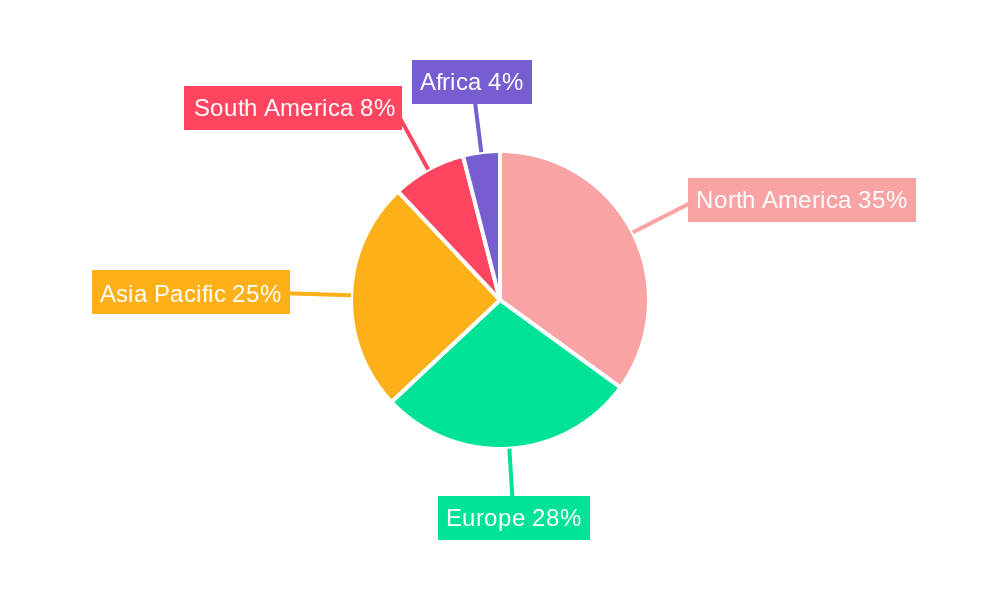
The market's regional distribution reveals significant growth opportunities across various regions. While North America and Europe currently hold substantial market share due to early adoption and technological advancements, the Asia-Pacific region is poised for significant expansion driven by increasing agricultural activity and government initiatives promoting technological adoption. South America and Africa also present considerable growth potential, albeit with challenges related to infrastructure and technological accessibility. The continuous development of user-friendly interfaces and cost-effective solutions is crucial to bridging the digital divide and ensuring broader market penetration. Future growth will depend on factors such as advancements in sensor technologies, increased data analytics capabilities, robust digital infrastructure development, and the ongoing integration of IoT devices into farming operations. Furthermore, overcoming data security and privacy concerns will play a crucial role in the market's continued expansion.
Digital Agriculture Market Company Market Share
Digital Agriculture Market Report: 2019-2033 Forecast
This comprehensive report provides an in-depth analysis of the Digital Agriculture Market, projecting robust growth from $xx Million in 2025 to $xx Million by 2033. Covering the period 2019-2033 (historical period: 2019-2024, base year: 2025, forecast period: 2025-2033), this study offers critical insights for stakeholders seeking to navigate this rapidly evolving sector. The report meticulously examines market segmentation (Crop Monitoring, Variable Rate Technology, Precision Farming, Artificial Intelligence, Drone Analytics, and Other Applications), pinpointing key trends and opportunities for growth.
Digital Agriculture Market Market Composition & Trends
The Digital Agriculture market is characterized by a moderately concentrated landscape, with key players like Deere & Company, AGCO Corporation, and Trimble Inc. holding significant market share. However, the emergence of innovative startups and the increasing adoption of open-source technologies are fostering competition and driving market fragmentation. The market share distribution in 2025 is estimated as follows: Deere & Company (xx%), AGCO Corporation (xx%), Trimble Inc. (xx%), and Others (xx%). Innovation is primarily driven by advancements in AI, IoT, and big data analytics, leading to the development of sophisticated solutions for precision farming and crop management. Regulatory landscapes vary across regions, with some governments actively promoting digital agriculture adoption through subsidies and supportive policies. Substitute products are limited, as digital solutions offer unique capabilities in data-driven decision-making and optimized resource utilization. The market sees substantial M&A activity, with deal values exceeding $xx Million in the past five years, driven by companies seeking to expand their technology portfolios and market reach. End-users comprise a diverse group including large-scale farms, smallholder farmers, agricultural cooperatives, and government agencies.
- Market Concentration: Moderately concentrated, with a few dominant players and increasing fragmentation.
- Innovation Catalysts: AI, IoT, big data analytics, open-source technologies.
- Regulatory Landscape: Varies across regions; some regions offer strong support.
- Substitute Products: Limited, given the unique advantages of digital solutions.
- End-User Profile: Large-scale farms, smallholder farmers, cooperatives, government agencies.
- M&A Activity: Significant, with total deal values exceeding $xx Million in the last five years.
Digital Agriculture Market Industry Evolution
The Digital Agriculture market exhibits a strong growth trajectory, propelled by increasing demand for enhanced farm productivity, resource optimization, and sustainable agriculture practices. Technological advancements, such as the integration of cloud computing, advanced sensors, and AI-powered analytics, are fundamentally reshaping farming operations. Consumer demands are shifting towards higher-quality, sustainably produced food, driving the adoption of digital tools that enhance traceability and efficiency. The market has witnessed a Compound Annual Growth Rate (CAGR) of xx% during the historical period (2019-2024) and is projected to grow at a CAGR of xx% during the forecast period (2025-2033). Adoption metrics show a significant increase in the number of farms utilizing digital agriculture technologies, with xx% of farms expected to adopt at least one digital solution by 2033. This growth is further fuelled by increasing awareness among farmers about the benefits of precision agriculture and the availability of affordable solutions.
Leading Regions, Countries, or Segments in Digital Agriculture Market
North America currently leads the Digital Agriculture market, driven by high technology adoption rates, substantial investments in agricultural technology, and a robust regulatory framework supporting innovation. Key drivers in this region include significant venture capital investments, government initiatives to promote precision farming, and a high concentration of technology providers.
- North America: High technology adoption, substantial investments, supportive regulations, and a dense network of technology providers.
- Europe: Growing adoption rates, strong focus on sustainable agriculture, and increasing government support.
- Asia-Pacific: Rapid market growth potential, driven by increasing farm sizes and government initiatives to modernize agriculture.
Other leading segments include:
- Crop Monitoring: High demand for real-time data on crop health and yield prediction using various technologies like satellite imagery and sensor networks.
- Variable Rate Technology (VRT): Increasing use of VRT for optimized fertilizer and pesticide application, leading to improved efficiency and reduced environmental impact.
- Precision Farming: High adoption rate due to demonstrable improvements in farm productivity, resource use efficiency and improved profitability.
- Artificial Intelligence (AI): Growing use of AI in various applications, including yield prediction, disease detection, and farm management decision support.
- Drone Analytics: Rapid growth in the utilization of drone technology for farm surveillance and precision data acquisition.
Digital Agriculture Market Product Innovations
Recent innovations include AI-powered crop disease detection systems offering early warnings and precise treatment recommendations, autonomous tractors providing greater efficiency and reduced labor costs, and cloud-based platforms integrating data from various sources to offer comprehensive farm management solutions. These advancements emphasize user-friendly interfaces, data security, and seamless integration with existing farm equipment. Unique selling propositions often center around improved accuracy, increased efficiency, and reduced environmental impact.
Propelling Factors for Digital Agriculture Market Growth
The market’s growth is primarily fueled by technological advancements leading to more accurate, efficient, and sustainable agricultural practices. Economic factors such as rising food prices and labor shortages are also driving the adoption of labor-saving technology. Furthermore, supportive government policies and incentives are encouraging farmers to adopt digital solutions.
Obstacles in the Digital Agriculture Market Market
High initial investment costs, lack of digital literacy among farmers, and concerns about data security and privacy pose significant barriers to wider adoption. Interoperability challenges between different digital systems and inconsistent internet connectivity in rural areas also hinder the market's growth.
Future Opportunities in Digital Agriculture Market
Expansion into developing economies, development of low-cost, user-friendly solutions, and the integration of blockchain technology for enhanced traceability and transparency present significant opportunities. The increasing demand for sustainable agriculture and precision livestock farming will further fuel market growth.
Major Players in the Digital Agriculture Market Ecosystem
- AGCO Corporation
- Microsoft Corporation
- Small Robot Company
- Easytosee Agtech
- Hummingbird Technologies Limited
- DTN (CLEAR AG SOLUTIONS)
- Conservis Corporation
- Case IH Agriculture (CNH Industrial America LLC)
- Raven Industries
- Deere & Company
- IBM Corporation
- Topcon Positioning Systems
- Trimble Inc
- Gamaya SA
- AgEagle Aerial Systems Inc
- Bayer CropScience AG
Key Developments in Digital Agriculture Market Industry
- January 2023: Deere & Company launched a new precision farming platform integrating AI-powered analytics.
- June 2022: Microsoft partnered with several agricultural companies to expand its cloud-based farm management solutions.
- October 2021: Trimble Inc. acquired a precision irrigation company, expanding its portfolio of water management solutions.
- (Add further developments with year/month and impact)
Strategic Digital Agriculture Market Market Forecast
The Digital Agriculture market is poised for significant growth, driven by ongoing technological advancements, increasing awareness among farmers of the benefits of precision agriculture, and supportive government policies. The market's future potential lies in the expansion of digital solutions to emerging markets, the development of innovative applications utilizing artificial intelligence and machine learning, and the integration of data from diverse sources to provide comprehensive farm management solutions, leading to improved farm productivity, resource efficiency, and sustainable agriculture practices.
Digital Agriculture Market Segmentation
- 1. Production Analysis
- 2. Consumption Analysis
- 3. Import Market Analysis (Value & Volume)
- 4. Export Market Analysis (Value & Volume)
- 5. Price Trend Analysis
Digital Agriculture Market Segmentation By Geography
-
1. North America
- 1.1. United States
- 1.2. Canada
- 1.3. Mexico
-
2. South America
- 2.1. Brazil
- 2.2. Argentina
- 2.3. Rest of South America
-
3. Europe
- 3.1. United Kingdom
- 3.2. Germany
- 3.3. France
- 3.4. Italy
- 3.5. Spain
- 3.6. Russia
- 3.7. Benelux
- 3.8. Nordics
- 3.9. Rest of Europe
-
4. Middle East & Africa
- 4.1. Turkey
- 4.2. Israel
- 4.3. GCC
- 4.4. North Africa
- 4.5. South Africa
- 4.6. Rest of Middle East & Africa
-
5. Asia Pacific
- 5.1. China
- 5.2. India
- 5.3. Japan
- 5.4. South Korea
- 5.5. ASEAN
- 5.6. Oceania
- 5.7. Rest of Asia Pacific
Digital Agriculture Market Regional Market Share
Geographic Coverage of Digital Agriculture Market
Digital Agriculture Market REPORT HIGHLIGHTS
| Aspects | Details |
|---|---|
| Study Period | 2020-2034 |
| Base Year | 2025 |
| Estimated Year | 2026 |
| Forecast Period | 2026-2034 |
| Historical Period | 2020-2025 |
| Growth Rate | CAGR of 10.50% from 2020-2034 |
| Segmentation |
|
Table of Contents
- 1. Introduction
- 1.1. Research Scope
- 1.2. Market Segmentation
- 1.3. Research Objective
- 1.4. Definitions and Assumptions
- 2. Executive Summary
- 2.1. Market Snapshot
- 3. Market Dynamics
- 3.1. Market Drivers
- 3.2. Market Restrains
- 3.3. Market Trends
- 3.4. Market Opportunities
- 4. Market Factor Analysis
- 4.1. Porters Five Forces
- 4.1.1. Bargaining Power of Suppliers
- 4.1.2. Bargaining Power of Buyers
- 4.1.3. Threat of New Entrants
- 4.1.4. Threat of Substitutes
- 4.1.5. Competitive Rivalry
- 4.2. PESTEL analysis
- 4.3. BCG Analysis
- 4.3.1. Stars (High Growth, High Market Share)
- 4.3.2. Cash Cows (Low Growth, High Market Share)
- 4.3.3. Question Mark (High Growth, Low Market Share)
- 4.3.4. Dogs (Low Growth, Low Market Share)
- 4.4. Ansoff Matrix Analysis
- 4.5. Supply Chain Analysis
- 4.6. Regulatory Landscape
- 4.7. Current Market Potential and Opportunity Assessment (TAM–SAM–SOM Framework)
- 4.8. DMV Analyst Note
- 4.1. Porters Five Forces
- 5. Market Analysis, Insights and Forecast 2021-2033
- 5.1. Market Analysis, Insights and Forecast - by Production Analysis
- 5.2. Market Analysis, Insights and Forecast - by Consumption Analysis
- 5.3. Market Analysis, Insights and Forecast - by Import Market Analysis (Value & Volume)
- 5.4. Market Analysis, Insights and Forecast - by Export Market Analysis (Value & Volume)
- 5.5. Market Analysis, Insights and Forecast - by Price Trend Analysis
- 5.6. Market Analysis, Insights and Forecast - by Region
- 5.6.1. North America
- 5.6.2. South America
- 5.6.3. Europe
- 5.6.4. Middle East & Africa
- 5.6.5. Asia Pacific
- 6. Global Digital Agriculture Market Analysis, Insights and Forecast, 2021-2033
- 6.1. Market Analysis, Insights and Forecast - by Production Analysis
- 6.2. Market Analysis, Insights and Forecast - by Consumption Analysis
- 6.3. Market Analysis, Insights and Forecast - by Import Market Analysis (Value & Volume)
- 6.4. Market Analysis, Insights and Forecast - by Export Market Analysis (Value & Volume)
- 6.5. Market Analysis, Insights and Forecast - by Price Trend Analysis
- 7. North America Digital Agriculture Market Analysis, Insights and Forecast, 2020-2032
- 7.1. Market Analysis, Insights and Forecast - by Production Analysis
- 7.2. Market Analysis, Insights and Forecast - by Consumption Analysis
- 7.3. Market Analysis, Insights and Forecast - by Import Market Analysis (Value & Volume)
- 7.4. Market Analysis, Insights and Forecast - by Export Market Analysis (Value & Volume)
- 7.5. Market Analysis, Insights and Forecast - by Price Trend Analysis
- 8. South America Digital Agriculture Market Analysis, Insights and Forecast, 2020-2032
- 8.1. Market Analysis, Insights and Forecast - by Production Analysis
- 8.2. Market Analysis, Insights and Forecast - by Consumption Analysis
- 8.3. Market Analysis, Insights and Forecast - by Import Market Analysis (Value & Volume)
- 8.4. Market Analysis, Insights and Forecast - by Export Market Analysis (Value & Volume)
- 8.5. Market Analysis, Insights and Forecast - by Price Trend Analysis
- 9. Europe Digital Agriculture Market Analysis, Insights and Forecast, 2020-2032
- 9.1. Market Analysis, Insights and Forecast - by Production Analysis
- 9.2. Market Analysis, Insights and Forecast - by Consumption Analysis
- 9.3. Market Analysis, Insights and Forecast - by Import Market Analysis (Value & Volume)
- 9.4. Market Analysis, Insights and Forecast - by Export Market Analysis (Value & Volume)
- 9.5. Market Analysis, Insights and Forecast - by Price Trend Analysis
- 10. Middle East & Africa Digital Agriculture Market Analysis, Insights and Forecast, 2020-2032
- 10.1. Market Analysis, Insights and Forecast - by Production Analysis
- 10.2. Market Analysis, Insights and Forecast - by Consumption Analysis
- 10.3. Market Analysis, Insights and Forecast - by Import Market Analysis (Value & Volume)
- 10.4. Market Analysis, Insights and Forecast - by Export Market Analysis (Value & Volume)
- 10.5. Market Analysis, Insights and Forecast - by Price Trend Analysis
- 11. Asia Pacific Digital Agriculture Market Analysis, Insights and Forecast, 2020-2032
- 11.1. Market Analysis, Insights and Forecast - by Production Analysis
- 11.2. Market Analysis, Insights and Forecast - by Consumption Analysis
- 11.3. Market Analysis, Insights and Forecast - by Import Market Analysis (Value & Volume)
- 11.4. Market Analysis, Insights and Forecast - by Export Market Analysis (Value & Volume)
- 11.5. Market Analysis, Insights and Forecast - by Price Trend Analysis
- 12. Competitive Analysis
- 12.1. Company Profiles
- 12.1.1 AGCO Corporation
- 12.1.1.1. Company Overview
- 12.1.1.2. Products
- 12.1.1.3. Company Financials
- 12.1.1.4. SWOT Analysis
- 12.1.2 Microsoft Corporation
- 12.1.2.1. Company Overview
- 12.1.2.2. Products
- 12.1.2.3. Company Financials
- 12.1.2.4. SWOT Analysis
- 12.1.3 Small Robot Company
- 12.1.3.1. Company Overview
- 12.1.3.2. Products
- 12.1.3.3. Company Financials
- 12.1.3.4. SWOT Analysis
- 12.1.4 Easytosee Agtech
- 12.1.4.1. Company Overview
- 12.1.4.2. Products
- 12.1.4.3. Company Financials
- 12.1.4.4. SWOT Analysis
- 12.1.5 Hummingbird Technologies Limited
- 12.1.5.1. Company Overview
- 12.1.5.2. Products
- 12.1.5.3. Company Financials
- 12.1.5.4. SWOT Analysis
- 12.1.6 DTN (CLEAR AG SOLUTIONS)
- 12.1.6.1. Company Overview
- 12.1.6.2. Products
- 12.1.6.3. Company Financials
- 12.1.6.4. SWOT Analysis
- 12.1.7 Conservis Corporation
- 12.1.7.1. Company Overview
- 12.1.7.2. Products
- 12.1.7.3. Company Financials
- 12.1.7.4. SWOT Analysis
- 12.1.8 Case IH Agriculture (CNH Industrial America LLC )
- 12.1.8.1. Company Overview
- 12.1.8.2. Products
- 12.1.8.3. Company Financials
- 12.1.8.4. SWOT Analysis
- 12.1.9 Raven Industries
- 12.1.9.1. Company Overview
- 12.1.9.2. Products
- 12.1.9.3. Company Financials
- 12.1.9.4. SWOT Analysis
- 12.1.10 Deere & Company
- 12.1.10.1. Company Overview
- 12.1.10.2. Products
- 12.1.10.3. Company Financials
- 12.1.10.4. SWOT Analysis
- 12.1.11 IBM Corporation
- 12.1.11.1. Company Overview
- 12.1.11.2. Products
- 12.1.11.3. Company Financials
- 12.1.11.4. SWOT Analysis
- 12.1.12 Topcon Positioning Systems
- 12.1.12.1. Company Overview
- 12.1.12.2. Products
- 12.1.12.3. Company Financials
- 12.1.12.4. SWOT Analysis
- 12.1.13 Trimble Inc
- 12.1.13.1. Company Overview
- 12.1.13.2. Products
- 12.1.13.3. Company Financials
- 12.1.13.4. SWOT Analysis
- 12.1.14 Gamaya SA
- 12.1.14.1. Company Overview
- 12.1.14.2. Products
- 12.1.14.3. Company Financials
- 12.1.14.4. SWOT Analysis
- 12.1.15 AgEagle Aerial Systems Inc
- 12.1.15.1. Company Overview
- 12.1.15.2. Products
- 12.1.15.3. Company Financials
- 12.1.15.4. SWOT Analysis
- 12.1.16 Bayer CropScience AG
- 12.1.16.1. Company Overview
- 12.1.16.2. Products
- 12.1.16.3. Company Financials
- 12.1.16.4. SWOT Analysis
- 12.1.1 AGCO Corporation
- 12.2. Market Entropy
- 12.2.1 Company's Key Areas Served
- 12.2.2 Recent Developments
- 12.3. Company Market Share Analysis 2025
- 12.3.1 Top 5 Companies Market Share Analysis
- 12.3.2 Top 3 Companies Market Share Analysis
- 12.4. List of Potential Customers
- 13. Research Methodology
List of Figures
- Figure 1: Global Digital Agriculture Market Revenue Breakdown (Million, %) by Region 2025 & 2033
- Figure 2: North America Digital Agriculture Market Revenue (Million), by Production Analysis 2025 & 2033
- Figure 3: North America Digital Agriculture Market Revenue Share (%), by Production Analysis 2025 & 2033
- Figure 4: North America Digital Agriculture Market Revenue (Million), by Consumption Analysis 2025 & 2033
- Figure 5: North America Digital Agriculture Market Revenue Share (%), by Consumption Analysis 2025 & 2033
- Figure 6: North America Digital Agriculture Market Revenue (Million), by Import Market Analysis (Value & Volume) 2025 & 2033
- Figure 7: North America Digital Agriculture Market Revenue Share (%), by Import Market Analysis (Value & Volume) 2025 & 2033
- Figure 8: North America Digital Agriculture Market Revenue (Million), by Export Market Analysis (Value & Volume) 2025 & 2033
- Figure 9: North America Digital Agriculture Market Revenue Share (%), by Export Market Analysis (Value & Volume) 2025 & 2033
- Figure 10: North America Digital Agriculture Market Revenue (Million), by Price Trend Analysis 2025 & 2033
- Figure 11: North America Digital Agriculture Market Revenue Share (%), by Price Trend Analysis 2025 & 2033
- Figure 12: North America Digital Agriculture Market Revenue (Million), by Country 2025 & 2033
- Figure 13: North America Digital Agriculture Market Revenue Share (%), by Country 2025 & 2033
- Figure 14: South America Digital Agriculture Market Revenue (Million), by Production Analysis 2025 & 2033
- Figure 15: South America Digital Agriculture Market Revenue Share (%), by Production Analysis 2025 & 2033
- Figure 16: South America Digital Agriculture Market Revenue (Million), by Consumption Analysis 2025 & 2033
- Figure 17: South America Digital Agriculture Market Revenue Share (%), by Consumption Analysis 2025 & 2033
- Figure 18: South America Digital Agriculture Market Revenue (Million), by Import Market Analysis (Value & Volume) 2025 & 2033
- Figure 19: South America Digital Agriculture Market Revenue Share (%), by Import Market Analysis (Value & Volume) 2025 & 2033
- Figure 20: South America Digital Agriculture Market Revenue (Million), by Export Market Analysis (Value & Volume) 2025 & 2033
- Figure 21: South America Digital Agriculture Market Revenue Share (%), by Export Market Analysis (Value & Volume) 2025 & 2033
- Figure 22: South America Digital Agriculture Market Revenue (Million), by Price Trend Analysis 2025 & 2033
- Figure 23: South America Digital Agriculture Market Revenue Share (%), by Price Trend Analysis 2025 & 2033
- Figure 24: South America Digital Agriculture Market Revenue (Million), by Country 2025 & 2033
- Figure 25: South America Digital Agriculture Market Revenue Share (%), by Country 2025 & 2033
- Figure 26: Europe Digital Agriculture Market Revenue (Million), by Production Analysis 2025 & 2033
- Figure 27: Europe Digital Agriculture Market Revenue Share (%), by Production Analysis 2025 & 2033
- Figure 28: Europe Digital Agriculture Market Revenue (Million), by Consumption Analysis 2025 & 2033
- Figure 29: Europe Digital Agriculture Market Revenue Share (%), by Consumption Analysis 2025 & 2033
- Figure 30: Europe Digital Agriculture Market Revenue (Million), by Import Market Analysis (Value & Volume) 2025 & 2033
- Figure 31: Europe Digital Agriculture Market Revenue Share (%), by Import Market Analysis (Value & Volume) 2025 & 2033
- Figure 32: Europe Digital Agriculture Market Revenue (Million), by Export Market Analysis (Value & Volume) 2025 & 2033
- Figure 33: Europe Digital Agriculture Market Revenue Share (%), by Export Market Analysis (Value & Volume) 2025 & 2033
- Figure 34: Europe Digital Agriculture Market Revenue (Million), by Price Trend Analysis 2025 & 2033
- Figure 35: Europe Digital Agriculture Market Revenue Share (%), by Price Trend Analysis 2025 & 2033
- Figure 36: Europe Digital Agriculture Market Revenue (Million), by Country 2025 & 2033
- Figure 37: Europe Digital Agriculture Market Revenue Share (%), by Country 2025 & 2033
- Figure 38: Middle East & Africa Digital Agriculture Market Revenue (Million), by Production Analysis 2025 & 2033
- Figure 39: Middle East & Africa Digital Agriculture Market Revenue Share (%), by Production Analysis 2025 & 2033
- Figure 40: Middle East & Africa Digital Agriculture Market Revenue (Million), by Consumption Analysis 2025 & 2033
- Figure 41: Middle East & Africa Digital Agriculture Market Revenue Share (%), by Consumption Analysis 2025 & 2033
- Figure 42: Middle East & Africa Digital Agriculture Market Revenue (Million), by Import Market Analysis (Value & Volume) 2025 & 2033
- Figure 43: Middle East & Africa Digital Agriculture Market Revenue Share (%), by Import Market Analysis (Value & Volume) 2025 & 2033
- Figure 44: Middle East & Africa Digital Agriculture Market Revenue (Million), by Export Market Analysis (Value & Volume) 2025 & 2033
- Figure 45: Middle East & Africa Digital Agriculture Market Revenue Share (%), by Export Market Analysis (Value & Volume) 2025 & 2033
- Figure 46: Middle East & Africa Digital Agriculture Market Revenue (Million), by Price Trend Analysis 2025 & 2033
- Figure 47: Middle East & Africa Digital Agriculture Market Revenue Share (%), by Price Trend Analysis 2025 & 2033
- Figure 48: Middle East & Africa Digital Agriculture Market Revenue (Million), by Country 2025 & 2033
- Figure 49: Middle East & Africa Digital Agriculture Market Revenue Share (%), by Country 2025 & 2033
- Figure 50: Asia Pacific Digital Agriculture Market Revenue (Million), by Production Analysis 2025 & 2033
- Figure 51: Asia Pacific Digital Agriculture Market Revenue Share (%), by Production Analysis 2025 & 2033
- Figure 52: Asia Pacific Digital Agriculture Market Revenue (Million), by Consumption Analysis 2025 & 2033
- Figure 53: Asia Pacific Digital Agriculture Market Revenue Share (%), by Consumption Analysis 2025 & 2033
- Figure 54: Asia Pacific Digital Agriculture Market Revenue (Million), by Import Market Analysis (Value & Volume) 2025 & 2033
- Figure 55: Asia Pacific Digital Agriculture Market Revenue Share (%), by Import Market Analysis (Value & Volume) 2025 & 2033
- Figure 56: Asia Pacific Digital Agriculture Market Revenue (Million), by Export Market Analysis (Value & Volume) 2025 & 2033
- Figure 57: Asia Pacific Digital Agriculture Market Revenue Share (%), by Export Market Analysis (Value & Volume) 2025 & 2033
- Figure 58: Asia Pacific Digital Agriculture Market Revenue (Million), by Price Trend Analysis 2025 & 2033
- Figure 59: Asia Pacific Digital Agriculture Market Revenue Share (%), by Price Trend Analysis 2025 & 2033
- Figure 60: Asia Pacific Digital Agriculture Market Revenue (Million), by Country 2025 & 2033
- Figure 61: Asia Pacific Digital Agriculture Market Revenue Share (%), by Country 2025 & 2033
List of Tables
- Table 1: Global Digital Agriculture Market Revenue Million Forecast, by Production Analysis 2020 & 2033
- Table 2: Global Digital Agriculture Market Revenue Million Forecast, by Consumption Analysis 2020 & 2033
- Table 3: Global Digital Agriculture Market Revenue Million Forecast, by Import Market Analysis (Value & Volume) 2020 & 2033
- Table 4: Global Digital Agriculture Market Revenue Million Forecast, by Export Market Analysis (Value & Volume) 2020 & 2033
- Table 5: Global Digital Agriculture Market Revenue Million Forecast, by Price Trend Analysis 2020 & 2033
- Table 6: Global Digital Agriculture Market Revenue Million Forecast, by Region 2020 & 2033
- Table 7: Global Digital Agriculture Market Revenue Million Forecast, by Production Analysis 2020 & 2033
- Table 8: Global Digital Agriculture Market Revenue Million Forecast, by Consumption Analysis 2020 & 2033
- Table 9: Global Digital Agriculture Market Revenue Million Forecast, by Import Market Analysis (Value & Volume) 2020 & 2033
- Table 10: Global Digital Agriculture Market Revenue Million Forecast, by Export Market Analysis (Value & Volume) 2020 & 2033
- Table 11: Global Digital Agriculture Market Revenue Million Forecast, by Price Trend Analysis 2020 & 2033
- Table 12: Global Digital Agriculture Market Revenue Million Forecast, by Country 2020 & 2033
- Table 13: United States Digital Agriculture Market Revenue (Million) Forecast, by Application 2020 & 2033
- Table 14: Canada Digital Agriculture Market Revenue (Million) Forecast, by Application 2020 & 2033
- Table 15: Mexico Digital Agriculture Market Revenue (Million) Forecast, by Application 2020 & 2033
- Table 16: Global Digital Agriculture Market Revenue Million Forecast, by Production Analysis 2020 & 2033
- Table 17: Global Digital Agriculture Market Revenue Million Forecast, by Consumption Analysis 2020 & 2033
- Table 18: Global Digital Agriculture Market Revenue Million Forecast, by Import Market Analysis (Value & Volume) 2020 & 2033
- Table 19: Global Digital Agriculture Market Revenue Million Forecast, by Export Market Analysis (Value & Volume) 2020 & 2033
- Table 20: Global Digital Agriculture Market Revenue Million Forecast, by Price Trend Analysis 2020 & 2033
- Table 21: Global Digital Agriculture Market Revenue Million Forecast, by Country 2020 & 2033
- Table 22: Brazil Digital Agriculture Market Revenue (Million) Forecast, by Application 2020 & 2033
- Table 23: Argentina Digital Agriculture Market Revenue (Million) Forecast, by Application 2020 & 2033
- Table 24: Rest of South America Digital Agriculture Market Revenue (Million) Forecast, by Application 2020 & 2033
- Table 25: Global Digital Agriculture Market Revenue Million Forecast, by Production Analysis 2020 & 2033
- Table 26: Global Digital Agriculture Market Revenue Million Forecast, by Consumption Analysis 2020 & 2033
- Table 27: Global Digital Agriculture Market Revenue Million Forecast, by Import Market Analysis (Value & Volume) 2020 & 2033
- Table 28: Global Digital Agriculture Market Revenue Million Forecast, by Export Market Analysis (Value & Volume) 2020 & 2033
- Table 29: Global Digital Agriculture Market Revenue Million Forecast, by Price Trend Analysis 2020 & 2033
- Table 30: Global Digital Agriculture Market Revenue Million Forecast, by Country 2020 & 2033
- Table 31: United Kingdom Digital Agriculture Market Revenue (Million) Forecast, by Application 2020 & 2033
- Table 32: Germany Digital Agriculture Market Revenue (Million) Forecast, by Application 2020 & 2033
- Table 33: France Digital Agriculture Market Revenue (Million) Forecast, by Application 2020 & 2033
- Table 34: Italy Digital Agriculture Market Revenue (Million) Forecast, by Application 2020 & 2033
- Table 35: Spain Digital Agriculture Market Revenue (Million) Forecast, by Application 2020 & 2033
- Table 36: Russia Digital Agriculture Market Revenue (Million) Forecast, by Application 2020 & 2033
- Table 37: Benelux Digital Agriculture Market Revenue (Million) Forecast, by Application 2020 & 2033
- Table 38: Nordics Digital Agriculture Market Revenue (Million) Forecast, by Application 2020 & 2033
- Table 39: Rest of Europe Digital Agriculture Market Revenue (Million) Forecast, by Application 2020 & 2033
- Table 40: Global Digital Agriculture Market Revenue Million Forecast, by Production Analysis 2020 & 2033
- Table 41: Global Digital Agriculture Market Revenue Million Forecast, by Consumption Analysis 2020 & 2033
- Table 42: Global Digital Agriculture Market Revenue Million Forecast, by Import Market Analysis (Value & Volume) 2020 & 2033
- Table 43: Global Digital Agriculture Market Revenue Million Forecast, by Export Market Analysis (Value & Volume) 2020 & 2033
- Table 44: Global Digital Agriculture Market Revenue Million Forecast, by Price Trend Analysis 2020 & 2033
- Table 45: Global Digital Agriculture Market Revenue Million Forecast, by Country 2020 & 2033
- Table 46: Turkey Digital Agriculture Market Revenue (Million) Forecast, by Application 2020 & 2033
- Table 47: Israel Digital Agriculture Market Revenue (Million) Forecast, by Application 2020 & 2033
- Table 48: GCC Digital Agriculture Market Revenue (Million) Forecast, by Application 2020 & 2033
- Table 49: North Africa Digital Agriculture Market Revenue (Million) Forecast, by Application 2020 & 2033
- Table 50: South Africa Digital Agriculture Market Revenue (Million) Forecast, by Application 2020 & 2033
- Table 51: Rest of Middle East & Africa Digital Agriculture Market Revenue (Million) Forecast, by Application 2020 & 2033
- Table 52: Global Digital Agriculture Market Revenue Million Forecast, by Production Analysis 2020 & 2033
- Table 53: Global Digital Agriculture Market Revenue Million Forecast, by Consumption Analysis 2020 & 2033
- Table 54: Global Digital Agriculture Market Revenue Million Forecast, by Import Market Analysis (Value & Volume) 2020 & 2033
- Table 55: Global Digital Agriculture Market Revenue Million Forecast, by Export Market Analysis (Value & Volume) 2020 & 2033
- Table 56: Global Digital Agriculture Market Revenue Million Forecast, by Price Trend Analysis 2020 & 2033
- Table 57: Global Digital Agriculture Market Revenue Million Forecast, by Country 2020 & 2033
- Table 58: China Digital Agriculture Market Revenue (Million) Forecast, by Application 2020 & 2033
- Table 59: India Digital Agriculture Market Revenue (Million) Forecast, by Application 2020 & 2033
- Table 60: Japan Digital Agriculture Market Revenue (Million) Forecast, by Application 2020 & 2033
- Table 61: South Korea Digital Agriculture Market Revenue (Million) Forecast, by Application 2020 & 2033
- Table 62: ASEAN Digital Agriculture Market Revenue (Million) Forecast, by Application 2020 & 2033
- Table 63: Oceania Digital Agriculture Market Revenue (Million) Forecast, by Application 2020 & 2033
- Table 64: Rest of Asia Pacific Digital Agriculture Market Revenue (Million) Forecast, by Application 2020 & 2033
Frequently Asked Questions
1. What is the projected Compound Annual Growth Rate (CAGR) of the Digital Agriculture Market?
The projected CAGR is approximately 10.50%.
2. Which companies are prominent players in the Digital Agriculture Market?
Key companies in the market include AGCO Corporation, Microsoft Corporation, Small Robot Company, Easytosee Agtech, Hummingbird Technologies Limited, DTN (CLEAR AG SOLUTIONS), Conservis Corporation, Case IH Agriculture (CNH Industrial America LLC ), Raven Industries, Deere & Company, IBM Corporation, Topcon Positioning Systems, Trimble Inc, Gamaya SA, AgEagle Aerial Systems Inc, Bayer CropScience AG.
3. What are the main segments of the Digital Agriculture Market?
The market segments include Production Analysis, Consumption Analysis, Import Market Analysis (Value & Volume), Export Market Analysis (Value & Volume), Price Trend Analysis.
4. Can you provide details about the market size?
The market size is estimated to be USD 20.01 Million as of 2022.
5. What are some drivers contributing to market growth?
; Awareness About Health Benefits Associated With Pecan Consumption; Wide Application of Pecan.
6. What are the notable trends driving market growth?
Increasing Pressure for Higher Productivity and Improved Crop Health.
7. Are there any restraints impacting market growth?
; Volatility in the Prices; Adverse Weather Conditions Affecting Yield.
8. Can you provide examples of recent developments in the market?
N/A
9. What pricing options are available for accessing the report?
Pricing options include single-user, multi-user, and enterprise licenses priced at USD 4750, USD 5250, and USD 8750 respectively.
10. Is the market size provided in terms of value or volume?
The market size is provided in terms of value, measured in Million.
11. Are there any specific market keywords associated with the report?
Yes, the market keyword associated with the report is "Digital Agriculture Market," which aids in identifying and referencing the specific market segment covered.
12. How do I determine which pricing option suits my needs best?
The pricing options vary based on user requirements and access needs. Individual users may opt for single-user licenses, while businesses requiring broader access may choose multi-user or enterprise licenses for cost-effective access to the report.
13. Are there any additional resources or data provided in the Digital Agriculture Market report?
While the report offers comprehensive insights, it's advisable to review the specific contents or supplementary materials provided to ascertain if additional resources or data are available.
14. How can I stay updated on further developments or reports in the Digital Agriculture Market?
To stay informed about further developments, trends, and reports in the Digital Agriculture Market, consider subscribing to industry newsletters, following relevant companies and organizations, or regularly checking reputable industry news sources and publications.
Methodology
Step 1 - Identification of Relevant Samples Size from Population Database


Step 2 - Approaches for Defining Global Market Size (Value, Volume* & Price*)

Note*: In applicable scenarios
Step 3 - Data Sources
Primary Research
- Web Analytics
- Survey Reports
- Research Institute
- Latest Research Reports
- Opinion Leaders
Secondary Research
- Annual Reports
- White Paper
- Latest Press Release
- Industry Association
- Paid Database
- Investor Presentations

Step 4 - Data Triangulation
Involves using different sources of information in order to increase the validity of a study
These sources are likely to be stakeholders in a program - participants, other researchers, program staff, other community members, and so on.
Then we put all data in single framework & apply various statistical tools to find out the dynamic on the market.
During the analysis stage, feedback from the stakeholder groups would be compared to determine areas of agreement as well as areas of divergence