

Key Insights
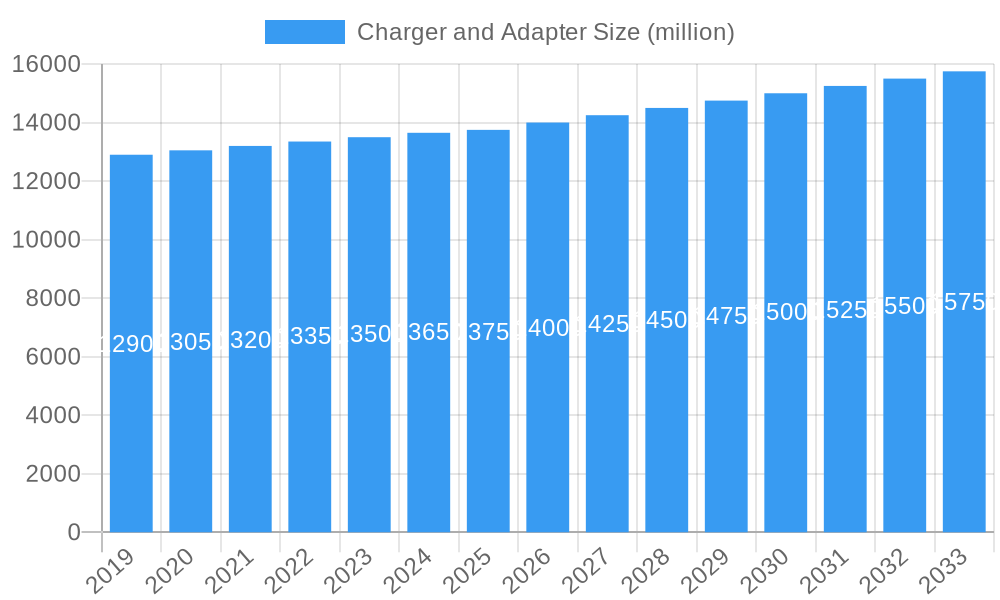
The global Charger and Adapter market is poised for steady growth, with an estimated market size of $13,750 million in 2025, projected to expand at a Compound Annual Growth Rate (CAGR) of 2.3% through 2033. This sustained expansion is driven by the ubiquitous demand for portable electronic devices and the continuous innovation in their power requirements. Key growth catalysts include the surging adoption of smartphones and tablets, the increasing complexity and power demands of consumer electronics like gaming consoles and smart home devices, and the expanding use of specialized chargers in industrial equipment and medical devices. The ongoing trend towards miniaturization and higher power density in charging solutions, alongside the growing emphasis on energy efficiency and safety standards, are further propelling market development. Moreover, the burgeoning network communication sector, requiring robust and reliable power adapters for routers, switches, and other infrastructure, represents a significant growth avenue.
Charger and Adapter Market Size (In Billion)
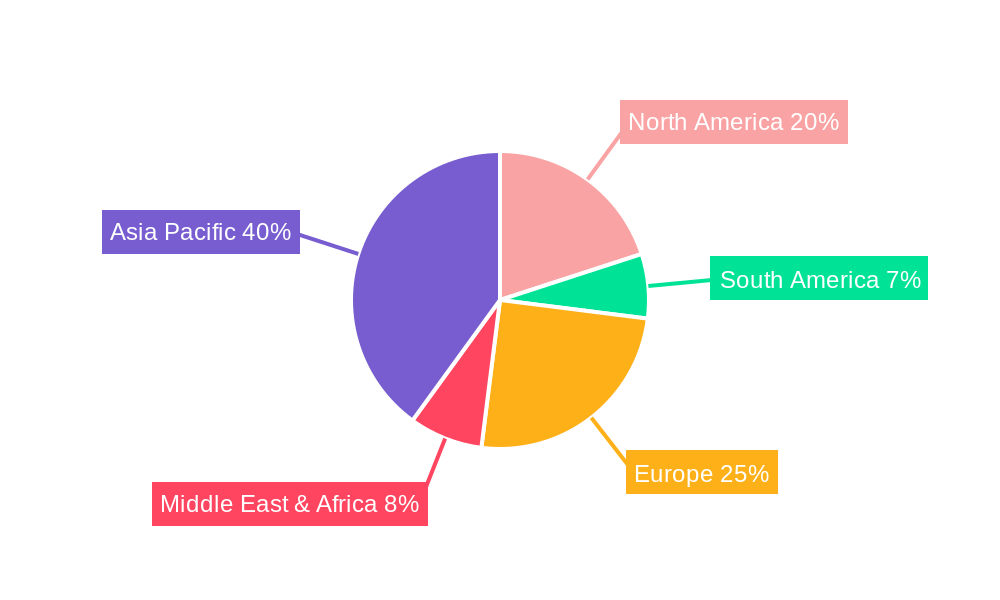
The market's segmentation reveals a diverse application landscape, with Computers (Desktops and Laptops) and Smartphones leading the adoption of chargers and adapters due to their high volume and continuous upgrade cycles. Consumer Electronics and Network Communication Equipment also represent substantial market segments. In terms of power output, the 51W-100W category is likely to see robust growth as more powerful devices like gaming laptops and high-performance tablets enter the market. Geographically, Asia Pacific is expected to dominate the market share, driven by its massive manufacturing base for electronics and a rapidly growing consumer base. North America and Europe will continue to be significant markets, fueled by technological advancements and a high disposable income for premium electronic gadgets. While the market benefits from strong demand, potential restraints could emerge from an increasing focus on wireless charging technologies, which might reduce the demand for traditional wired chargers and adapters in certain applications, and evolving regulatory landscapes concerning power efficiency and material sourcing.
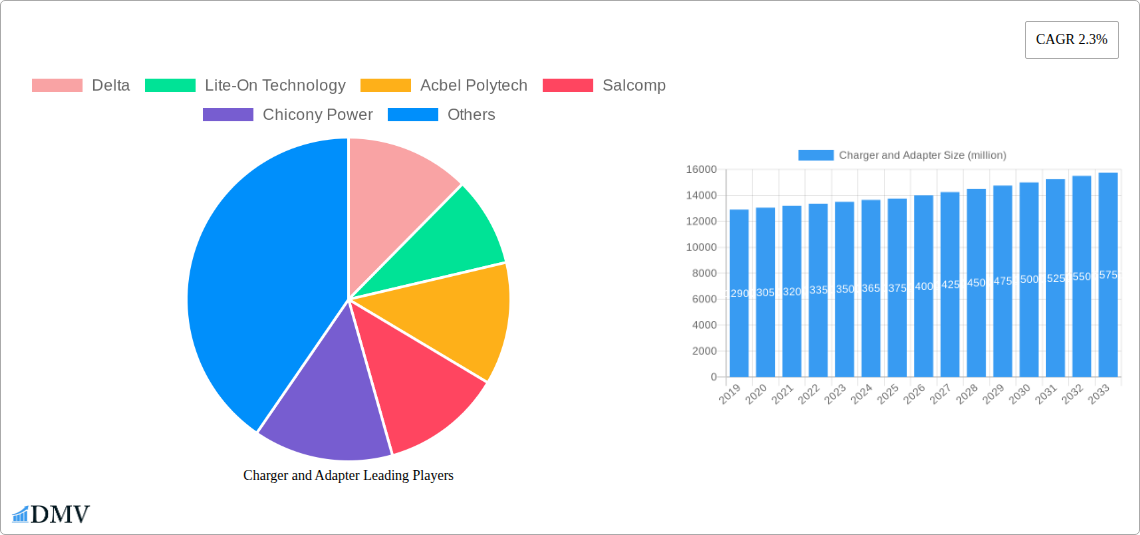
Charger and Adapter Company Market Share
Charger and Adapter Market Composition & Trends
This comprehensive report delves into the dynamic Charger and Adapter market, providing critical insights into its structure, key trends, and future trajectory. The global charger and adapter market is characterized by a moderate level of concentration, with key players like Delta, Lite-On Technology, Acbel Polytech, Salcomp, Chicony Power, Artesyn, Flextronics, Mean Well, TDK Lambda, Phihong, FSP Group, Shenzhen Honor Electronic, Shenzhen Click Technology, Shenzhen Jingquanhua Electronics, and XX commanding significant market share. In 2025, the estimated market share distribution sees Delta leading with xx% and Lite-On Technology following with xx%. Innovation remains a primary catalyst, driven by the demand for faster charging technologies like GaN (Gallium Nitride) and USB Power Delivery (USB PD). Regulatory landscapes, including energy efficiency standards (e.g., Energy Star, CEC) and safety certifications (e.g., UL, CE), are increasingly shaping product development and market access. Substitute products, such as integrated charging solutions within devices, pose a minor threat, but the ubiquity of external adapters for various applications ensures continued demand. End-user profiles are diverse, spanning computers (desktops and laptops), tablets, smartphones, printers, consumer electronics, network communication equipment, security monitoring, industrial equipment, medical equipment, and LED lighting. Mergers and acquisitions (M&A) activities, while not rampant, are strategically focused on expanding technological capabilities and market reach. In 2024, a notable M&A deal involved [Company A] acquiring [Company B] for an estimated value of $xx million, aiming to bolster its high-power adapter portfolio. The report meticulously analyzes these elements to provide a holistic view of the market's current state.
Charger and Adapter Industry Evolution
The charger and adapter industry has undergone a significant evolutionary journey, fundamentally reshaped by technological advancements, evolving consumer demands, and an increasingly interconnected digital ecosystem. During the historical period of 2019–2024, the market witnessed steady growth, propelled by the widespread adoption of smartphones and the burgeoning popularity of portable computing devices. The base year of 2025 marks a pivotal point, with projections indicating an accelerated growth trajectory. The market size is estimated to reach $xx million in 2025, with a projected compound annual growth rate (CAGR) of xx% during the forecast period of 2025–2033. This expansion is directly fueled by continuous innovation. The introduction and rapid adoption of USB Type-C ports have become a dominant force, enabling a universal charging standard across a multitude of devices, from smartphones and tablets to laptops and even some consumer electronics. Furthermore, the emergence and widespread commercialization of Gallium Nitride (GaN) technology have been game-changers. GaN-based chargers offer superior power efficiency, reduced heat generation, and significantly smaller form factors compared to traditional silicon-based counterparts. This technological leap has enabled the development of ultra-compact and high-wattage chargers, catering to the demand for more portable and powerful charging solutions.
Consumer demand has also shifted dramatically. The expectation for faster charging speeds has become paramount, with consumers actively seeking chargers that can replenish their device batteries in the shortest possible time. This trend is evident in the increasing demand for fast chargers across all segments, particularly for smartphones and laptops. The proliferation of connected devices, including smart home devices, wearables, and advanced network communication equipment, has further broadened the application spectrum for chargers and adapters, creating new avenues for market expansion. The shift towards wireless charging solutions, while still a developing segment, also influences the overall adapter market by driving the need for compatible power sources and adapters that can support both wired and wireless charging functionalities. The industry's ability to adapt to these dynamic shifts in technology and consumer preference will be crucial for sustained growth. The increasing focus on energy efficiency and sustainability is also driving the development of eco-friendlier charging solutions, further influencing product design and material selection within the industry.
Leading Regions, Countries, or Segments in Charger and Adapter
The global charger and adapter market is experiencing significant regional and segment-specific dominance, driven by a confluence of economic factors, technological adoption rates, and evolving end-user demands. Asia Pacific stands out as the leading region, primarily propelled by the robust manufacturing capabilities and the massive consumer base in countries like China, South Korea, and Japan. This region is a powerhouse for the production of smartphones, tablets, and consumer electronics, which in turn fuels an immense demand for chargers and adapters. The smartphone segment, in particular, continues to be a primary driver of growth within the charger and adapter market. The sheer volume of smartphone users globally, coupled with the increasing sophistication of these devices requiring more powerful and faster charging solutions, makes this segment indispensable. For instance, the adoption of fast charging technologies like Qualcomm Quick Charge and USB Power Delivery is almost universal across mid-range and high-end smartphones, directly translating to a higher demand for compatible, high-wattage chargers.
Within the Application categories, Computers (Desktops and Laptops) also represent a substantial market share. The ongoing trend of remote work and the increasing reliance on portable computing devices for both professional and personal use have sustained the demand for reliable and powerful laptop adapters. The rise of ultrabooks and lightweight laptops, often equipped with USB-C charging, further solidifies this segment's importance. Furthermore, the Consumer Electronics segment, encompassing everything from gaming consoles to smart home devices, continues to expand, creating a diverse and growing demand for specialized chargers and adapters.
Analyzing by Types, the 11W-50W and 51W-100W categories are currently experiencing the most significant traction. These power ranges are ideal for the majority of smartphones, tablets, and a wide array of consumer electronic devices. The increasing battery capacities of modern devices and the demand for faster charging within these power envelopes are key growth drivers. The Above 100W category, while smaller in volume, is experiencing rapid growth due to its critical role in powering high-performance laptops, gaming PCs, and certain industrial equipment. The introduction of GaN technology is making these higher wattage chargers more compact and efficient, driving their adoption.
Key drivers for regional and segment dominance include:
- Investment Trends: Significant foreign direct investment in manufacturing hubs within Asia Pacific, particularly in China, has cemented its position as a production epicenter.
- Regulatory Support: Government initiatives promoting electronics manufacturing and export in various Asian countries have further bolstered their market position.
- Technological Adoption: Regions with high smartphone penetration and rapid adoption of new charging technologies like USB PD and GaN naturally exhibit stronger market performance in relevant segments.
- Consumer Spending Power: Growing disposable incomes in emerging economies contribute to increased demand for electronic devices and, consequently, their associated accessories.
The Network Communication Equipment and Industrial Equipment segments, while niche, are also crucial. The expansion of 5G infrastructure and the increasing complexity of industrial automation necessitate reliable and robust power solutions, driving demand for specialized, high-performance adapters. The Medical Equipment sector, with its stringent safety and reliability requirements, presents a stable, albeit specialized, market for premium adapters.
Charger and Adapter Product Innovations
Product innovation in the charger and adapter market is currently focused on enhancing performance, portability, and user convenience. The integration of Gallium Nitride (GaN) technology has revolutionized power adapter design, enabling significantly smaller form factors and higher power densities. This allows for the creation of ultra-compact, multi-port chargers capable of simultaneously powering multiple devices, such as smartphones, tablets, and laptops, often at their maximum charging speeds. Innovations like smart charging algorithms that optimize power delivery based on device needs and dynamic power allocation for multi-port chargers are becoming standard. Furthermore, the continued development of USB Power Delivery (USB PD) and Qualcomm Quick Charge standards is pushing charging speeds ever higher, with some adapters now exceeding 100W for laptops and other power-hungry devices. The emphasis is also on universal compatibility, with manufacturers striving to create adapters that can efficiently charge a wide range of devices across different brands and protocols.
Propelling Factors for Charger and Adapter Growth
The charger and adapter market is propelled by a confluence of robust growth factors. The relentless proliferation of smartphones, tablets, and other consumer electronics globally is a primary driver, as each device necessitates at least one charging solution. The ongoing demand for faster charging speeds, fueled by consumer desire for convenience and reduced downtime, is spurring the adoption of advanced technologies like GaN and USB Power Delivery. Furthermore, the expansion of the Internet of Things (IoT) and the increasing need for powering network communication equipment and industrial equipment are creating new application frontiers. Regulatory pushes towards energy efficiency are also indirectly benefiting the market by incentivizing the development of more advanced and optimized power adapters.
Obstacles in the Charger and Adapter Market
Despite robust growth, the charger and adapter market faces several significant obstacles. Intensifying competition among manufacturers, particularly from low-cost producers, can lead to price erosion and impact profit margins. Supply chain disruptions, as experienced in recent years, can lead to component shortages and increased lead times, affecting production schedules and market availability. Increasingly stringent regulatory requirements regarding energy efficiency and safety standards, while beneficial for consumers, can add to development costs and complexity for manufacturers. The rapid obsolescence of technology also presents a challenge, as newer, faster charging standards emerge, making existing adapters less desirable. Finally, the growing trend of manufacturers integrating chargers into device packaging for certain product categories, like smartphones, could lead to a decline in the demand for standalone chargers within those specific segments.
Future Opportunities in Charger and Adapter
The future of the charger and adapter market is brimming with promising opportunities. The continued expansion of the 5G network infrastructure and the growing adoption of IoT devices will necessitate a surge in demand for specialized and reliable power solutions for network communication equipment and various connected sensors. The ongoing advancements in electric vehicle (EV) charging technology, though a distinct market, may also see spillover innovations in compact, high-power adapters for smaller EV charging solutions or related accessories. The increasing demand for sustainable and eco-friendly products presents an opportunity for manufacturers to develop chargers made from recycled materials or those with enhanced energy efficiency. The medical equipment sector, with its perpetual need for high-reliability power, continues to offer a stable and growing niche. Furthermore, the development of wireless charging solutions that integrate seamlessly with everyday objects and furniture will open new avenues for power delivery accessories.
Major Players in the Charger and Adapter Ecosystem
- Delta
- Lite-On Technology
- Acbel Polytech
- Salcomp
- Chicony Power
- Artesyn
- Flextronics
- Mean Well
- TDK Lambda
- Phihong
- FSP Group
- Shenzhen Honor Electronic
- Shenzhen Click Technology
- Shenzhen Jingquanhua Electronics
Key Developments in Charger and Adapter Industry
- 2023, Q4: Launch of next-generation GaN-based chargers offering xx% more power in xx% smaller form factors.
- 2024, Q1: Major semiconductor manufacturers announce breakthroughs in power management ICs, enabling more efficient and compact adapter designs.
- 2024, Q2: Increased adoption of USB PD 3.1 Extended Power Range (EPR) specifications for higher wattage charging solutions across laptops and workstations.
- 2024, Q3: Growing consumer preference for multi-port chargers supporting simultaneous fast charging of multiple smartphones and tablets.
- 2024, Q4: Strategic partnerships formed between charger manufacturers and device makers to optimize charging experiences and expand market reach.
Strategic Charger and Adapter Market Forecast
The strategic forecast for the charger and adapter market is exceptionally positive, driven by sustained demand from the ever-expanding consumer electronics and computing sectors. The increasing integration of GaN technology and the widespread adoption of USB Power Delivery will continue to redefine performance benchmarks, leading to the development of more compact, efficient, and faster charging solutions. The burgeoning IoT ecosystem and the ongoing expansion of network communication infrastructure present significant new avenues for growth, requiring robust and specialized power adapters. While challenges such as supply chain volatility and regulatory evolution persist, the market is poised for substantial expansion, with innovation in energy efficiency and smart charging functionalities being key differentiators for future success. The market is expected to witness a consistent upward trend, fueled by technological advancements and evolving consumer expectations for seamless power delivery.
Charger and Adapter Segmentation
-
1. Application
- 1.1. Computers (Desktops and Laptops)
- 1.2. Tablet
- 1.3. Smartphone
- 1.4. Printer
- 1.5. Consumer Electronics
- 1.6. Network Communication Equipment
- 1.7. Security Monitoring
- 1.8. Industrial Equipment
- 1.9. Medical Equipment
- 1.10. LED Lighting
-
2. Types
- 2.1. 10W and Below 10W
- 2.2. 11W-50W
- 2.3. 51W-100W
- 2.4. Above 100W
Charger and Adapter Segmentation By Geography
-
1. North America
- 1.1. United States
- 1.2. Canada
- 1.3. Mexico
-
2. South America
- 2.1. Brazil
- 2.2. Argentina
- 2.3. Rest of South America
-
3. Europe
- 3.1. United Kingdom
- 3.2. Germany
- 3.3. France
- 3.4. Italy
- 3.5. Spain
- 3.6. Russia
- 3.7. Benelux
- 3.8. Nordics
- 3.9. Rest of Europe
-
4. Middle East & Africa
- 4.1. Turkey
- 4.2. Israel
- 4.3. GCC
- 4.4. North Africa
- 4.5. South Africa
- 4.6. Rest of Middle East & Africa
-
5. Asia Pacific
- 5.1. China
- 5.2. India
- 5.3. Japan
- 5.4. South Korea
- 5.5. ASEAN
- 5.6. Oceania
- 5.7. Rest of Asia Pacific
Charger and Adapter Regional Market Share
Geographic Coverage of Charger and Adapter
Charger and Adapter REPORT HIGHLIGHTS
| Aspects | Details |
|---|---|
| Study Period | 2020-2034 |
| Base Year | 2025 |
| Estimated Year | 2026 |
| Forecast Period | 2026-2034 |
| Historical Period | 2020-2025 |
| Growth Rate | CAGR of 5.6% from 2020-2034 |
| Segmentation |
|
Table of Contents
- 1. Introduction
- 1.1. Research Scope
- 1.2. Market Segmentation
- 1.3. Research Objective
- 1.4. Definitions and Assumptions
- 2. Executive Summary
- 2.1. Market Snapshot
- 3. Market Dynamics
- 3.1. Market Drivers
- 3.2. Market Restrains
- 3.3. Market Trends
- 3.4. Market Opportunities
- 4. Market Factor Analysis
- 4.1. Porters Five Forces
- 4.1.1. Bargaining Power of Suppliers
- 4.1.2. Bargaining Power of Buyers
- 4.1.3. Threat of New Entrants
- 4.1.4. Threat of Substitutes
- 4.1.5. Competitive Rivalry
- 4.2. PESTEL analysis
- 4.3. BCG Analysis
- 4.3.1. Stars (High Growth, High Market Share)
- 4.3.2. Cash Cows (Low Growth, High Market Share)
- 4.3.3. Question Mark (High Growth, Low Market Share)
- 4.3.4. Dogs (Low Growth, Low Market Share)
- 4.4. Ansoff Matrix Analysis
- 4.5. Supply Chain Analysis
- 4.6. Regulatory Landscape
- 4.7. Current Market Potential and Opportunity Assessment (TAM–SAM–SOM Framework)
- 4.8. DMV Analyst Note
- 4.1. Porters Five Forces
- 5. Market Analysis, Insights and Forecast 2021-2033
- 5.1. Market Analysis, Insights and Forecast - by Application
- 5.1.1. Computers (Desktops and Laptops)
- 5.1.2. Tablet
- 5.1.3. Smartphone
- 5.1.4. Printer
- 5.1.5. Consumer Electronics
- 5.1.6. Network Communication Equipment
- 5.1.7. Security Monitoring
- 5.1.8. Industrial Equipment
- 5.1.9. Medical Equipment
- 5.1.10. LED Lighting
- 5.2. Market Analysis, Insights and Forecast - by Types
- 5.2.1. 10W and Below 10W
- 5.2.2. 11W-50W
- 5.2.3. 51W-100W
- 5.2.4. Above 100W
- 5.3. Market Analysis, Insights and Forecast - by Region
- 5.3.1. North America
- 5.3.2. South America
- 5.3.3. Europe
- 5.3.4. Middle East & Africa
- 5.3.5. Asia Pacific
- 5.1. Market Analysis, Insights and Forecast - by Application
- 6. Global Charger and Adapter Analysis, Insights and Forecast, 2021-2033
- 6.1. Market Analysis, Insights and Forecast - by Application
- 6.1.1. Computers (Desktops and Laptops)
- 6.1.2. Tablet
- 6.1.3. Smartphone
- 6.1.4. Printer
- 6.1.5. Consumer Electronics
- 6.1.6. Network Communication Equipment
- 6.1.7. Security Monitoring
- 6.1.8. Industrial Equipment
- 6.1.9. Medical Equipment
- 6.1.10. LED Lighting
- 6.2. Market Analysis, Insights and Forecast - by Types
- 6.2.1. 10W and Below 10W
- 6.2.2. 11W-50W
- 6.2.3. 51W-100W
- 6.2.4. Above 100W
- 6.1. Market Analysis, Insights and Forecast - by Application
- 7. North America Charger and Adapter Analysis, Insights and Forecast, 2020-2032
- 7.1. Market Analysis, Insights and Forecast - by Application
- 7.1.1. Computers (Desktops and Laptops)
- 7.1.2. Tablet
- 7.1.3. Smartphone
- 7.1.4. Printer
- 7.1.5. Consumer Electronics
- 7.1.6. Network Communication Equipment
- 7.1.7. Security Monitoring
- 7.1.8. Industrial Equipment
- 7.1.9. Medical Equipment
- 7.1.10. LED Lighting
- 7.2. Market Analysis, Insights and Forecast - by Types
- 7.2.1. 10W and Below 10W
- 7.2.2. 11W-50W
- 7.2.3. 51W-100W
- 7.2.4. Above 100W
- 7.1. Market Analysis, Insights and Forecast - by Application
- 8. South America Charger and Adapter Analysis, Insights and Forecast, 2020-2032
- 8.1. Market Analysis, Insights and Forecast - by Application
- 8.1.1. Computers (Desktops and Laptops)
- 8.1.2. Tablet
- 8.1.3. Smartphone
- 8.1.4. Printer
- 8.1.5. Consumer Electronics
- 8.1.6. Network Communication Equipment
- 8.1.7. Security Monitoring
- 8.1.8. Industrial Equipment
- 8.1.9. Medical Equipment
- 8.1.10. LED Lighting
- 8.2. Market Analysis, Insights and Forecast - by Types
- 8.2.1. 10W and Below 10W
- 8.2.2. 11W-50W
- 8.2.3. 51W-100W
- 8.2.4. Above 100W
- 8.1. Market Analysis, Insights and Forecast - by Application
- 9. Europe Charger and Adapter Analysis, Insights and Forecast, 2020-2032
- 9.1. Market Analysis, Insights and Forecast - by Application
- 9.1.1. Computers (Desktops and Laptops)
- 9.1.2. Tablet
- 9.1.3. Smartphone
- 9.1.4. Printer
- 9.1.5. Consumer Electronics
- 9.1.6. Network Communication Equipment
- 9.1.7. Security Monitoring
- 9.1.8. Industrial Equipment
- 9.1.9. Medical Equipment
- 9.1.10. LED Lighting
- 9.2. Market Analysis, Insights and Forecast - by Types
- 9.2.1. 10W and Below 10W
- 9.2.2. 11W-50W
- 9.2.3. 51W-100W
- 9.2.4. Above 100W
- 9.1. Market Analysis, Insights and Forecast - by Application
- 10. Middle East & Africa Charger and Adapter Analysis, Insights and Forecast, 2020-2032
- 10.1. Market Analysis, Insights and Forecast - by Application
- 10.1.1. Computers (Desktops and Laptops)
- 10.1.2. Tablet
- 10.1.3. Smartphone
- 10.1.4. Printer
- 10.1.5. Consumer Electronics
- 10.1.6. Network Communication Equipment
- 10.1.7. Security Monitoring
- 10.1.8. Industrial Equipment
- 10.1.9. Medical Equipment
- 10.1.10. LED Lighting
- 10.2. Market Analysis, Insights and Forecast - by Types
- 10.2.1. 10W and Below 10W
- 10.2.2. 11W-50W
- 10.2.3. 51W-100W
- 10.2.4. Above 100W
- 10.1. Market Analysis, Insights and Forecast - by Application
- 11. Asia Pacific Charger and Adapter Analysis, Insights and Forecast, 2020-2032
- 11.1. Market Analysis, Insights and Forecast - by Application
- 11.1.1. Computers (Desktops and Laptops)
- 11.1.2. Tablet
- 11.1.3. Smartphone
- 11.1.4. Printer
- 11.1.5. Consumer Electronics
- 11.1.6. Network Communication Equipment
- 11.1.7. Security Monitoring
- 11.1.8. Industrial Equipment
- 11.1.9. Medical Equipment
- 11.1.10. LED Lighting
- 11.2. Market Analysis, Insights and Forecast - by Types
- 11.2.1. 10W and Below 10W
- 11.2.2. 11W-50W
- 11.2.3. 51W-100W
- 11.2.4. Above 100W
- 11.1. Market Analysis, Insights and Forecast - by Application
- 12. Competitive Analysis
- 12.1. Company Profiles
- 12.1.1 Delta
- 12.1.1.1. Company Overview
- 12.1.1.2. Products
- 12.1.1.3. Company Financials
- 12.1.1.4. SWOT Analysis
- 12.1.2 Lite-On Technology
- 12.1.2.1. Company Overview
- 12.1.2.2. Products
- 12.1.2.3. Company Financials
- 12.1.2.4. SWOT Analysis
- 12.1.3 Acbel Polytech
- 12.1.3.1. Company Overview
- 12.1.3.2. Products
- 12.1.3.3. Company Financials
- 12.1.3.4. SWOT Analysis
- 12.1.4 Salcomp
- 12.1.4.1. Company Overview
- 12.1.4.2. Products
- 12.1.4.3. Company Financials
- 12.1.4.4. SWOT Analysis
- 12.1.5 Chicony Power
- 12.1.5.1. Company Overview
- 12.1.5.2. Products
- 12.1.5.3. Company Financials
- 12.1.5.4. SWOT Analysis
- 12.1.6 Artesyn
- 12.1.6.1. Company Overview
- 12.1.6.2. Products
- 12.1.6.3. Company Financials
- 12.1.6.4. SWOT Analysis
- 12.1.7 Flextronics
- 12.1.7.1. Company Overview
- 12.1.7.2. Products
- 12.1.7.3. Company Financials
- 12.1.7.4. SWOT Analysis
- 12.1.8 Mean Well
- 12.1.8.1. Company Overview
- 12.1.8.2. Products
- 12.1.8.3. Company Financials
- 12.1.8.4. SWOT Analysis
- 12.1.9 TDK Lambda
- 12.1.9.1. Company Overview
- 12.1.9.2. Products
- 12.1.9.3. Company Financials
- 12.1.9.4. SWOT Analysis
- 12.1.10 Phihong
- 12.1.10.1. Company Overview
- 12.1.10.2. Products
- 12.1.10.3. Company Financials
- 12.1.10.4. SWOT Analysis
- 12.1.11 FSP Group
- 12.1.11.1. Company Overview
- 12.1.11.2. Products
- 12.1.11.3. Company Financials
- 12.1.11.4. SWOT Analysis
- 12.1.12 Shenzhen Honor Electronic
- 12.1.12.1. Company Overview
- 12.1.12.2. Products
- 12.1.12.3. Company Financials
- 12.1.12.4. SWOT Analysis
- 12.1.13 Shenzhen Click Technology
- 12.1.13.1. Company Overview
- 12.1.13.2. Products
- 12.1.13.3. Company Financials
- 12.1.13.4. SWOT Analysis
- 12.1.14 Shenzhen Jingquanhua Electronics
- 12.1.14.1. Company Overview
- 12.1.14.2. Products
- 12.1.14.3. Company Financials
- 12.1.14.4. SWOT Analysis
- 12.1.1 Delta
- 12.2. Market Entropy
- 12.2.1 Company's Key Areas Served
- 12.2.2 Recent Developments
- 12.3. Company Market Share Analysis 2025
- 12.3.1 Top 5 Companies Market Share Analysis
- 12.3.2 Top 3 Companies Market Share Analysis
- 12.4. List of Potential Customers
- 13. Research Methodology
List of Figures
- Figure 1: Global Charger and Adapter Revenue Breakdown (undefined, %) by Region 2025 & 2033
- Figure 2: Global Charger and Adapter Volume Breakdown (K, %) by Region 2025 & 2033
- Figure 3: North America Charger and Adapter Revenue (undefined), by Application 2025 & 2033
- Figure 4: North America Charger and Adapter Volume (K), by Application 2025 & 2033
- Figure 5: North America Charger and Adapter Revenue Share (%), by Application 2025 & 2033
- Figure 6: North America Charger and Adapter Volume Share (%), by Application 2025 & 2033
- Figure 7: North America Charger and Adapter Revenue (undefined), by Types 2025 & 2033
- Figure 8: North America Charger and Adapter Volume (K), by Types 2025 & 2033
- Figure 9: North America Charger and Adapter Revenue Share (%), by Types 2025 & 2033
- Figure 10: North America Charger and Adapter Volume Share (%), by Types 2025 & 2033
- Figure 11: North America Charger and Adapter Revenue (undefined), by Country 2025 & 2033
- Figure 12: North America Charger and Adapter Volume (K), by Country 2025 & 2033
- Figure 13: North America Charger and Adapter Revenue Share (%), by Country 2025 & 2033
- Figure 14: North America Charger and Adapter Volume Share (%), by Country 2025 & 2033
- Figure 15: South America Charger and Adapter Revenue (undefined), by Application 2025 & 2033
- Figure 16: South America Charger and Adapter Volume (K), by Application 2025 & 2033
- Figure 17: South America Charger and Adapter Revenue Share (%), by Application 2025 & 2033
- Figure 18: South America Charger and Adapter Volume Share (%), by Application 2025 & 2033
- Figure 19: South America Charger and Adapter Revenue (undefined), by Types 2025 & 2033
- Figure 20: South America Charger and Adapter Volume (K), by Types 2025 & 2033
- Figure 21: South America Charger and Adapter Revenue Share (%), by Types 2025 & 2033
- Figure 22: South America Charger and Adapter Volume Share (%), by Types 2025 & 2033
- Figure 23: South America Charger and Adapter Revenue (undefined), by Country 2025 & 2033
- Figure 24: South America Charger and Adapter Volume (K), by Country 2025 & 2033
- Figure 25: South America Charger and Adapter Revenue Share (%), by Country 2025 & 2033
- Figure 26: South America Charger and Adapter Volume Share (%), by Country 2025 & 2033
- Figure 27: Europe Charger and Adapter Revenue (undefined), by Application 2025 & 2033
- Figure 28: Europe Charger and Adapter Volume (K), by Application 2025 & 2033
- Figure 29: Europe Charger and Adapter Revenue Share (%), by Application 2025 & 2033
- Figure 30: Europe Charger and Adapter Volume Share (%), by Application 2025 & 2033
- Figure 31: Europe Charger and Adapter Revenue (undefined), by Types 2025 & 2033
- Figure 32: Europe Charger and Adapter Volume (K), by Types 2025 & 2033
- Figure 33: Europe Charger and Adapter Revenue Share (%), by Types 2025 & 2033
- Figure 34: Europe Charger and Adapter Volume Share (%), by Types 2025 & 2033
- Figure 35: Europe Charger and Adapter Revenue (undefined), by Country 2025 & 2033
- Figure 36: Europe Charger and Adapter Volume (K), by Country 2025 & 2033
- Figure 37: Europe Charger and Adapter Revenue Share (%), by Country 2025 & 2033
- Figure 38: Europe Charger and Adapter Volume Share (%), by Country 2025 & 2033
- Figure 39: Middle East & Africa Charger and Adapter Revenue (undefined), by Application 2025 & 2033
- Figure 40: Middle East & Africa Charger and Adapter Volume (K), by Application 2025 & 2033
- Figure 41: Middle East & Africa Charger and Adapter Revenue Share (%), by Application 2025 & 2033
- Figure 42: Middle East & Africa Charger and Adapter Volume Share (%), by Application 2025 & 2033
- Figure 43: Middle East & Africa Charger and Adapter Revenue (undefined), by Types 2025 & 2033
- Figure 44: Middle East & Africa Charger and Adapter Volume (K), by Types 2025 & 2033
- Figure 45: Middle East & Africa Charger and Adapter Revenue Share (%), by Types 2025 & 2033
- Figure 46: Middle East & Africa Charger and Adapter Volume Share (%), by Types 2025 & 2033
- Figure 47: Middle East & Africa Charger and Adapter Revenue (undefined), by Country 2025 & 2033
- Figure 48: Middle East & Africa Charger and Adapter Volume (K), by Country 2025 & 2033
- Figure 49: Middle East & Africa Charger and Adapter Revenue Share (%), by Country 2025 & 2033
- Figure 50: Middle East & Africa Charger and Adapter Volume Share (%), by Country 2025 & 2033
- Figure 51: Asia Pacific Charger and Adapter Revenue (undefined), by Application 2025 & 2033
- Figure 52: Asia Pacific Charger and Adapter Volume (K), by Application 2025 & 2033
- Figure 53: Asia Pacific Charger and Adapter Revenue Share (%), by Application 2025 & 2033
- Figure 54: Asia Pacific Charger and Adapter Volume Share (%), by Application 2025 & 2033
- Figure 55: Asia Pacific Charger and Adapter Revenue (undefined), by Types 2025 & 2033
- Figure 56: Asia Pacific Charger and Adapter Volume (K), by Types 2025 & 2033
- Figure 57: Asia Pacific Charger and Adapter Revenue Share (%), by Types 2025 & 2033
- Figure 58: Asia Pacific Charger and Adapter Volume Share (%), by Types 2025 & 2033
- Figure 59: Asia Pacific Charger and Adapter Revenue (undefined), by Country 2025 & 2033
- Figure 60: Asia Pacific Charger and Adapter Volume (K), by Country 2025 & 2033
- Figure 61: Asia Pacific Charger and Adapter Revenue Share (%), by Country 2025 & 2033
- Figure 62: Asia Pacific Charger and Adapter Volume Share (%), by Country 2025 & 2033
List of Tables
- Table 1: Global Charger and Adapter Revenue undefined Forecast, by Application 2020 & 2033
- Table 2: Global Charger and Adapter Volume K Forecast, by Application 2020 & 2033
- Table 3: Global Charger and Adapter Revenue undefined Forecast, by Types 2020 & 2033
- Table 4: Global Charger and Adapter Volume K Forecast, by Types 2020 & 2033
- Table 5: Global Charger and Adapter Revenue undefined Forecast, by Region 2020 & 2033
- Table 6: Global Charger and Adapter Volume K Forecast, by Region 2020 & 2033
- Table 7: Global Charger and Adapter Revenue undefined Forecast, by Application 2020 & 2033
- Table 8: Global Charger and Adapter Volume K Forecast, by Application 2020 & 2033
- Table 9: Global Charger and Adapter Revenue undefined Forecast, by Types 2020 & 2033
- Table 10: Global Charger and Adapter Volume K Forecast, by Types 2020 & 2033
- Table 11: Global Charger and Adapter Revenue undefined Forecast, by Country 2020 & 2033
- Table 12: Global Charger and Adapter Volume K Forecast, by Country 2020 & 2033
- Table 13: United States Charger and Adapter Revenue (undefined) Forecast, by Application 2020 & 2033
- Table 14: United States Charger and Adapter Volume (K) Forecast, by Application 2020 & 2033
- Table 15: Canada Charger and Adapter Revenue (undefined) Forecast, by Application 2020 & 2033
- Table 16: Canada Charger and Adapter Volume (K) Forecast, by Application 2020 & 2033
- Table 17: Mexico Charger and Adapter Revenue (undefined) Forecast, by Application 2020 & 2033
- Table 18: Mexico Charger and Adapter Volume (K) Forecast, by Application 2020 & 2033
- Table 19: Global Charger and Adapter Revenue undefined Forecast, by Application 2020 & 2033
- Table 20: Global Charger and Adapter Volume K Forecast, by Application 2020 & 2033
- Table 21: Global Charger and Adapter Revenue undefined Forecast, by Types 2020 & 2033
- Table 22: Global Charger and Adapter Volume K Forecast, by Types 2020 & 2033
- Table 23: Global Charger and Adapter Revenue undefined Forecast, by Country 2020 & 2033
- Table 24: Global Charger and Adapter Volume K Forecast, by Country 2020 & 2033
- Table 25: Brazil Charger and Adapter Revenue (undefined) Forecast, by Application 2020 & 2033
- Table 26: Brazil Charger and Adapter Volume (K) Forecast, by Application 2020 & 2033
- Table 27: Argentina Charger and Adapter Revenue (undefined) Forecast, by Application 2020 & 2033
- Table 28: Argentina Charger and Adapter Volume (K) Forecast, by Application 2020 & 2033
- Table 29: Rest of South America Charger and Adapter Revenue (undefined) Forecast, by Application 2020 & 2033
- Table 30: Rest of South America Charger and Adapter Volume (K) Forecast, by Application 2020 & 2033
- Table 31: Global Charger and Adapter Revenue undefined Forecast, by Application 2020 & 2033
- Table 32: Global Charger and Adapter Volume K Forecast, by Application 2020 & 2033
- Table 33: Global Charger and Adapter Revenue undefined Forecast, by Types 2020 & 2033
- Table 34: Global Charger and Adapter Volume K Forecast, by Types 2020 & 2033
- Table 35: Global Charger and Adapter Revenue undefined Forecast, by Country 2020 & 2033
- Table 36: Global Charger and Adapter Volume K Forecast, by Country 2020 & 2033
- Table 37: United Kingdom Charger and Adapter Revenue (undefined) Forecast, by Application 2020 & 2033
- Table 38: United Kingdom Charger and Adapter Volume (K) Forecast, by Application 2020 & 2033
- Table 39: Germany Charger and Adapter Revenue (undefined) Forecast, by Application 2020 & 2033
- Table 40: Germany Charger and Adapter Volume (K) Forecast, by Application 2020 & 2033
- Table 41: France Charger and Adapter Revenue (undefined) Forecast, by Application 2020 & 2033
- Table 42: France Charger and Adapter Volume (K) Forecast, by Application 2020 & 2033
- Table 43: Italy Charger and Adapter Revenue (undefined) Forecast, by Application 2020 & 2033
- Table 44: Italy Charger and Adapter Volume (K) Forecast, by Application 2020 & 2033
- Table 45: Spain Charger and Adapter Revenue (undefined) Forecast, by Application 2020 & 2033
- Table 46: Spain Charger and Adapter Volume (K) Forecast, by Application 2020 & 2033
- Table 47: Russia Charger and Adapter Revenue (undefined) Forecast, by Application 2020 & 2033
- Table 48: Russia Charger and Adapter Volume (K) Forecast, by Application 2020 & 2033
- Table 49: Benelux Charger and Adapter Revenue (undefined) Forecast, by Application 2020 & 2033
- Table 50: Benelux Charger and Adapter Volume (K) Forecast, by Application 2020 & 2033
- Table 51: Nordics Charger and Adapter Revenue (undefined) Forecast, by Application 2020 & 2033
- Table 52: Nordics Charger and Adapter Volume (K) Forecast, by Application 2020 & 2033
- Table 53: Rest of Europe Charger and Adapter Revenue (undefined) Forecast, by Application 2020 & 2033
- Table 54: Rest of Europe Charger and Adapter Volume (K) Forecast, by Application 2020 & 2033
- Table 55: Global Charger and Adapter Revenue undefined Forecast, by Application 2020 & 2033
- Table 56: Global Charger and Adapter Volume K Forecast, by Application 2020 & 2033
- Table 57: Global Charger and Adapter Revenue undefined Forecast, by Types 2020 & 2033
- Table 58: Global Charger and Adapter Volume K Forecast, by Types 2020 & 2033
- Table 59: Global Charger and Adapter Revenue undefined Forecast, by Country 2020 & 2033
- Table 60: Global Charger and Adapter Volume K Forecast, by Country 2020 & 2033
- Table 61: Turkey Charger and Adapter Revenue (undefined) Forecast, by Application 2020 & 2033
- Table 62: Turkey Charger and Adapter Volume (K) Forecast, by Application 2020 & 2033
- Table 63: Israel Charger and Adapter Revenue (undefined) Forecast, by Application 2020 & 2033
- Table 64: Israel Charger and Adapter Volume (K) Forecast, by Application 2020 & 2033
- Table 65: GCC Charger and Adapter Revenue (undefined) Forecast, by Application 2020 & 2033
- Table 66: GCC Charger and Adapter Volume (K) Forecast, by Application 2020 & 2033
- Table 67: North Africa Charger and Adapter Revenue (undefined) Forecast, by Application 2020 & 2033
- Table 68: North Africa Charger and Adapter Volume (K) Forecast, by Application 2020 & 2033
- Table 69: South Africa Charger and Adapter Revenue (undefined) Forecast, by Application 2020 & 2033
- Table 70: South Africa Charger and Adapter Volume (K) Forecast, by Application 2020 & 2033
- Table 71: Rest of Middle East & Africa Charger and Adapter Revenue (undefined) Forecast, by Application 2020 & 2033
- Table 72: Rest of Middle East & Africa Charger and Adapter Volume (K) Forecast, by Application 2020 & 2033
- Table 73: Global Charger and Adapter Revenue undefined Forecast, by Application 2020 & 2033
- Table 74: Global Charger and Adapter Volume K Forecast, by Application 2020 & 2033
- Table 75: Global Charger and Adapter Revenue undefined Forecast, by Types 2020 & 2033
- Table 76: Global Charger and Adapter Volume K Forecast, by Types 2020 & 2033
- Table 77: Global Charger and Adapter Revenue undefined Forecast, by Country 2020 & 2033
- Table 78: Global Charger and Adapter Volume K Forecast, by Country 2020 & 2033
- Table 79: China Charger and Adapter Revenue (undefined) Forecast, by Application 2020 & 2033
- Table 80: China Charger and Adapter Volume (K) Forecast, by Application 2020 & 2033
- Table 81: India Charger and Adapter Revenue (undefined) Forecast, by Application 2020 & 2033
- Table 82: India Charger and Adapter Volume (K) Forecast, by Application 2020 & 2033
- Table 83: Japan Charger and Adapter Revenue (undefined) Forecast, by Application 2020 & 2033
- Table 84: Japan Charger and Adapter Volume (K) Forecast, by Application 2020 & 2033
- Table 85: South Korea Charger and Adapter Revenue (undefined) Forecast, by Application 2020 & 2033
- Table 86: South Korea Charger and Adapter Volume (K) Forecast, by Application 2020 & 2033
- Table 87: ASEAN Charger and Adapter Revenue (undefined) Forecast, by Application 2020 & 2033
- Table 88: ASEAN Charger and Adapter Volume (K) Forecast, by Application 2020 & 2033
- Table 89: Oceania Charger and Adapter Revenue (undefined) Forecast, by Application 2020 & 2033
- Table 90: Oceania Charger and Adapter Volume (K) Forecast, by Application 2020 & 2033
- Table 91: Rest of Asia Pacific Charger and Adapter Revenue (undefined) Forecast, by Application 2020 & 2033
- Table 92: Rest of Asia Pacific Charger and Adapter Volume (K) Forecast, by Application 2020 & 2033
Frequently Asked Questions
1. What is the projected Compound Annual Growth Rate (CAGR) of the Charger and Adapter?
The projected CAGR is approximately 5.6%.
2. Which companies are prominent players in the Charger and Adapter?
Key companies in the market include Delta, Lite-On Technology, Acbel Polytech, Salcomp, Chicony Power, Artesyn, Flextronics, Mean Well, TDK Lambda, Phihong, FSP Group, Shenzhen Honor Electronic, Shenzhen Click Technology, Shenzhen Jingquanhua Electronics.
3. What are the main segments of the Charger and Adapter?
The market segments include Application, Types.
4. Can you provide details about the market size?
The market size is estimated to be USD XXX N/A as of 2022.
5. What are some drivers contributing to market growth?
N/A
6. What are the notable trends driving market growth?
N/A
7. Are there any restraints impacting market growth?
N/A
8. Can you provide examples of recent developments in the market?
N/A
9. What pricing options are available for accessing the report?
Pricing options include single-user, multi-user, and enterprise licenses priced at USD 4350.00, USD 6525.00, and USD 8700.00 respectively.
10. Is the market size provided in terms of value or volume?
The market size is provided in terms of value, measured in N/A and volume, measured in K.
11. Are there any specific market keywords associated with the report?
Yes, the market keyword associated with the report is "Charger and Adapter," which aids in identifying and referencing the specific market segment covered.
12. How do I determine which pricing option suits my needs best?
The pricing options vary based on user requirements and access needs. Individual users may opt for single-user licenses, while businesses requiring broader access may choose multi-user or enterprise licenses for cost-effective access to the report.
13. Are there any additional resources or data provided in the Charger and Adapter report?
While the report offers comprehensive insights, it's advisable to review the specific contents or supplementary materials provided to ascertain if additional resources or data are available.
14. How can I stay updated on further developments or reports in the Charger and Adapter?
To stay informed about further developments, trends, and reports in the Charger and Adapter, consider subscribing to industry newsletters, following relevant companies and organizations, or regularly checking reputable industry news sources and publications.
Methodology
Step 1 - Identification of Relevant Samples Size from Population Database


Step 2 - Approaches for Defining Global Market Size (Value, Volume* & Price*)

Note*: In applicable scenarios
Step 3 - Data Sources
Primary Research
- Web Analytics
- Survey Reports
- Research Institute
- Latest Research Reports
- Opinion Leaders
Secondary Research
- Annual Reports
- White Paper
- Latest Press Release
- Industry Association
- Paid Database
- Investor Presentations

Step 4 - Data Triangulation
Involves using different sources of information in order to increase the validity of a study
These sources are likely to be stakeholders in a program - participants, other researchers, program staff, other community members, and so on.
Then we put all data in single framework & apply various statistical tools to find out the dynamic on the market.
During the analysis stage, feedback from the stakeholder groups would be compared to determine areas of agreement as well as areas of divergence