

Key Insights
The global Cash-in-Transit Bag market is poised for significant expansion, projected to reach an estimated $10.68 billion by 2025. This robust growth is fueled by an anticipated Compound Annual Growth Rate (CAGR) of 11.93% over the forecast period. A primary driver for this market surge is the increasing need for secure and tamper-evident transportation of cash and valuables across various sectors. Financial institutions, in particular, are investing heavily in advanced security solutions like specialized cash-in-transit bags to mitigate risks of theft and fraud. The growing retail and hospitality industries also contribute significantly, with businesses requiring reliable methods for managing cash transactions and deposits. Furthermore, the rising global e-commerce landscape, while seemingly reducing physical cash flow, paradoxically increases the demand for secure logistics and transit solutions for the cash generated from these transactions and for the returned items. Emerging economies, with their expanding financial infrastructures and increasing consumer spending, represent a substantial opportunity for market growth.
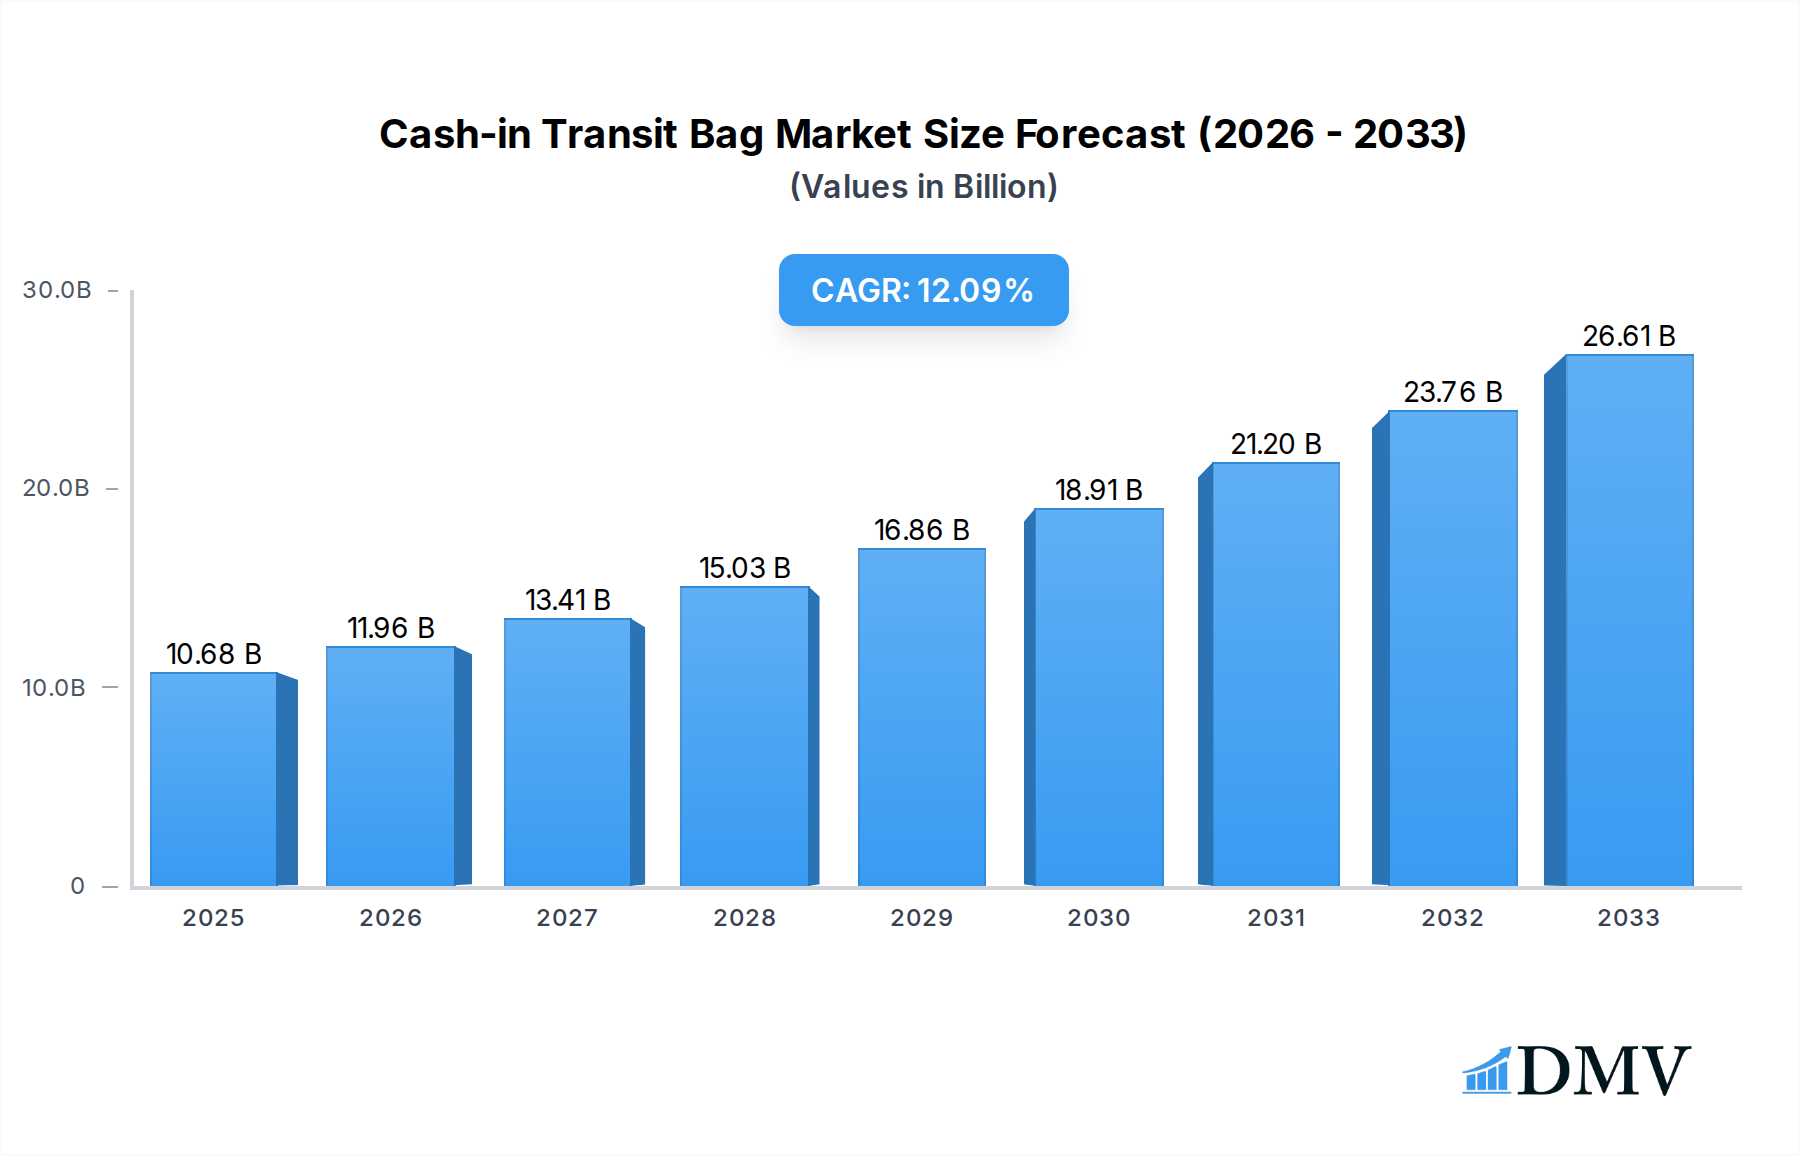
Cash-in Transit Bag Market Size (In Billion)
The market segmentation reveals a diverse landscape of applications and product types. Within applications, Financial Institutions are expected to dominate, followed by Retail Chains, Hotels, and Hospitals, each presenting unique security requirements. The 'Others' category, likely encompassing sectors like gaming, transportation, and private security firms, also plays a crucial role. On the product type front, Plastic Bags currently lead due to their cost-effectiveness and durability, but Paper Bags are gaining traction driven by environmental concerns and increasing regulatory pushes for sustainable packaging. Fabric Bags, though a smaller segment, are being adopted for their reusability and high-security features in specific niche applications. Key players such as ProAmpac, Coveris Holdings, and Illinois Tool Works are actively innovating, focusing on enhanced security features, material advancements, and expanding their global reach to capitalize on these market dynamics. The competitive landscape is characterized by strategic partnerships and mergers & acquisitions aimed at strengthening market presence and technological capabilities.

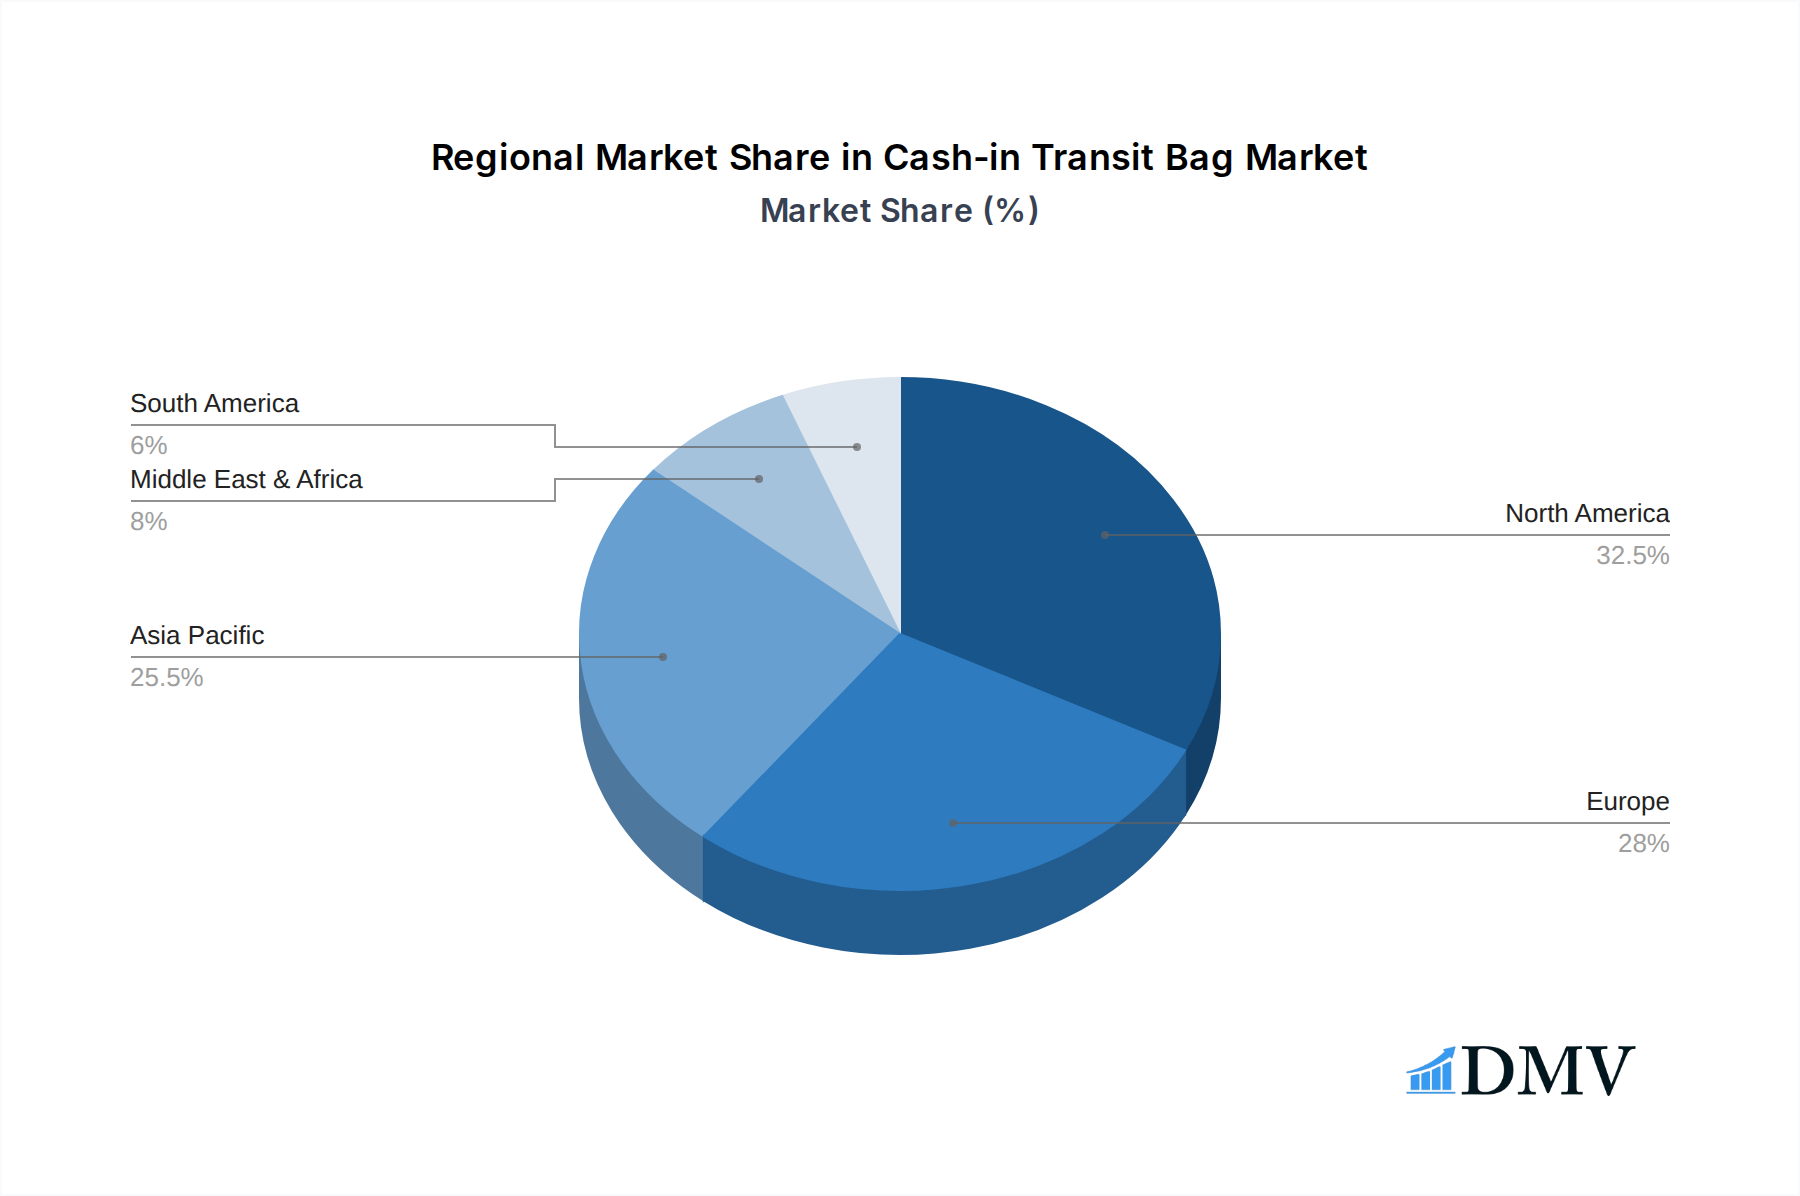
Cash-in Transit Bag Company Market Share
Unlock billion-dollar insights into the global Cash-in Transit Bag market with this comprehensive report. Spanning the extensive Study Period of 2019–2033, with a Base Year of 2025 and a Forecast Period from 2025–2033, this analysis delves into the critical dynamics shaping the security packaging sector. Discover market penetration strategies, emerging technologies, and the competitive landscape that will define the future of secure cash logistics. This report is meticulously crafted to equip financial institutions, retail chains, and security packaging providers with the actionable intelligence needed to navigate challenges and capitalize on billion-dollar opportunities.
Cash-in Transit Bag Market Composition & Trends
The Cash-in Transit Bag market is characterized by a moderate level of concentration, with key players like ProAmpac, Coveris Holdings, and Illinois Tool Works commanding significant market share, estimated to be over $50 billion. Innovation catalysts, such as advancements in tamper-evident technologies and the integration of RFID tracking, are driving differentiation and securing billion-dollar deals. The regulatory landscape, influenced by stringent security protocols for financial transactions, plays a pivotal role in dictating product specifications and market entry barriers. Substitute products, while present, offer limited security assurances compared to specialized cash-in-transit bags. End-user profiles span Financial Institutions, Retail Chains, and Hospitals, each with unique security requirements. Mergers and Acquisition (M&A) activities, with reported deal values reaching hundreds of millions of dollars, are consolidating the market and fostering innovation. Notable M&A activities include the acquisition of smaller specialty packaging firms by larger conglomerates, seeking to expand their secure packaging portfolios.
- Market Share Distribution: Top 5 players hold approximately 40% of the market, valued at over $20 billion.
- Innovation Catalysts: Tamper-evident features and advanced sealing mechanisms are key differentiators.
- Regulatory Landscape: Strict compliance with security standards for financial and high-value goods transport is paramount.
- Substitute Products: Standard courier bags and basic envelopes present a lower security alternative.
- End-User Focus: Financial Institutions represent the largest segment by value, exceeding $15 billion.
- M&A Activity: Strategic acquisitions aim to broaden product offerings and market reach, with billions invested annually.
Cash-in Transit Bag Industry Evolution
The Cash-in Transit Bag industry has witnessed a remarkable evolution, driven by an unwavering commitment to security and efficiency in the transport of valuables. Over the Historical Period (2019–2024), the market experienced a steady growth trajectory, propelled by the increasing volume of cash transactions globally and a heightened awareness of security risks. The Estimated Year of 2025 marks a significant inflection point, with projected market growth rates of approximately 7.5% annually during the Forecast Period (2025–2033). Technological advancements have been instrumental in this evolution. Early iterations of cash-in-transit bags were primarily focused on basic containment, often made from durable paper or simple plastic materials. However, as security threats became more sophisticated, so too did the packaging solutions. The introduction of advanced tamper-evident seals, such as unique holographic closures and sequentially numbered void materials, has become a standard feature, providing an immediate visual indicator of any compromise. Furthermore, the integration of smart technologies, including RFID tags and GPS tracking capabilities, is revolutionizing logistics management. These advancements allow for real-time monitoring of bag location and integrity, significantly reducing the risk of loss or theft and optimizing delivery routes. Consumer demand has also shifted dramatically. From a security-only perspective, end-users now expect a comprehensive solution that not only protects assets but also offers enhanced traceability and operational efficiency. This has led to a demand for customized bag solutions tailored to specific industry needs, whether it's for high-volume retail deposits, sensitive hospital supplies, or critical financial transfers. The market has responded with a diversification of materials, from robust multi-layered plastics and high-strength fabrics to eco-friendlier paper-based options, all engineered to meet rigorous security and performance benchmarks. The pursuit of sustainable yet secure packaging solutions is also gaining traction, indicating a future where environmental responsibility and asset protection go hand-in-hand, representing a billion-dollar market opportunity for innovative companies.
Leading Regions, Countries, or Segments in Cash-in Transit Bag
North America currently stands as the dominant region in the global Cash-in Transit Bag market, projected to account for over 30% of the total market value, estimated at over $15 billion by 2025. This dominance is fueled by a confluence of robust financial infrastructure, a high volume of retail transactions, and stringent security regulations that mandate the use of secure transit packaging. Within North America, the United States leads in terms of market penetration and innovation, driven by its vast network of financial institutions and retail chains. Key drivers for this regional supremacy include significant investment trends in security technology and a proactive regulatory environment that continuously updates standards to counter evolving threats. The Application segment of Financial Institutions remains the largest and most influential, contributing an estimated $10 billion to the North American market in 2025. This is due to the inherent need for secure transport of cash, checks, and other sensitive financial instruments between branches, ATMs, and central depositories.
- Dominant Region: North America
- Key Drivers:
- High volume of financial transactions and retail sales.
- Strict government regulations and industry standards for security packaging.
- Significant investment in advanced security technologies by businesses.
- Presence of major financial institutions and retail conglomerates.
- Key Drivers:
- Dominant Country: United States
- In-depth Analysis: The US market benefits from a mature financial services sector and a decentralized retail landscape, necessitating secure cash handling and transport across numerous points of sale. The adoption of RFID and other tracking technologies is particularly advanced here, enhancing supply chain visibility for billions of dollars in transit.
- Dominant Application Segment: Financial Institutions
- In-depth Analysis: Banks, credit unions, and other financial entities rely on cash-in-transit bags for daily operations, ATM replenishment, and inter-branch transfers. The sheer volume of currency handled and the critical nature of financial data demand the highest levels of security, making this segment a consistent revenue generator with billions in annual spending. The implementation of advanced security features in these bags directly impacts the security of vast financial assets.
- Dominant Type: Plastic Bags
- In-depth Analysis: Plastic bags, particularly those made from high-strength, tear-resistant polyethylene and featuring advanced tamper-evident closures, dominate due to their durability, moisture resistance, and cost-effectiveness. They offer a superior balance of security and performance for the rigorous demands of cash transportation, representing a significant portion of the billions invested in packaging materials.
Cash-in Transit Bag Product Innovations
The Cash-in Transit Bag market is abuzz with innovations aimed at enhancing security, traceability, and sustainability, collectively valued in the billions. Leading manufacturers are developing bags with integrated RFID chips for real-time tracking and inventory management, alongside advanced tamper-evident seals that leave indelible marks upon unauthorized access. Performance metrics are increasingly stringent, focusing on tensile strength, tear resistance, and puncture resistance, often exceeding billions of pounds of force. Unique selling propositions include biodegradable materials for environmentally conscious clients and custom branding options for enhanced corporate security visibility. Technological advancements are pushing the boundaries of material science and security feature integration.
Propelling Factors for Cash-in Transit Bag Growth
The Cash-in Transit Bag market is propelled by a confluence of factors, driving significant growth projected in the billions. Growing global e-commerce and retail sales necessitate more secure logistics, increasing demand for reliable transit bags. Heightened security concerns and the increasing frequency of financial fraud globally are driving stricter regulatory frameworks and a preference for high-security packaging solutions. Technological advancements, such as the integration of RFID and IoT sensors for real-time tracking and authentication, are enhancing the value proposition of these bags. Furthermore, a rising trend in cash usage in certain emerging economies, alongside the continued need for secure cash handling in established markets, provides a broad and sustained market base.
Obstacles in the Cash-in Transit Bag Market
Despite robust growth potential, the Cash-in Transit Bag market faces several obstacles, impacting billions in potential revenue. Stringent and evolving regulatory compliance across different jurisdictions can create significant barriers to entry and increase manufacturing costs. Supply chain disruptions, particularly for raw materials like specialized plastics and tamper-evident components, can lead to price volatility and affect production timelines, potentially impacting billions in planned shipments. Intense competitive pressures from both established players and emerging manufacturers drive price sensitivity, challenging profit margins on billion-dollar contracts. Additionally, the gradual shift towards cashless transactions in some developed economies could, in the long term, temper demand for traditional cash-handling solutions.
Future Opportunities in Cash-in Transit Bag
The future of the Cash-in Transit Bag market is ripe with opportunities valued in the billions. The increasing adoption of smart technologies, such as IoT-enabled sensors and blockchain integration for enhanced data security and traceability, presents a significant growth avenue. The expansion of e-commerce logistics, particularly for high-value goods, is creating new demand for specialized secure transit packaging beyond traditional cash. Emerging markets with growing economies and evolving retail sectors offer substantial untapped potential. Furthermore, the demand for sustainable and eco-friendly packaging solutions, while challenging, represents a growing niche for innovative materials and manufacturing processes, potentially unlocking billions in green packaging investments.
Major Players in the Cash-in Transit Bag Ecosystem
- ProAmpac
- Coveris Holdings
- Dynaflex
- Nelmar Security Packaging Systems
- Korozo Ambalaj
- Truseal
- Illinois Tool Works
- Initial Packaging Solutions
- A. Rifkin
- Packaging Horizons
- Harcor
- Leghorn
Key Developments in Cash-in Transit Bag Industry
- 2023 Q4: ProAmpac launches advanced tamper-evident plastic bags with integrated RFID for enhanced inventory management, impacting billions in logistics security.
- 2023 Q3: Coveris Holdings acquires a specialty security packaging firm, expanding its product portfolio in high-value asset protection, a move valued in hundreds of millions.
- 2023 Q2: Nelmar Security Packaging Systems introduces a new line of biodegradable cash-in-transit bags, addressing growing sustainability demands worth billions.
- 2023 Q1: Illinois Tool Works invests heavily in R&D for smart packaging solutions, aiming to capture a larger share of the billions in the secure logistics market.
- 2022 Q4: Korozo Ambalaj expands its manufacturing capacity for high-security courier bags, anticipating continued growth in the billions for secure packaging.
- 2022 Q3: A. Rifkin partners with a technology firm to develop next-generation tamper-proof sealing mechanisms, a critical development for billions in financial transactions.
Strategic Cash-in Transit Bag Market Forecast
The strategic Cash-in Transit Bag market forecast indicates a sustained growth trajectory, with an estimated market value of billions by 2033. Key growth catalysts include the escalating demand for robust security features driven by increasing financial fraud and regulatory stringency. The integration of smart technologies, such as advanced tracking and authentication, will further enhance market value and operational efficiency. Emerging economies and the expanding e-commerce logistics sector present significant untapped market potential, promising billions in new revenue streams. Continued investment in sustainable packaging solutions will also shape market dynamics and offer opportunities for innovation.
Cash-in Transit Bag Segmentation
-
1. Application
- 1.1. Financial Institutions
- 1.2. Hotels
- 1.3. Retail Chains
- 1.4. Hospitals
- 1.5. Others
-
2. Types
- 2.1. Plastic Bags
- 2.2. Paper Bags
- 2.3. Fabric Bags
Cash-in Transit Bag Segmentation By Geography
-
1. North America
- 1.1. United States
- 1.2. Canada
- 1.3. Mexico
-
2. South America
- 2.1. Brazil
- 2.2. Argentina
- 2.3. Rest of South America
-
3. Europe
- 3.1. United Kingdom
- 3.2. Germany
- 3.3. France
- 3.4. Italy
- 3.5. Spain
- 3.6. Russia
- 3.7. Benelux
- 3.8. Nordics
- 3.9. Rest of Europe
-
4. Middle East & Africa
- 4.1. Turkey
- 4.2. Israel
- 4.3. GCC
- 4.4. North Africa
- 4.5. South Africa
- 4.6. Rest of Middle East & Africa
-
5. Asia Pacific
- 5.1. China
- 5.2. India
- 5.3. Japan
- 5.4. South Korea
- 5.5. ASEAN
- 5.6. Oceania
- 5.7. Rest of Asia Pacific
Cash-in Transit Bag Regional Market Share
Geographic Coverage of Cash-in Transit Bag
Cash-in Transit Bag REPORT HIGHLIGHTS
| Aspects | Details |
|---|---|
| Study Period | 2020-2034 |
| Base Year | 2025 |
| Estimated Year | 2026 |
| Forecast Period | 2026-2034 |
| Historical Period | 2020-2025 |
| Growth Rate | CAGR of 11.93% from 2020-2034 |
| Segmentation |
|
Table of Contents
- 1. Introduction
- 1.1. Research Scope
- 1.2. Market Segmentation
- 1.3. Research Methodology
- 1.4. Definitions and Assumptions
- 2. Executive Summary
- 2.1. Introduction
- 3. Market Dynamics
- 3.1. Introduction
- 3.2. Market Drivers
- 3.3. Market Restrains
- 3.4. Market Trends
- 4. Market Factor Analysis
- 4.1. Porters Five Forces
- 4.2. Supply/Value Chain
- 4.3. PESTEL analysis
- 4.4. Market Entropy
- 4.5. Patent/Trademark Analysis
- 5. Global Cash-in Transit Bag Analysis, Insights and Forecast, 2020-2032
- 5.1. Market Analysis, Insights and Forecast - by Application
- 5.1.1. Financial Institutions
- 5.1.2. Hotels
- 5.1.3. Retail Chains
- 5.1.4. Hospitals
- 5.1.5. Others
- 5.2. Market Analysis, Insights and Forecast - by Types
- 5.2.1. Plastic Bags
- 5.2.2. Paper Bags
- 5.2.3. Fabric Bags
- 5.3. Market Analysis, Insights and Forecast - by Region
- 5.3.1. North America
- 5.3.2. South America
- 5.3.3. Europe
- 5.3.4. Middle East & Africa
- 5.3.5. Asia Pacific
- 5.1. Market Analysis, Insights and Forecast - by Application
- 6. North America Cash-in Transit Bag Analysis, Insights and Forecast, 2020-2032
- 6.1. Market Analysis, Insights and Forecast - by Application
- 6.1.1. Financial Institutions
- 6.1.2. Hotels
- 6.1.3. Retail Chains
- 6.1.4. Hospitals
- 6.1.5. Others
- 6.2. Market Analysis, Insights and Forecast - by Types
- 6.2.1. Plastic Bags
- 6.2.2. Paper Bags
- 6.2.3. Fabric Bags
- 6.1. Market Analysis, Insights and Forecast - by Application
- 7. South America Cash-in Transit Bag Analysis, Insights and Forecast, 2020-2032
- 7.1. Market Analysis, Insights and Forecast - by Application
- 7.1.1. Financial Institutions
- 7.1.2. Hotels
- 7.1.3. Retail Chains
- 7.1.4. Hospitals
- 7.1.5. Others
- 7.2. Market Analysis, Insights and Forecast - by Types
- 7.2.1. Plastic Bags
- 7.2.2. Paper Bags
- 7.2.3. Fabric Bags
- 7.1. Market Analysis, Insights and Forecast - by Application
- 8. Europe Cash-in Transit Bag Analysis, Insights and Forecast, 2020-2032
- 8.1. Market Analysis, Insights and Forecast - by Application
- 8.1.1. Financial Institutions
- 8.1.2. Hotels
- 8.1.3. Retail Chains
- 8.1.4. Hospitals
- 8.1.5. Others
- 8.2. Market Analysis, Insights and Forecast - by Types
- 8.2.1. Plastic Bags
- 8.2.2. Paper Bags
- 8.2.3. Fabric Bags
- 8.1. Market Analysis, Insights and Forecast - by Application
- 9. Middle East & Africa Cash-in Transit Bag Analysis, Insights and Forecast, 2020-2032
- 9.1. Market Analysis, Insights and Forecast - by Application
- 9.1.1. Financial Institutions
- 9.1.2. Hotels
- 9.1.3. Retail Chains
- 9.1.4. Hospitals
- 9.1.5. Others
- 9.2. Market Analysis, Insights and Forecast - by Types
- 9.2.1. Plastic Bags
- 9.2.2. Paper Bags
- 9.2.3. Fabric Bags
- 9.1. Market Analysis, Insights and Forecast - by Application
- 10. Asia Pacific Cash-in Transit Bag Analysis, Insights and Forecast, 2020-2032
- 10.1. Market Analysis, Insights and Forecast - by Application
- 10.1.1. Financial Institutions
- 10.1.2. Hotels
- 10.1.3. Retail Chains
- 10.1.4. Hospitals
- 10.1.5. Others
- 10.2. Market Analysis, Insights and Forecast - by Types
- 10.2.1. Plastic Bags
- 10.2.2. Paper Bags
- 10.2.3. Fabric Bags
- 10.1. Market Analysis, Insights and Forecast - by Application
- 11. Competitive Analysis
- 11.1. Global Market Share Analysis 2025
- 11.2. Company Profiles
- 11.2.1 ProAmpac
- 11.2.1.1. Overview
- 11.2.1.2. Products
- 11.2.1.3. SWOT Analysis
- 11.2.1.4. Recent Developments
- 11.2.1.5. Financials (Based on Availability)
- 11.2.2 Coveris Holdings
- 11.2.2.1. Overview
- 11.2.2.2. Products
- 11.2.2.3. SWOT Analysis
- 11.2.2.4. Recent Developments
- 11.2.2.5. Financials (Based on Availability)
- 11.2.3 Dynaflex
- 11.2.3.1. Overview
- 11.2.3.2. Products
- 11.2.3.3. SWOT Analysis
- 11.2.3.4. Recent Developments
- 11.2.3.5. Financials (Based on Availability)
- 11.2.4 Nelmar Security Packaging Systems
- 11.2.4.1. Overview
- 11.2.4.2. Products
- 11.2.4.3. SWOT Analysis
- 11.2.4.4. Recent Developments
- 11.2.4.5. Financials (Based on Availability)
- 11.2.5 Korozo Ambalaj
- 11.2.5.1. Overview
- 11.2.5.2. Products
- 11.2.5.3. SWOT Analysis
- 11.2.5.4. Recent Developments
- 11.2.5.5. Financials (Based on Availability)
- 11.2.6 Truseal
- 11.2.6.1. Overview
- 11.2.6.2. Products
- 11.2.6.3. SWOT Analysis
- 11.2.6.4. Recent Developments
- 11.2.6.5. Financials (Based on Availability)
- 11.2.7 Illinois Tool Works
- 11.2.7.1. Overview
- 11.2.7.2. Products
- 11.2.7.3. SWOT Analysis
- 11.2.7.4. Recent Developments
- 11.2.7.5. Financials (Based on Availability)
- 11.2.8 Initial Packaging Solutions
- 11.2.8.1. Overview
- 11.2.8.2. Products
- 11.2.8.3. SWOT Analysis
- 11.2.8.4. Recent Developments
- 11.2.8.5. Financials (Based on Availability)
- 11.2.9 A. Rifkin
- 11.2.9.1. Overview
- 11.2.9.2. Products
- 11.2.9.3. SWOT Analysis
- 11.2.9.4. Recent Developments
- 11.2.9.5. Financials (Based on Availability)
- 11.2.10 Packaging Horizons
- 11.2.10.1. Overview
- 11.2.10.2. Products
- 11.2.10.3. SWOT Analysis
- 11.2.10.4. Recent Developments
- 11.2.10.5. Financials (Based on Availability)
- 11.2.11 Harcor
- 11.2.11.1. Overview
- 11.2.11.2. Products
- 11.2.11.3. SWOT Analysis
- 11.2.11.4. Recent Developments
- 11.2.11.5. Financials (Based on Availability)
- 11.2.12 Leghorn
- 11.2.12.1. Overview
- 11.2.12.2. Products
- 11.2.12.3. SWOT Analysis
- 11.2.12.4. Recent Developments
- 11.2.12.5. Financials (Based on Availability)
- 11.2.1 ProAmpac
List of Figures
- Figure 1: Global Cash-in Transit Bag Revenue Breakdown (billion, %) by Region 2025 & 2033
- Figure 2: North America Cash-in Transit Bag Revenue (billion), by Application 2025 & 2033
- Figure 3: North America Cash-in Transit Bag Revenue Share (%), by Application 2025 & 2033
- Figure 4: North America Cash-in Transit Bag Revenue (billion), by Types 2025 & 2033
- Figure 5: North America Cash-in Transit Bag Revenue Share (%), by Types 2025 & 2033
- Figure 6: North America Cash-in Transit Bag Revenue (billion), by Country 2025 & 2033
- Figure 7: North America Cash-in Transit Bag Revenue Share (%), by Country 2025 & 2033
- Figure 8: South America Cash-in Transit Bag Revenue (billion), by Application 2025 & 2033
- Figure 9: South America Cash-in Transit Bag Revenue Share (%), by Application 2025 & 2033
- Figure 10: South America Cash-in Transit Bag Revenue (billion), by Types 2025 & 2033
- Figure 11: South America Cash-in Transit Bag Revenue Share (%), by Types 2025 & 2033
- Figure 12: South America Cash-in Transit Bag Revenue (billion), by Country 2025 & 2033
- Figure 13: South America Cash-in Transit Bag Revenue Share (%), by Country 2025 & 2033
- Figure 14: Europe Cash-in Transit Bag Revenue (billion), by Application 2025 & 2033
- Figure 15: Europe Cash-in Transit Bag Revenue Share (%), by Application 2025 & 2033
- Figure 16: Europe Cash-in Transit Bag Revenue (billion), by Types 2025 & 2033
- Figure 17: Europe Cash-in Transit Bag Revenue Share (%), by Types 2025 & 2033
- Figure 18: Europe Cash-in Transit Bag Revenue (billion), by Country 2025 & 2033
- Figure 19: Europe Cash-in Transit Bag Revenue Share (%), by Country 2025 & 2033
- Figure 20: Middle East & Africa Cash-in Transit Bag Revenue (billion), by Application 2025 & 2033
- Figure 21: Middle East & Africa Cash-in Transit Bag Revenue Share (%), by Application 2025 & 2033
- Figure 22: Middle East & Africa Cash-in Transit Bag Revenue (billion), by Types 2025 & 2033
- Figure 23: Middle East & Africa Cash-in Transit Bag Revenue Share (%), by Types 2025 & 2033
- Figure 24: Middle East & Africa Cash-in Transit Bag Revenue (billion), by Country 2025 & 2033
- Figure 25: Middle East & Africa Cash-in Transit Bag Revenue Share (%), by Country 2025 & 2033
- Figure 26: Asia Pacific Cash-in Transit Bag Revenue (billion), by Application 2025 & 2033
- Figure 27: Asia Pacific Cash-in Transit Bag Revenue Share (%), by Application 2025 & 2033
- Figure 28: Asia Pacific Cash-in Transit Bag Revenue (billion), by Types 2025 & 2033
- Figure 29: Asia Pacific Cash-in Transit Bag Revenue Share (%), by Types 2025 & 2033
- Figure 30: Asia Pacific Cash-in Transit Bag Revenue (billion), by Country 2025 & 2033
- Figure 31: Asia Pacific Cash-in Transit Bag Revenue Share (%), by Country 2025 & 2033
List of Tables
- Table 1: Global Cash-in Transit Bag Revenue billion Forecast, by Application 2020 & 2033
- Table 2: Global Cash-in Transit Bag Revenue billion Forecast, by Types 2020 & 2033
- Table 3: Global Cash-in Transit Bag Revenue billion Forecast, by Region 2020 & 2033
- Table 4: Global Cash-in Transit Bag Revenue billion Forecast, by Application 2020 & 2033
- Table 5: Global Cash-in Transit Bag Revenue billion Forecast, by Types 2020 & 2033
- Table 6: Global Cash-in Transit Bag Revenue billion Forecast, by Country 2020 & 2033
- Table 7: United States Cash-in Transit Bag Revenue (billion) Forecast, by Application 2020 & 2033
- Table 8: Canada Cash-in Transit Bag Revenue (billion) Forecast, by Application 2020 & 2033
- Table 9: Mexico Cash-in Transit Bag Revenue (billion) Forecast, by Application 2020 & 2033
- Table 10: Global Cash-in Transit Bag Revenue billion Forecast, by Application 2020 & 2033
- Table 11: Global Cash-in Transit Bag Revenue billion Forecast, by Types 2020 & 2033
- Table 12: Global Cash-in Transit Bag Revenue billion Forecast, by Country 2020 & 2033
- Table 13: Brazil Cash-in Transit Bag Revenue (billion) Forecast, by Application 2020 & 2033
- Table 14: Argentina Cash-in Transit Bag Revenue (billion) Forecast, by Application 2020 & 2033
- Table 15: Rest of South America Cash-in Transit Bag Revenue (billion) Forecast, by Application 2020 & 2033
- Table 16: Global Cash-in Transit Bag Revenue billion Forecast, by Application 2020 & 2033
- Table 17: Global Cash-in Transit Bag Revenue billion Forecast, by Types 2020 & 2033
- Table 18: Global Cash-in Transit Bag Revenue billion Forecast, by Country 2020 & 2033
- Table 19: United Kingdom Cash-in Transit Bag Revenue (billion) Forecast, by Application 2020 & 2033
- Table 20: Germany Cash-in Transit Bag Revenue (billion) Forecast, by Application 2020 & 2033
- Table 21: France Cash-in Transit Bag Revenue (billion) Forecast, by Application 2020 & 2033
- Table 22: Italy Cash-in Transit Bag Revenue (billion) Forecast, by Application 2020 & 2033
- Table 23: Spain Cash-in Transit Bag Revenue (billion) Forecast, by Application 2020 & 2033
- Table 24: Russia Cash-in Transit Bag Revenue (billion) Forecast, by Application 2020 & 2033
- Table 25: Benelux Cash-in Transit Bag Revenue (billion) Forecast, by Application 2020 & 2033
- Table 26: Nordics Cash-in Transit Bag Revenue (billion) Forecast, by Application 2020 & 2033
- Table 27: Rest of Europe Cash-in Transit Bag Revenue (billion) Forecast, by Application 2020 & 2033
- Table 28: Global Cash-in Transit Bag Revenue billion Forecast, by Application 2020 & 2033
- Table 29: Global Cash-in Transit Bag Revenue billion Forecast, by Types 2020 & 2033
- Table 30: Global Cash-in Transit Bag Revenue billion Forecast, by Country 2020 & 2033
- Table 31: Turkey Cash-in Transit Bag Revenue (billion) Forecast, by Application 2020 & 2033
- Table 32: Israel Cash-in Transit Bag Revenue (billion) Forecast, by Application 2020 & 2033
- Table 33: GCC Cash-in Transit Bag Revenue (billion) Forecast, by Application 2020 & 2033
- Table 34: North Africa Cash-in Transit Bag Revenue (billion) Forecast, by Application 2020 & 2033
- Table 35: South Africa Cash-in Transit Bag Revenue (billion) Forecast, by Application 2020 & 2033
- Table 36: Rest of Middle East & Africa Cash-in Transit Bag Revenue (billion) Forecast, by Application 2020 & 2033
- Table 37: Global Cash-in Transit Bag Revenue billion Forecast, by Application 2020 & 2033
- Table 38: Global Cash-in Transit Bag Revenue billion Forecast, by Types 2020 & 2033
- Table 39: Global Cash-in Transit Bag Revenue billion Forecast, by Country 2020 & 2033
- Table 40: China Cash-in Transit Bag Revenue (billion) Forecast, by Application 2020 & 2033
- Table 41: India Cash-in Transit Bag Revenue (billion) Forecast, by Application 2020 & 2033
- Table 42: Japan Cash-in Transit Bag Revenue (billion) Forecast, by Application 2020 & 2033
- Table 43: South Korea Cash-in Transit Bag Revenue (billion) Forecast, by Application 2020 & 2033
- Table 44: ASEAN Cash-in Transit Bag Revenue (billion) Forecast, by Application 2020 & 2033
- Table 45: Oceania Cash-in Transit Bag Revenue (billion) Forecast, by Application 2020 & 2033
- Table 46: Rest of Asia Pacific Cash-in Transit Bag Revenue (billion) Forecast, by Application 2020 & 2033
Frequently Asked Questions
1. What is the projected Compound Annual Growth Rate (CAGR) of the Cash-in Transit Bag?
The projected CAGR is approximately 11.93%.
2. Which companies are prominent players in the Cash-in Transit Bag?
Key companies in the market include ProAmpac, Coveris Holdings, Dynaflex, Nelmar Security Packaging Systems, Korozo Ambalaj, Truseal, Illinois Tool Works, Initial Packaging Solutions, A. Rifkin, Packaging Horizons, Harcor, Leghorn.
3. What are the main segments of the Cash-in Transit Bag?
The market segments include Application, Types.
4. Can you provide details about the market size?
The market size is estimated to be USD 10.68 billion as of 2022.
5. What are some drivers contributing to market growth?
N/A
6. What are the notable trends driving market growth?
N/A
7. Are there any restraints impacting market growth?
N/A
8. Can you provide examples of recent developments in the market?
N/A
9. What pricing options are available for accessing the report?
Pricing options include single-user, multi-user, and enterprise licenses priced at USD 4900.00, USD 7350.00, and USD 9800.00 respectively.
10. Is the market size provided in terms of value or volume?
The market size is provided in terms of value, measured in billion.
11. Are there any specific market keywords associated with the report?
Yes, the market keyword associated with the report is "Cash-in Transit Bag," which aids in identifying and referencing the specific market segment covered.
12. How do I determine which pricing option suits my needs best?
The pricing options vary based on user requirements and access needs. Individual users may opt for single-user licenses, while businesses requiring broader access may choose multi-user or enterprise licenses for cost-effective access to the report.
13. Are there any additional resources or data provided in the Cash-in Transit Bag report?
While the report offers comprehensive insights, it's advisable to review the specific contents or supplementary materials provided to ascertain if additional resources or data are available.
14. How can I stay updated on further developments or reports in the Cash-in Transit Bag?
To stay informed about further developments, trends, and reports in the Cash-in Transit Bag, consider subscribing to industry newsletters, following relevant companies and organizations, or regularly checking reputable industry news sources and publications.
Methodology
Step 1 - Identification of Relevant Samples Size from Population Database


Step 2 - Approaches for Defining Global Market Size (Value, Volume* & Price*)

Note*: In applicable scenarios
Step 3 - Data Sources
Primary Research
- Web Analytics
- Survey Reports
- Research Institute
- Latest Research Reports
- Opinion Leaders
Secondary Research
- Annual Reports
- White Paper
- Latest Press Release
- Industry Association
- Paid Database
- Investor Presentations

Step 4 - Data Triangulation
Involves using different sources of information in order to increase the validity of a study
These sources are likely to be stakeholders in a program - participants, other researchers, program staff, other community members, and so on.
Then we put all data in single framework & apply various statistical tools to find out the dynamic on the market.
During the analysis stage, feedback from the stakeholder groups would be compared to determine areas of agreement as well as areas of divergence