

Key Insights
The global car tire chain market is projected for substantial growth, expected to reach $463.4 million by 2024 and expand further by 2033. This expansion is driven by a Compound Annual Growth Rate (CAGR) of 5.3%, reflecting increasing demand for advanced vehicle traction and safety solutions. Key growth factors include rising vehicle adoption in emerging economies, mandates for winter driving equipment in specific regions, and enhanced consumer understanding of tire chain benefits in adverse weather. Innovations in materials and design are also contributing to more user-friendly and durable tire chain options. The commercial vehicle sector, vital for continuous logistics during winter, is a significant market contributor, while the private vehicle segment is growing due to increased travel in snowy or icy conditions.
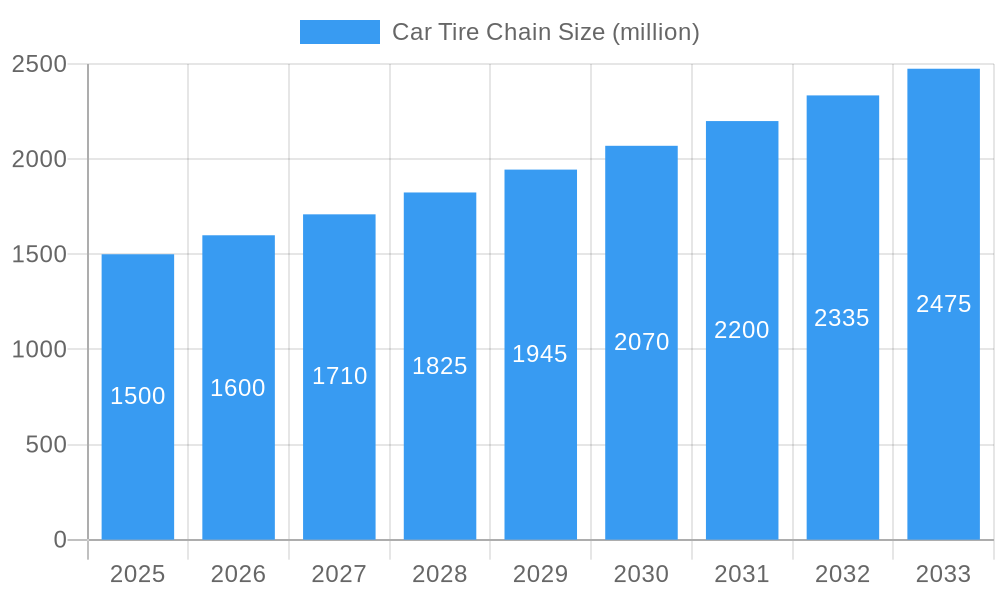
Car Tire Chain Market Size (In Million)
The market features strong competition among established and new manufacturers, with key players focusing on innovations in both rubber and metal chain types. Emerging trends include a preference for lightweight, easily installed tire chains and automated systems for commercial fleets. Market challenges include the seasonal nature of demand and the rise of all-wheel-drive vehicles with sophisticated traction control. However, the electrification of vehicles presents an opportunity, as increased weight and torque may require enhanced traction solutions. The Asia Pacific region, especially China and India, is anticipated to be a high-growth area due to rapid automotive sales and increasing winter conditions.
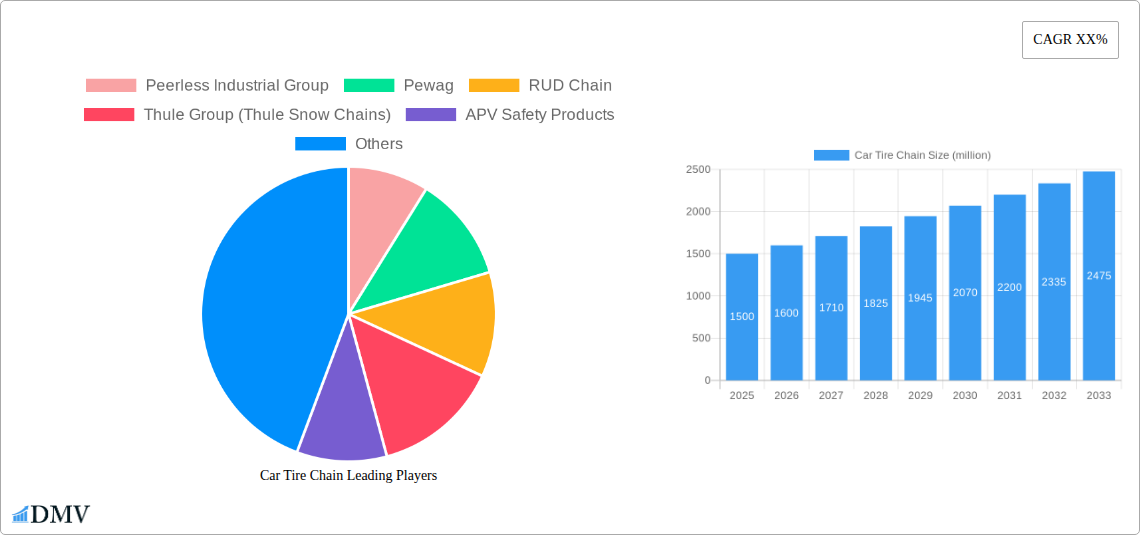
Car Tire Chain Company Market Share
Gain critical insights into the global Car Tire Chain market for strategic decision-making and investor confidence. This comprehensive analysis covers market dynamics, technological advancements, regional trends, and future growth, offering unparalleled value. With a study period extending to 2033 and a base year of 2024, this report provides precise data and actionable intelligence to navigate the evolving tire chain solutions landscape.
Car Tire Chain Market Composition & Trends
The global Car Tire Chain market exhibits a moderate concentration, with key players like Peerless Industrial Group, Pewag, RUD Chain, and Thule Group (Thule Snow Chains) holding substantial market share, estimated to be over 40 million in collective revenue. Innovation remains a primary catalyst, driven by advancements in material science and manufacturing processes, leading to lighter, more durable, and easier-to-install tire chains. Regulatory landscapes, particularly concerning winter driving safety standards in regions like North America and Europe, significantly influence market demand. Substitute products, such as winter tires and studded tires, present a competitive challenge, with their market penetration influencing the demand for traditional tire chains. End-user profiles are diversifying, encompassing individual vehicle owners seeking enhanced safety and commercial fleet operators prioritizing operational continuity in adverse weather. Mergers and acquisitions (M&A) activities, while sporadic, are crucial for market consolidation and expansion, with estimated deal values reaching hundreds of millions for significant acquisitions.
- Market Share Distribution: Leading players collectively control over 50% of the market value.
- Innovation Catalysts: Focus on advanced alloys, composite materials, and user-friendly designs.
- Regulatory Landscapes: Stringent safety mandates in snowy and icy regions.
- Substitute Products: Winter tires and studded tires pose a competitive threat.
- End-User Profiles: Private vehicle owners and commercial fleet operators are key demographics.
- M&A Activities: Strategic consolidation to enhance market presence and product portfolios.
Car Tire Chain Industry Evolution
The Car Tire Chain industry has undergone a significant evolution, marked by consistent growth and adaptation to technological advancements and shifting consumer demands. The historical period from 2019 to 2024 witnessed a steady increase in market value, driven by an increased awareness of winter driving safety and the growing adoption of vehicles in regions with harsh winter climates. The base year of 2025 sees the market at an estimated value of over 3,500 million, with a projected compound annual growth rate (CAGR) of approximately 4.5% for the forecast period of 2025–2033. Technological advancements have been pivotal, moving from traditional heavy iron chains to lighter, more durable rubber chains and innovative composite materials. These innovations have improved ease of installation, reduced vehicle damage, and enhanced traction performance, directly addressing consumer pain points. Shifting consumer demands have also played a crucial role, with a growing preference for user-friendly solutions that offer robust safety without compromising on convenience. This has spurred the development of automatic tensioning systems and quick-fit designs. Furthermore, the increasing global vehicle parc, coupled with a rise in extreme weather events attributed to climate change, has provided a sustained impetus for market growth. The industry has also seen a rise in the demand for specialized tire chains for commercial vehicles, including trucks and buses, to ensure uninterrupted logistics operations during winter months, further contributing to the overall market expansion. The penetration of advanced materials like high-strength steel alloys and reinforced polymers has allowed for more efficient and longer-lasting tire chain solutions, catering to both individual and professional use cases. The industry's trajectory clearly indicates a move towards more sophisticated, safer, and convenient tire chain products that meet the evolving needs of a diverse global customer base.
Leading Regions, Countries, or Segments in Car Tire Chain
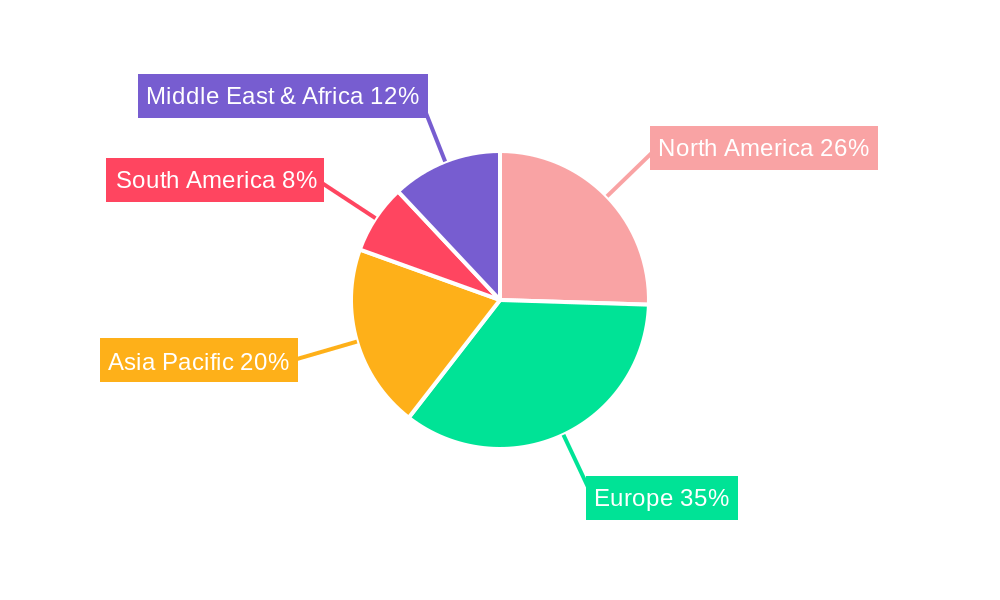
North America and Europe stand out as the dominant regions in the global Car Tire Chain market, driven by a confluence of factors including stringent winter driving regulations, a high density of vehicle ownership, and a historical reliance on tire chains for seasonal traction. Within these regions, specific countries like Canada, the United States, and Nordic nations consistently represent the largest consumer bases. The Application segment of Commercial Vehicles is witnessing robust growth, propelled by the critical need for uninterrupted logistics and transportation services during winter months. For instance, increased investment in winter maintenance infrastructure by governments and private enterprises in these leading regions directly translates into higher demand for reliable tire chain solutions for fleets. The Type segment of Iron Chain continues to hold a significant market share due to its durability and cost-effectiveness for heavy-duty applications, particularly in commercial trucking. However, Rubber Chain is rapidly gaining traction, especially in the Private Vehicles segment, owing to its ease of installation, lower noise levels, and reduced impact on vehicle components.
- Dominant Regions: North America and Europe, owing to severe winter conditions and strict safety regulations.
- Key Countries: Canada, the United States, Norway, Sweden, Finland, and Germany.
- Driving Factors in North America & Europe:
- Regulatory Support: Mandates for winter tires and chains in specific conditions.
- Investment Trends: Government and private investment in road safety and infrastructure.
- Consumer Awareness: High awareness of winter driving risks and safety precautions.
- Vehicle Parc: Large existing base of vehicles requiring seasonal traction aids.
- Dominant Application Segment: Commercial Vehicles, driven by the necessity of maintaining supply chains and logistics operations year-round.
- Growth in Commercial Vehicles: Increased demand for heavy-duty chains for trucks and buses to comply with transport regulations.
- Emerging Trend in Private Vehicles: Growing preference for user-friendly rubber chains and alternative traction devices.
- Type Dominance: Iron Chains remain strong in commercial applications, while Rubber Chains are gaining momentum in the passenger vehicle segment.
Car Tire Chain Product Innovations
Recent product innovations in the Car Tire Chain market are revolutionizing user experience and performance. Manufacturers are increasingly focusing on developing lightweight yet extremely durable chains utilizing advanced alloys and composite materials, significantly reducing installation time and effort. Key advancements include self-tensioning mechanisms, which automatically adjust the chain for optimal fit and grip, eliminating manual adjustments. Additionally, innovative designs like diamond-pattern links and reinforced cross-members are enhancing traction on ice and snow by up to 30% compared to traditional ladder-style chains. Performance metrics are improving with reduced vibration and noise levels, offering a more comfortable ride. The introduction of quick-release systems further simplifies the mounting and dismounting process, making them more accessible to a broader consumer base. Companies like Thule Group and Pewag are at the forefront, offering premium solutions that emphasize both safety and convenience.
Propelling Factors for Car Tire Chain Growth
The Car Tire Chain market is propelled by several key factors: the increasing frequency and intensity of extreme weather events globally, necessitating enhanced vehicle traction and safety; stringent government regulations mandating the use of snow chains in winter conditions across numerous countries, particularly for commercial vehicles; and a growing global vehicle parc, especially in regions prone to snowfall. Furthermore, technological advancements leading to easier-to-use, more durable, and efficient tire chain designs are making them more attractive to consumers. The rising awareness among drivers regarding winter driving safety and the potential for accidents also contributes significantly to market expansion.
Obstacles in the Car Tire Chain Market
Despite robust growth, the Car Tire Chain market faces several obstacles. The evolving nature of winter tires and studded tires presents a significant substitute threat, potentially reducing the demand for traditional chains. Stringent and sometimes inconsistent regulatory landscapes across different regions can create compliance challenges for manufacturers. Supply chain disruptions, as witnessed in recent years, can impact raw material availability and production costs, affecting pricing and availability. Moreover, the perceived inconvenience and complexity of installing traditional tire chains can deter some consumers, creating a barrier to adoption.
Future Opportunities in Car Tire Chain
Emerging opportunities in the Car Tire Chain market lie in the development of advanced, eco-friendly materials and smart tire chain technologies, such as those with integrated sensors for real-time performance monitoring. Expansion into developing economies with increasing vehicle ownership and unpredictable winter weather patterns presents a significant growth avenue. The growing e-commerce sector also offers a platform for wider distribution and direct consumer engagement. Furthermore, the increasing demand for specialized chains for electric and hybrid vehicles, which have unique weight and torque characteristics, opens up a niche but lucrative market segment.
Major Players in the Car Tire Chain Ecosystem
- Peerless Industrial Group
- Pewag
- RUD Chain
- Thule Group (Thule Snow Chains)
- APV Safety Products
- Lianyi Rubber Components
- Autoliv
- Maggi Group
- BABAC Tire Chains
- Michelin
- Chainco
- Moose Utility Division
- Hangzhou Felice chain
- Ottinger
- Gowin
- Spikes Spider
- Trygg
- Laclede Chain Manufacturing Company
Key Developments in Car Tire Chain Industry
- 2023: Launch of Thule K-Summit, a premium, easy-to-install snow chain for modern vehicles.
- 2022: Pewag introduces its innovative "Smart-Fit" technology for enhanced user convenience and safety.
- 2022: RUD Chain expands its offering of compact and high-performance chains for SUVs and crossovers.
- 2021: Maggi Group develops new composite materials for lighter and more durable tire chain solutions.
- 2021: Increased focus on sustainable manufacturing processes and recycled materials by several key players.
- 2020: Autoliv invests in R&D for advanced traction systems, including next-generation tire chains.
- 2019: Thule Group acquires Snap-in Tire Chains, strengthening its market position in North America.
Strategic Car Tire Chain Market Forecast
The strategic Car Tire Chain market forecast indicates sustained growth, driven by escalating demand for enhanced vehicle safety in winter conditions and the continuous innovation in product design and materials. The increasing adoption of commercial vehicles in regions with challenging climates, coupled with stricter regulations, will be a significant growth catalyst. Opportunities abound in developing user-friendly, lightweight, and durable solutions, particularly for electric vehicles. The market is poised for a projected value exceeding 5,500 million by 2033, reflecting a healthy CAGR, offering substantial potential for stakeholders investing in advanced traction technologies and expanding their global market reach.
Car Tire Chain Segmentation
-
1. Application
- 1.1. Commercial Vehicles
- 1.2. Private Vehicles
-
2. Types
- 2.1. Rubber Chain
- 2.2. Iron Chain
- 2.3. Others
Car Tire Chain Segmentation By Geography
-
1. North America
- 1.1. United States
- 1.2. Canada
- 1.3. Mexico
-
2. South America
- 2.1. Brazil
- 2.2. Argentina
- 2.3. Rest of South America
-
3. Europe
- 3.1. United Kingdom
- 3.2. Germany
- 3.3. France
- 3.4. Italy
- 3.5. Spain
- 3.6. Russia
- 3.7. Benelux
- 3.8. Nordics
- 3.9. Rest of Europe
-
4. Middle East & Africa
- 4.1. Turkey
- 4.2. Israel
- 4.3. GCC
- 4.4. North Africa
- 4.5. South Africa
- 4.6. Rest of Middle East & Africa
-
5. Asia Pacific
- 5.1. China
- 5.2. India
- 5.3. Japan
- 5.4. South Korea
- 5.5. ASEAN
- 5.6. Oceania
- 5.7. Rest of Asia Pacific
Car Tire Chain Regional Market Share
Geographic Coverage of Car Tire Chain
Car Tire Chain REPORT HIGHLIGHTS
| Aspects | Details |
|---|---|
| Study Period | 2020-2034 |
| Base Year | 2025 |
| Estimated Year | 2026 |
| Forecast Period | 2026-2034 |
| Historical Period | 2020-2025 |
| Growth Rate | CAGR of 5.3% from 2020-2034 |
| Segmentation |
|
Table of Contents
- 1. Introduction
- 1.1. Research Scope
- 1.2. Market Segmentation
- 1.3. Research Methodology
- 1.4. Definitions and Assumptions
- 2. Executive Summary
- 2.1. Introduction
- 3. Market Dynamics
- 3.1. Introduction
- 3.2. Market Drivers
- 3.3. Market Restrains
- 3.4. Market Trends
- 4. Market Factor Analysis
- 4.1. Porters Five Forces
- 4.2. Supply/Value Chain
- 4.3. PESTEL analysis
- 4.4. Market Entropy
- 4.5. Patent/Trademark Analysis
- 5. Global Car Tire Chain Analysis, Insights and Forecast, 2020-2032
- 5.1. Market Analysis, Insights and Forecast - by Application
- 5.1.1. Commercial Vehicles
- 5.1.2. Private Vehicles
- 5.2. Market Analysis, Insights and Forecast - by Types
- 5.2.1. Rubber Chain
- 5.2.2. Iron Chain
- 5.2.3. Others
- 5.3. Market Analysis, Insights and Forecast - by Region
- 5.3.1. North America
- 5.3.2. South America
- 5.3.3. Europe
- 5.3.4. Middle East & Africa
- 5.3.5. Asia Pacific
- 5.1. Market Analysis, Insights and Forecast - by Application
- 6. North America Car Tire Chain Analysis, Insights and Forecast, 2020-2032
- 6.1. Market Analysis, Insights and Forecast - by Application
- 6.1.1. Commercial Vehicles
- 6.1.2. Private Vehicles
- 6.2. Market Analysis, Insights and Forecast - by Types
- 6.2.1. Rubber Chain
- 6.2.2. Iron Chain
- 6.2.3. Others
- 6.1. Market Analysis, Insights and Forecast - by Application
- 7. South America Car Tire Chain Analysis, Insights and Forecast, 2020-2032
- 7.1. Market Analysis, Insights and Forecast - by Application
- 7.1.1. Commercial Vehicles
- 7.1.2. Private Vehicles
- 7.2. Market Analysis, Insights and Forecast - by Types
- 7.2.1. Rubber Chain
- 7.2.2. Iron Chain
- 7.2.3. Others
- 7.1. Market Analysis, Insights and Forecast - by Application
- 8. Europe Car Tire Chain Analysis, Insights and Forecast, 2020-2032
- 8.1. Market Analysis, Insights and Forecast - by Application
- 8.1.1. Commercial Vehicles
- 8.1.2. Private Vehicles
- 8.2. Market Analysis, Insights and Forecast - by Types
- 8.2.1. Rubber Chain
- 8.2.2. Iron Chain
- 8.2.3. Others
- 8.1. Market Analysis, Insights and Forecast - by Application
- 9. Middle East & Africa Car Tire Chain Analysis, Insights and Forecast, 2020-2032
- 9.1. Market Analysis, Insights and Forecast - by Application
- 9.1.1. Commercial Vehicles
- 9.1.2. Private Vehicles
- 9.2. Market Analysis, Insights and Forecast - by Types
- 9.2.1. Rubber Chain
- 9.2.2. Iron Chain
- 9.2.3. Others
- 9.1. Market Analysis, Insights and Forecast - by Application
- 10. Asia Pacific Car Tire Chain Analysis, Insights and Forecast, 2020-2032
- 10.1. Market Analysis, Insights and Forecast - by Application
- 10.1.1. Commercial Vehicles
- 10.1.2. Private Vehicles
- 10.2. Market Analysis, Insights and Forecast - by Types
- 10.2.1. Rubber Chain
- 10.2.2. Iron Chain
- 10.2.3. Others
- 10.1. Market Analysis, Insights and Forecast - by Application
- 11. Competitive Analysis
- 11.1. Global Market Share Analysis 2025
- 11.2. Company Profiles
- 11.2.1 Peerless Industrial Group
- 11.2.1.1. Overview
- 11.2.1.2. Products
- 11.2.1.3. SWOT Analysis
- 11.2.1.4. Recent Developments
- 11.2.1.5. Financials (Based on Availability)
- 11.2.2 Pewag
- 11.2.2.1. Overview
- 11.2.2.2. Products
- 11.2.2.3. SWOT Analysis
- 11.2.2.4. Recent Developments
- 11.2.2.5. Financials (Based on Availability)
- 11.2.3 RUD Chain
- 11.2.3.1. Overview
- 11.2.3.2. Products
- 11.2.3.3. SWOT Analysis
- 11.2.3.4. Recent Developments
- 11.2.3.5. Financials (Based on Availability)
- 11.2.4 Thule Group (Thule Snow Chains)
- 11.2.4.1. Overview
- 11.2.4.2. Products
- 11.2.4.3. SWOT Analysis
- 11.2.4.4. Recent Developments
- 11.2.4.5. Financials (Based on Availability)
- 11.2.5 APV Safety Products
- 11.2.5.1. Overview
- 11.2.5.2. Products
- 11.2.5.3. SWOT Analysis
- 11.2.5.4. Recent Developments
- 11.2.5.5. Financials (Based on Availability)
- 11.2.6 Lianyi Rubber Components
- 11.2.6.1. Overview
- 11.2.6.2. Products
- 11.2.6.3. SWOT Analysis
- 11.2.6.4. Recent Developments
- 11.2.6.5. Financials (Based on Availability)
- 11.2.7 Autoliv
- 11.2.7.1. Overview
- 11.2.7.2. Products
- 11.2.7.3. SWOT Analysis
- 11.2.7.4. Recent Developments
- 11.2.7.5. Financials (Based on Availability)
- 11.2.8 Maggi Group
- 11.2.8.1. Overview
- 11.2.8.2. Products
- 11.2.8.3. SWOT Analysis
- 11.2.8.4. Recent Developments
- 11.2.8.5. Financials (Based on Availability)
- 11.2.9 BABAC Tire Chains
- 11.2.9.1. Overview
- 11.2.9.2. Products
- 11.2.9.3. SWOT Analysis
- 11.2.9.4. Recent Developments
- 11.2.9.5. Financials (Based on Availability)
- 11.2.10 Michelin
- 11.2.10.1. Overview
- 11.2.10.2. Products
- 11.2.10.3. SWOT Analysis
- 11.2.10.4. Recent Developments
- 11.2.10.5. Financials (Based on Availability)
- 11.2.11 Chainco
- 11.2.11.1. Overview
- 11.2.11.2. Products
- 11.2.11.3. SWOT Analysis
- 11.2.11.4. Recent Developments
- 11.2.11.5. Financials (Based on Availability)
- 11.2.12 Moose Utility Division
- 11.2.12.1. Overview
- 11.2.12.2. Products
- 11.2.12.3. SWOT Analysis
- 11.2.12.4. Recent Developments
- 11.2.12.5. Financials (Based on Availability)
- 11.2.13 Hangzhou Felice chain
- 11.2.13.1. Overview
- 11.2.13.2. Products
- 11.2.13.3. SWOT Analysis
- 11.2.13.4. Recent Developments
- 11.2.13.5. Financials (Based on Availability)
- 11.2.14 Ottinger
- 11.2.14.1. Overview
- 11.2.14.2. Products
- 11.2.14.3. SWOT Analysis
- 11.2.14.4. Recent Developments
- 11.2.14.5. Financials (Based on Availability)
- 11.2.15 Gowin
- 11.2.15.1. Overview
- 11.2.15.2. Products
- 11.2.15.3. SWOT Analysis
- 11.2.15.4. Recent Developments
- 11.2.15.5. Financials (Based on Availability)
- 11.2.16 Spikes Spider
- 11.2.16.1. Overview
- 11.2.16.2. Products
- 11.2.16.3. SWOT Analysis
- 11.2.16.4. Recent Developments
- 11.2.16.5. Financials (Based on Availability)
- 11.2.17 Trygg
- 11.2.17.1. Overview
- 11.2.17.2. Products
- 11.2.17.3. SWOT Analysis
- 11.2.17.4. Recent Developments
- 11.2.17.5. Financials (Based on Availability)
- 11.2.18 Laclede Chain Manufacturing Company
- 11.2.18.1. Overview
- 11.2.18.2. Products
- 11.2.18.3. SWOT Analysis
- 11.2.18.4. Recent Developments
- 11.2.18.5. Financials (Based on Availability)
- 11.2.1 Peerless Industrial Group
List of Figures
- Figure 1: Global Car Tire Chain Revenue Breakdown (million, %) by Region 2025 & 2033
- Figure 2: North America Car Tire Chain Revenue (million), by Application 2025 & 2033
- Figure 3: North America Car Tire Chain Revenue Share (%), by Application 2025 & 2033
- Figure 4: North America Car Tire Chain Revenue (million), by Types 2025 & 2033
- Figure 5: North America Car Tire Chain Revenue Share (%), by Types 2025 & 2033
- Figure 6: North America Car Tire Chain Revenue (million), by Country 2025 & 2033
- Figure 7: North America Car Tire Chain Revenue Share (%), by Country 2025 & 2033
- Figure 8: South America Car Tire Chain Revenue (million), by Application 2025 & 2033
- Figure 9: South America Car Tire Chain Revenue Share (%), by Application 2025 & 2033
- Figure 10: South America Car Tire Chain Revenue (million), by Types 2025 & 2033
- Figure 11: South America Car Tire Chain Revenue Share (%), by Types 2025 & 2033
- Figure 12: South America Car Tire Chain Revenue (million), by Country 2025 & 2033
- Figure 13: South America Car Tire Chain Revenue Share (%), by Country 2025 & 2033
- Figure 14: Europe Car Tire Chain Revenue (million), by Application 2025 & 2033
- Figure 15: Europe Car Tire Chain Revenue Share (%), by Application 2025 & 2033
- Figure 16: Europe Car Tire Chain Revenue (million), by Types 2025 & 2033
- Figure 17: Europe Car Tire Chain Revenue Share (%), by Types 2025 & 2033
- Figure 18: Europe Car Tire Chain Revenue (million), by Country 2025 & 2033
- Figure 19: Europe Car Tire Chain Revenue Share (%), by Country 2025 & 2033
- Figure 20: Middle East & Africa Car Tire Chain Revenue (million), by Application 2025 & 2033
- Figure 21: Middle East & Africa Car Tire Chain Revenue Share (%), by Application 2025 & 2033
- Figure 22: Middle East & Africa Car Tire Chain Revenue (million), by Types 2025 & 2033
- Figure 23: Middle East & Africa Car Tire Chain Revenue Share (%), by Types 2025 & 2033
- Figure 24: Middle East & Africa Car Tire Chain Revenue (million), by Country 2025 & 2033
- Figure 25: Middle East & Africa Car Tire Chain Revenue Share (%), by Country 2025 & 2033
- Figure 26: Asia Pacific Car Tire Chain Revenue (million), by Application 2025 & 2033
- Figure 27: Asia Pacific Car Tire Chain Revenue Share (%), by Application 2025 & 2033
- Figure 28: Asia Pacific Car Tire Chain Revenue (million), by Types 2025 & 2033
- Figure 29: Asia Pacific Car Tire Chain Revenue Share (%), by Types 2025 & 2033
- Figure 30: Asia Pacific Car Tire Chain Revenue (million), by Country 2025 & 2033
- Figure 31: Asia Pacific Car Tire Chain Revenue Share (%), by Country 2025 & 2033
List of Tables
- Table 1: Global Car Tire Chain Revenue million Forecast, by Application 2020 & 2033
- Table 2: Global Car Tire Chain Revenue million Forecast, by Types 2020 & 2033
- Table 3: Global Car Tire Chain Revenue million Forecast, by Region 2020 & 2033
- Table 4: Global Car Tire Chain Revenue million Forecast, by Application 2020 & 2033
- Table 5: Global Car Tire Chain Revenue million Forecast, by Types 2020 & 2033
- Table 6: Global Car Tire Chain Revenue million Forecast, by Country 2020 & 2033
- Table 7: United States Car Tire Chain Revenue (million) Forecast, by Application 2020 & 2033
- Table 8: Canada Car Tire Chain Revenue (million) Forecast, by Application 2020 & 2033
- Table 9: Mexico Car Tire Chain Revenue (million) Forecast, by Application 2020 & 2033
- Table 10: Global Car Tire Chain Revenue million Forecast, by Application 2020 & 2033
- Table 11: Global Car Tire Chain Revenue million Forecast, by Types 2020 & 2033
- Table 12: Global Car Tire Chain Revenue million Forecast, by Country 2020 & 2033
- Table 13: Brazil Car Tire Chain Revenue (million) Forecast, by Application 2020 & 2033
- Table 14: Argentina Car Tire Chain Revenue (million) Forecast, by Application 2020 & 2033
- Table 15: Rest of South America Car Tire Chain Revenue (million) Forecast, by Application 2020 & 2033
- Table 16: Global Car Tire Chain Revenue million Forecast, by Application 2020 & 2033
- Table 17: Global Car Tire Chain Revenue million Forecast, by Types 2020 & 2033
- Table 18: Global Car Tire Chain Revenue million Forecast, by Country 2020 & 2033
- Table 19: United Kingdom Car Tire Chain Revenue (million) Forecast, by Application 2020 & 2033
- Table 20: Germany Car Tire Chain Revenue (million) Forecast, by Application 2020 & 2033
- Table 21: France Car Tire Chain Revenue (million) Forecast, by Application 2020 & 2033
- Table 22: Italy Car Tire Chain Revenue (million) Forecast, by Application 2020 & 2033
- Table 23: Spain Car Tire Chain Revenue (million) Forecast, by Application 2020 & 2033
- Table 24: Russia Car Tire Chain Revenue (million) Forecast, by Application 2020 & 2033
- Table 25: Benelux Car Tire Chain Revenue (million) Forecast, by Application 2020 & 2033
- Table 26: Nordics Car Tire Chain Revenue (million) Forecast, by Application 2020 & 2033
- Table 27: Rest of Europe Car Tire Chain Revenue (million) Forecast, by Application 2020 & 2033
- Table 28: Global Car Tire Chain Revenue million Forecast, by Application 2020 & 2033
- Table 29: Global Car Tire Chain Revenue million Forecast, by Types 2020 & 2033
- Table 30: Global Car Tire Chain Revenue million Forecast, by Country 2020 & 2033
- Table 31: Turkey Car Tire Chain Revenue (million) Forecast, by Application 2020 & 2033
- Table 32: Israel Car Tire Chain Revenue (million) Forecast, by Application 2020 & 2033
- Table 33: GCC Car Tire Chain Revenue (million) Forecast, by Application 2020 & 2033
- Table 34: North Africa Car Tire Chain Revenue (million) Forecast, by Application 2020 & 2033
- Table 35: South Africa Car Tire Chain Revenue (million) Forecast, by Application 2020 & 2033
- Table 36: Rest of Middle East & Africa Car Tire Chain Revenue (million) Forecast, by Application 2020 & 2033
- Table 37: Global Car Tire Chain Revenue million Forecast, by Application 2020 & 2033
- Table 38: Global Car Tire Chain Revenue million Forecast, by Types 2020 & 2033
- Table 39: Global Car Tire Chain Revenue million Forecast, by Country 2020 & 2033
- Table 40: China Car Tire Chain Revenue (million) Forecast, by Application 2020 & 2033
- Table 41: India Car Tire Chain Revenue (million) Forecast, by Application 2020 & 2033
- Table 42: Japan Car Tire Chain Revenue (million) Forecast, by Application 2020 & 2033
- Table 43: South Korea Car Tire Chain Revenue (million) Forecast, by Application 2020 & 2033
- Table 44: ASEAN Car Tire Chain Revenue (million) Forecast, by Application 2020 & 2033
- Table 45: Oceania Car Tire Chain Revenue (million) Forecast, by Application 2020 & 2033
- Table 46: Rest of Asia Pacific Car Tire Chain Revenue (million) Forecast, by Application 2020 & 2033
Frequently Asked Questions
1. What is the projected Compound Annual Growth Rate (CAGR) of the Car Tire Chain?
The projected CAGR is approximately 5.3%.
2. Which companies are prominent players in the Car Tire Chain?
Key companies in the market include Peerless Industrial Group, Pewag, RUD Chain, Thule Group (Thule Snow Chains), APV Safety Products, Lianyi Rubber Components, Autoliv, Maggi Group, BABAC Tire Chains, Michelin, Chainco, Moose Utility Division, Hangzhou Felice chain, Ottinger, Gowin, Spikes Spider, Trygg, Laclede Chain Manufacturing Company.
3. What are the main segments of the Car Tire Chain?
The market segments include Application, Types.
4. Can you provide details about the market size?
The market size is estimated to be USD 463.4 million as of 2022.
5. What are some drivers contributing to market growth?
N/A
6. What are the notable trends driving market growth?
N/A
7. Are there any restraints impacting market growth?
N/A
8. Can you provide examples of recent developments in the market?
N/A
9. What pricing options are available for accessing the report?
Pricing options include single-user, multi-user, and enterprise licenses priced at USD 2900.00, USD 4350.00, and USD 5800.00 respectively.
10. Is the market size provided in terms of value or volume?
The market size is provided in terms of value, measured in million.
11. Are there any specific market keywords associated with the report?
Yes, the market keyword associated with the report is "Car Tire Chain," which aids in identifying and referencing the specific market segment covered.
12. How do I determine which pricing option suits my needs best?
The pricing options vary based on user requirements and access needs. Individual users may opt for single-user licenses, while businesses requiring broader access may choose multi-user or enterprise licenses for cost-effective access to the report.
13. Are there any additional resources or data provided in the Car Tire Chain report?
While the report offers comprehensive insights, it's advisable to review the specific contents or supplementary materials provided to ascertain if additional resources or data are available.
14. How can I stay updated on further developments or reports in the Car Tire Chain?
To stay informed about further developments, trends, and reports in the Car Tire Chain, consider subscribing to industry newsletters, following relevant companies and organizations, or regularly checking reputable industry news sources and publications.
Methodology
Step 1 - Identification of Relevant Samples Size from Population Database


Step 2 - Approaches for Defining Global Market Size (Value, Volume* & Price*)

Note*: In applicable scenarios
Step 3 - Data Sources
Primary Research
- Web Analytics
- Survey Reports
- Research Institute
- Latest Research Reports
- Opinion Leaders
Secondary Research
- Annual Reports
- White Paper
- Latest Press Release
- Industry Association
- Paid Database
- Investor Presentations

Step 4 - Data Triangulation
Involves using different sources of information in order to increase the validity of a study
These sources are likely to be stakeholders in a program - participants, other researchers, program staff, other community members, and so on.
Then we put all data in single framework & apply various statistical tools to find out the dynamic on the market.
During the analysis stage, feedback from the stakeholder groups would be compared to determine areas of agreement as well as areas of divergence