

Key Insights
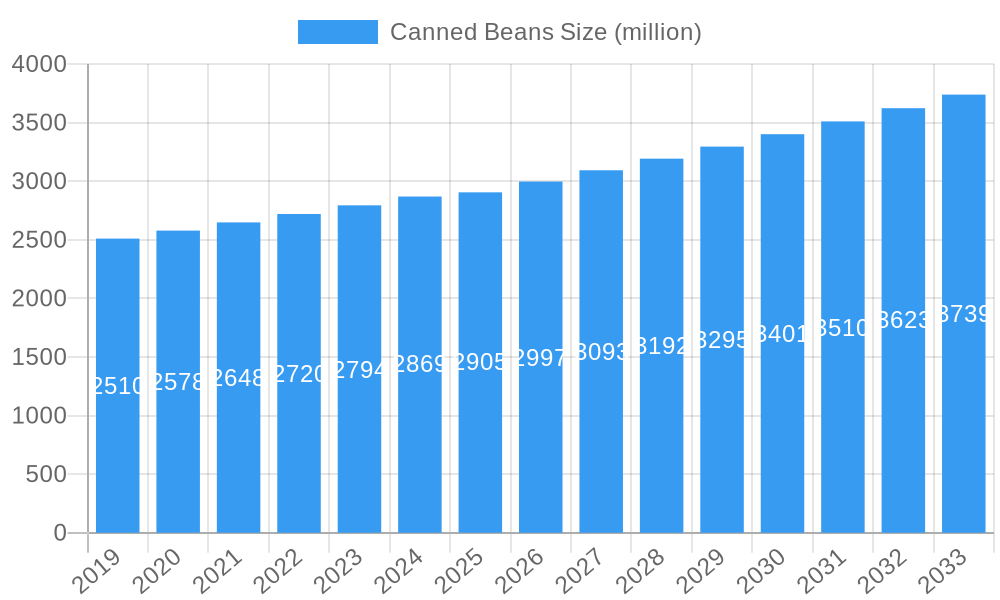
The global canned beans market is projected to reach approximately \$2,905 million, demonstrating a steady Compound Annual Growth Rate (CAGR) of 3.2% from 2019 to 2033. This consistent growth is underpinned by a confluence of factors, including the increasing consumer preference for convenient and shelf-stable food options, a rising awareness of the nutritional benefits of beans (such as high protein, fiber, and essential vitamins), and their versatility in various culinary applications. The demand for canned beans is particularly strong in North America and Europe, driven by established consumption patterns and the presence of major food manufacturers. Emerging economies in Asia Pacific and other regions are also showing significant potential for growth as urbanization accelerates and dietary habits evolve to incorporate more plant-based and convenient foods. The market's expansion is further fueled by ongoing product innovation, including the introduction of flavored and seasoned canned beans, as well as options catering to specific dietary needs like low-sodium or organic varieties.
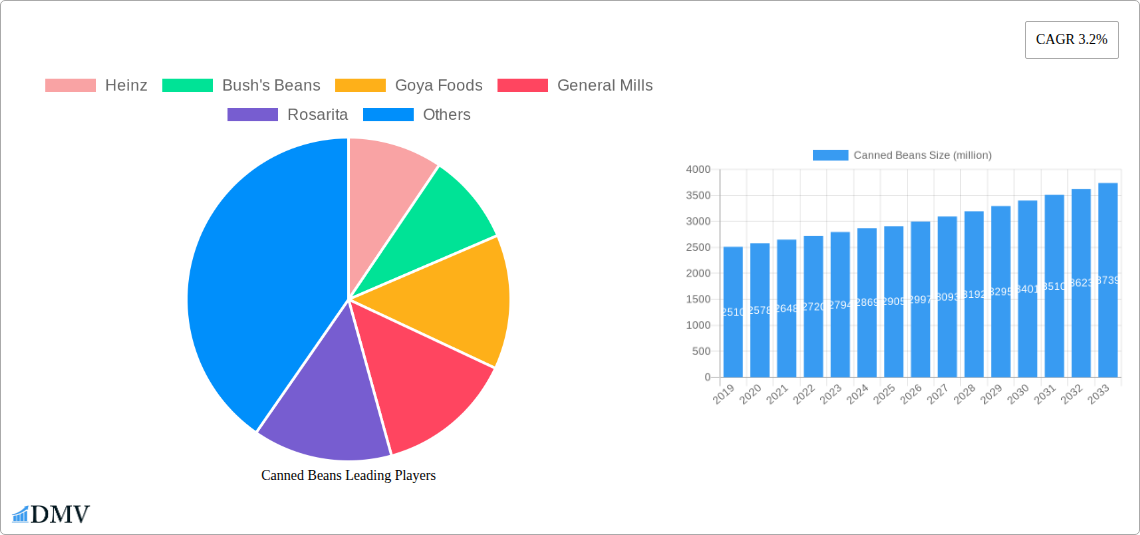
Canned Beans Market Size (In Billion)
The market is segmented into various applications, with "Dishes" and "Soup" likely representing the largest segments due to the extensive use of canned beans as a base ingredient. "Salad" and "Others," encompassing snacks and side dishes, also contribute significantly to overall market demand. In terms of types, Navy Beans, Pinto Beans, and Kidney Beans are expected to dominate, owing to their widespread popularity and culinary adaptability. The competitive landscape features established players like Heinz, Bush's Beans, and Goya Foods, alongside private label brands from major retailers such as Kroger. These companies are actively engaged in marketing campaigns, product development, and strategic partnerships to capture market share. While the market benefits from its affordability and accessibility, potential restraints could include fluctuating raw material prices for beans and packaging, as well as increasing competition from fresh and frozen bean alternatives, which may pose a challenge in certain consumer segments.
Canned Beans Company Market Share
Canned Beans Market Composition & Trends
The global canned beans market is characterized by a moderate to high market concentration, with a few dominant players like Heinz, Bush's Beans, and Goya Foods holding substantial market share, estimated at over 70% combined. Innovation catalysts are primarily driven by health-conscious consumer demand for low-sodium, organic, and plant-based protein options. The regulatory landscape is largely focused on food safety standards and labeling requirements, with agencies like the FDA setting benchmarks. Substitute products include fresh beans, frozen beans, and other protein sources like lentils and chickpeas. End-user profiles are diverse, ranging from busy households seeking convenient meal solutions to health-conscious individuals prioritizing plant-based nutrition. Merger and acquisition (M&A) activities are strategically driven, aiming to expand product portfolios and market reach. Recent M&A deals in the broader food preservation sector have reached values in the hundreds of millions, indicating potential for significant consolidation. The market for canned beans, estimated at over $6,000 million in 2025, is poised for sustained growth, driven by convenience and nutritional benefits.
- Market Share Distribution: Top 3 players hold approximately 70% of the market share.
- M&A Deal Values: Significant transactions in the broader food preservation market are in the range of $200-$500 million.
- Innovation Focus: Health and wellness, plant-based alternatives, and convenient meal solutions.
Canned Beans Industry Evolution
The canned beans industry has witnessed a remarkable evolution throughout the historical period of 2019–2024 and is projected to continue its upward trajectory through the forecast period of 2025–2033. Fueled by a growing global population and increasing urbanization, the demand for convenient, shelf-stable food products has been a consistent growth driver. During the historical period, the market size for canned beans was estimated to be over $4,500 million in 2019, demonstrating a healthy baseline. Technological advancements in processing and packaging have been instrumental in enhancing product quality, extending shelf life, and improving the nutritional profile of canned beans. Innovations in canning techniques have minimized nutrient loss and preserved the natural taste and texture of beans, making them a more appealing option for consumers. Furthermore, advancements in automated production lines and efficient supply chain management have contributed to cost optimization and increased accessibility.
Shifting consumer demands have played a pivotal role in shaping the industry's evolution. There has been a noticeable surge in consumer interest towards healthier food choices, leading to a significant demand for low-sodium, organic, and non-GMO canned beans. This trend has prompted manufacturers to reformulate their products and introduce new lines catering to these preferences. The rise of plant-based diets and flexitarianism has also propelled the consumption of beans as a versatile and affordable protein source. This dietary shift has broadened the appeal of canned beans beyond traditional culinary applications. Growth rates during the historical period averaged between 3% and 4.5% annually, a testament to the industry's resilience and adaptability. The base year of 2025 is projected to see the market reach an estimated value of over $6,000 million, with continued growth anticipated. Adoption metrics for specialized products like organic and low-sodium variants have seen an upward trend, often outpacing the overall market growth. The industry's ability to respond to these evolving consumer needs, coupled with ongoing technological innovation, positions the canned beans market for robust expansion in the coming years.
Leading Regions, Countries, or Segments in Canned Beans
North America, particularly the United States, stands as the dominant region in the canned beans market, driven by a confluence of factors that foster sustained demand and market growth. The estimated market value for canned beans in this region in 2025 is projected to exceed $2,500 million. This dominance is underpinned by a deeply ingrained consumer preference for convenience foods, a strong presence of leading manufacturers such as Heinz, Bush's Beans, and General Mills, and a well-established retail infrastructure that ensures widespread availability. Investment trends in the food processing sector within North America are consistently high, with companies allocating substantial capital towards research and development, as well as modernizing production facilities to meet the growing demand. Regulatory support, primarily focused on food safety and clear labeling, provides a stable operating environment for manufacturers.
Within North America, specific segments are exhibiting exceptional growth. The Application: Dishes segment is a significant contributor, with canned beans being a staple ingredient in a multitude of popular recipes, from chili and tacos to casseroles and baked beans. The Types: Pinto Beans and Kidney Beans are particularly popular due to their versatility and mild flavor profile, making them suitable for a wide array of culinary applications. Investment trends in product innovation within these segments focus on convenience and health-conscious attributes, such as pre-seasoned varieties and options with reduced sodium content. Market share for Pinto Beans and Kidney Beans individually is estimated to be around 20% and 18% respectively within the overall canned beans market.
Furthermore, the increasing adoption of plant-based diets and a general trend towards healthier eating habits are bolstering the demand for canned beans as a primary source of plant-based protein. This has led to a surge in demand for organic and non-GMO canned beans, further solidifying the market's growth trajectory. The "Others" application segment, which includes snacks and appetizers, is also showing promising growth, driven by the demand for convenient and healthy snacking options. The robust economic conditions, coupled with a strong consumer appetite for versatile and affordable food products, create a fertile ground for the continued expansion of the canned beans market in North America.
- Dominant Region: North America (especially the United States).
- Key Drivers in North America:
- High consumer demand for convenience.
- Strong presence of major manufacturers.
- Extensive retail distribution networks.
- Significant investment in R&D and production.
- Supportive regulatory environment for food safety.
- Leading Segments:
- Application: Dishes (e.g., chili, tacos, casseroles).
- Types: Pinto Beans, Kidney Beans.
- Emerging Segment: Others (snacks, appetizers).
- Investment Trends: Focus on organic, low-sodium, and plant-based protein options.
Canned Beans Product Innovations
Product innovations in the canned beans market are increasingly centered on enhancing consumer appeal and nutritional value. Companies are developing low-sodium and no-salt-added varieties to cater to health-conscious consumers, while also introducing organic and non-GMO options to align with evolving dietary preferences. The integration of plant-based protein blends, incorporating other legumes and grains, is another notable innovation, expanding the versatility of canned beans as a complete protein source for vegan and vegetarian diets. These innovations aim to differentiate products in a competitive market, with performance metrics focusing on taste, texture, and nutrient retention, ensuring that canned beans remain a convenient and wholesome food choice.
Propelling Factors for Canned Beans Growth
The canned beans market is propelled by several interconnected factors. Technologically, advancements in canning and preservation techniques ensure higher quality and longer shelf life, making them a convenient staple. Economically, canned beans offer an affordable source of protein and essential nutrients, appealing to a broad consumer base, especially during periods of economic fluctuation. Regulatory shifts favoring healthier food options, such as the demand for reduced sodium content, are also a significant driver, prompting manufacturers to innovate and align their offerings with consumer well-being. The growing trend of plant-based diets further amplifies demand, positioning canned beans as a versatile and sustainable protein choice.
Obstacles in the Canned Beans Market
Despite its growth potential, the canned beans market faces certain obstacles. Regulatory challenges, such as evolving food labeling requirements and the need for stringent quality control, can increase operational costs. Supply chain disruptions, exacerbated by global events, can impact the availability and cost of raw materials and transportation. Competitive pressures from alternative protein sources and the increasing availability of fresh and frozen produce also pose a threat. Furthermore, some consumers may perceive canned goods as less fresh or nutritious, necessitating ongoing educational efforts to highlight the benefits and improvements in canned bean products.
Future Opportunities in Canned Beans
Emerging opportunities in the canned beans market are vast. The expanding global middle class presents a significant opportunity for market penetration, particularly in developing economies where convenience foods are gaining traction. Technological advancements in "clean label" processing and the development of innovative flavor profiles offer avenues for product differentiation. The continued rise of plant-based eating habits will further drive demand for canned beans as a key ingredient in a multitude of vegan and vegetarian dishes. Exploring niche markets, such as ready-to-eat meals incorporating canned beans or plant-based meat alternatives, also represents a promising growth avenue.
Major Players in the Canned Beans Ecosystem
- Heinz
- Bush's Beans
- Goya Foods
- General Mills
- Rosarita
- Kroger
- Eden Foods
- Ortega
- Hain Celestial Group
Key Developments in Canned Beans Industry
- 2023: Increased investment in R&D for organic and low-sodium canned bean varieties.
- 2023: Launch of plant-based protein-enriched canned bean products by several major manufacturers.
- 2022: Consolidation in the broader food preservation market leads to strategic acquisitions by key players.
- 2021: Heightened consumer awareness regarding plant-based diets drives demand for versatile canned beans.
- 2020: Supply chain disruptions due to global events prompt manufacturers to diversify sourcing and logistics.
- 2019: Introduction of innovative packaging solutions to enhance convenience and shelf appeal.
Strategic Canned Beans Market Forecast
The strategic canned beans market forecast indicates a promising future, driven by sustained consumer demand for convenient, affordable, and nutritious food options. The ongoing global shift towards plant-based diets and a heightened focus on health and wellness are significant growth catalysts, ensuring a strong demand for canned beans as a versatile protein source. Innovations in product formulation, particularly in low-sodium and organic offerings, coupled with strategic expansion into emerging markets, will further bolster market potential. The industry is expected to experience a compound annual growth rate (CAGR) of approximately 3.5%–4.5% during the forecast period, projecting the market value to exceed $8,000 million by 2033.
Canned Beans Segmentation
-
1. Application
- 1.1. Dishes
- 1.2. Soup
- 1.3. Salad
- 1.4. Others
-
2. Types
- 2.1. Navy Beans
- 2.2. Pinto Beans
- 2.3. Kidney Beans
- 2.4. Others
Canned Beans Segmentation By Geography
-
1. North America
- 1.1. United States
- 1.2. Canada
- 1.3. Mexico
-
2. South America
- 2.1. Brazil
- 2.2. Argentina
- 2.3. Rest of South America
-
3. Europe
- 3.1. United Kingdom
- 3.2. Germany
- 3.3. France
- 3.4. Italy
- 3.5. Spain
- 3.6. Russia
- 3.7. Benelux
- 3.8. Nordics
- 3.9. Rest of Europe
-
4. Middle East & Africa
- 4.1. Turkey
- 4.2. Israel
- 4.3. GCC
- 4.4. North Africa
- 4.5. South Africa
- 4.6. Rest of Middle East & Africa
-
5. Asia Pacific
- 5.1. China
- 5.2. India
- 5.3. Japan
- 5.4. South Korea
- 5.5. ASEAN
- 5.6. Oceania
- 5.7. Rest of Asia Pacific
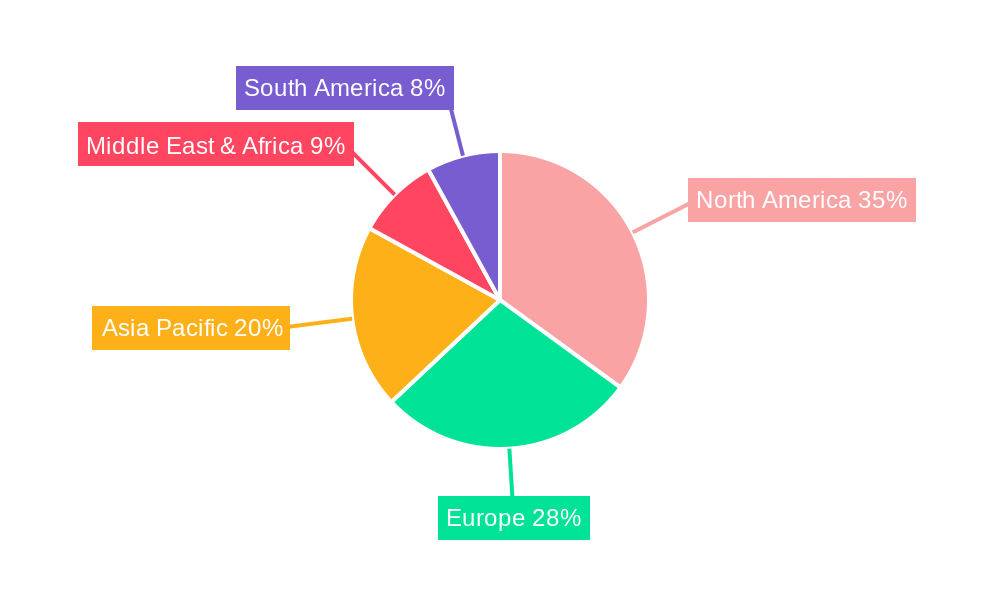
Canned Beans Regional Market Share
Geographic Coverage of Canned Beans
Canned Beans REPORT HIGHLIGHTS
| Aspects | Details |
|---|---|
| Study Period | 2020-2034 |
| Base Year | 2025 |
| Estimated Year | 2026 |
| Forecast Period | 2026-2034 |
| Historical Period | 2020-2025 |
| Growth Rate | CAGR of 2.7% from 2020-2034 |
| Segmentation |
|
Table of Contents
- 1. Introduction
- 1.1. Research Scope
- 1.2. Market Segmentation
- 1.3. Research Methodology
- 1.4. Definitions and Assumptions
- 2. Executive Summary
- 2.1. Introduction
- 3. Market Dynamics
- 3.1. Introduction
- 3.2. Market Drivers
- 3.3. Market Restrains
- 3.4. Market Trends
- 4. Market Factor Analysis
- 4.1. Porters Five Forces
- 4.2. Supply/Value Chain
- 4.3. PESTEL analysis
- 4.4. Market Entropy
- 4.5. Patent/Trademark Analysis
- 5. Global Canned Beans Analysis, Insights and Forecast, 2020-2032
- 5.1. Market Analysis, Insights and Forecast - by Application
- 5.1.1. Dishes
- 5.1.2. Soup
- 5.1.3. Salad
- 5.1.4. Others
- 5.2. Market Analysis, Insights and Forecast - by Types
- 5.2.1. Navy Beans
- 5.2.2. Pinto Beans
- 5.2.3. Kidney Beans
- 5.2.4. Others
- 5.3. Market Analysis, Insights and Forecast - by Region
- 5.3.1. North America
- 5.3.2. South America
- 5.3.3. Europe
- 5.3.4. Middle East & Africa
- 5.3.5. Asia Pacific
- 5.1. Market Analysis, Insights and Forecast - by Application
- 6. North America Canned Beans Analysis, Insights and Forecast, 2020-2032
- 6.1. Market Analysis, Insights and Forecast - by Application
- 6.1.1. Dishes
- 6.1.2. Soup
- 6.1.3. Salad
- 6.1.4. Others
- 6.2. Market Analysis, Insights and Forecast - by Types
- 6.2.1. Navy Beans
- 6.2.2. Pinto Beans
- 6.2.3. Kidney Beans
- 6.2.4. Others
- 6.1. Market Analysis, Insights and Forecast - by Application
- 7. South America Canned Beans Analysis, Insights and Forecast, 2020-2032
- 7.1. Market Analysis, Insights and Forecast - by Application
- 7.1.1. Dishes
- 7.1.2. Soup
- 7.1.3. Salad
- 7.1.4. Others
- 7.2. Market Analysis, Insights and Forecast - by Types
- 7.2.1. Navy Beans
- 7.2.2. Pinto Beans
- 7.2.3. Kidney Beans
- 7.2.4. Others
- 7.1. Market Analysis, Insights and Forecast - by Application
- 8. Europe Canned Beans Analysis, Insights and Forecast, 2020-2032
- 8.1. Market Analysis, Insights and Forecast - by Application
- 8.1.1. Dishes
- 8.1.2. Soup
- 8.1.3. Salad
- 8.1.4. Others
- 8.2. Market Analysis, Insights and Forecast - by Types
- 8.2.1. Navy Beans
- 8.2.2. Pinto Beans
- 8.2.3. Kidney Beans
- 8.2.4. Others
- 8.1. Market Analysis, Insights and Forecast - by Application
- 9. Middle East & Africa Canned Beans Analysis, Insights and Forecast, 2020-2032
- 9.1. Market Analysis, Insights and Forecast - by Application
- 9.1.1. Dishes
- 9.1.2. Soup
- 9.1.3. Salad
- 9.1.4. Others
- 9.2. Market Analysis, Insights and Forecast - by Types
- 9.2.1. Navy Beans
- 9.2.2. Pinto Beans
- 9.2.3. Kidney Beans
- 9.2.4. Others
- 9.1. Market Analysis, Insights and Forecast - by Application
- 10. Asia Pacific Canned Beans Analysis, Insights and Forecast, 2020-2032
- 10.1. Market Analysis, Insights and Forecast - by Application
- 10.1.1. Dishes
- 10.1.2. Soup
- 10.1.3. Salad
- 10.1.4. Others
- 10.2. Market Analysis, Insights and Forecast - by Types
- 10.2.1. Navy Beans
- 10.2.2. Pinto Beans
- 10.2.3. Kidney Beans
- 10.2.4. Others
- 10.1. Market Analysis, Insights and Forecast - by Application
- 11. Competitive Analysis
- 11.1. Global Market Share Analysis 2025
- 11.2. Company Profiles
- 11.2.1 Heinz
- 11.2.1.1. Overview
- 11.2.1.2. Products
- 11.2.1.3. SWOT Analysis
- 11.2.1.4. Recent Developments
- 11.2.1.5. Financials (Based on Availability)
- 11.2.2 Bush's Beans
- 11.2.2.1. Overview
- 11.2.2.2. Products
- 11.2.2.3. SWOT Analysis
- 11.2.2.4. Recent Developments
- 11.2.2.5. Financials (Based on Availability)
- 11.2.3 Goya Foods
- 11.2.3.1. Overview
- 11.2.3.2. Products
- 11.2.3.3. SWOT Analysis
- 11.2.3.4. Recent Developments
- 11.2.3.5. Financials (Based on Availability)
- 11.2.4 General Mills
- 11.2.4.1. Overview
- 11.2.4.2. Products
- 11.2.4.3. SWOT Analysis
- 11.2.4.4. Recent Developments
- 11.2.4.5. Financials (Based on Availability)
- 11.2.5 Rosarita
- 11.2.5.1. Overview
- 11.2.5.2. Products
- 11.2.5.3. SWOT Analysis
- 11.2.5.4. Recent Developments
- 11.2.5.5. Financials (Based on Availability)
- 11.2.6 Kroger
- 11.2.6.1. Overview
- 11.2.6.2. Products
- 11.2.6.3. SWOT Analysis
- 11.2.6.4. Recent Developments
- 11.2.6.5. Financials (Based on Availability)
- 11.2.7 Eden Foods
- 11.2.7.1. Overview
- 11.2.7.2. Products
- 11.2.7.3. SWOT Analysis
- 11.2.7.4. Recent Developments
- 11.2.7.5. Financials (Based on Availability)
- 11.2.8 Ortega
- 11.2.8.1. Overview
- 11.2.8.2. Products
- 11.2.8.3. SWOT Analysis
- 11.2.8.4. Recent Developments
- 11.2.8.5. Financials (Based on Availability)
- 11.2.9 Hain Celestial Group
- 11.2.9.1. Overview
- 11.2.9.2. Products
- 11.2.9.3. SWOT Analysis
- 11.2.9.4. Recent Developments
- 11.2.9.5. Financials (Based on Availability)
- 11.2.1 Heinz
List of Figures
- Figure 1: Global Canned Beans Revenue Breakdown (undefined, %) by Region 2025 & 2033
- Figure 2: North America Canned Beans Revenue (undefined), by Application 2025 & 2033
- Figure 3: North America Canned Beans Revenue Share (%), by Application 2025 & 2033
- Figure 4: North America Canned Beans Revenue (undefined), by Types 2025 & 2033
- Figure 5: North America Canned Beans Revenue Share (%), by Types 2025 & 2033
- Figure 6: North America Canned Beans Revenue (undefined), by Country 2025 & 2033
- Figure 7: North America Canned Beans Revenue Share (%), by Country 2025 & 2033
- Figure 8: South America Canned Beans Revenue (undefined), by Application 2025 & 2033
- Figure 9: South America Canned Beans Revenue Share (%), by Application 2025 & 2033
- Figure 10: South America Canned Beans Revenue (undefined), by Types 2025 & 2033
- Figure 11: South America Canned Beans Revenue Share (%), by Types 2025 & 2033
- Figure 12: South America Canned Beans Revenue (undefined), by Country 2025 & 2033
- Figure 13: South America Canned Beans Revenue Share (%), by Country 2025 & 2033
- Figure 14: Europe Canned Beans Revenue (undefined), by Application 2025 & 2033
- Figure 15: Europe Canned Beans Revenue Share (%), by Application 2025 & 2033
- Figure 16: Europe Canned Beans Revenue (undefined), by Types 2025 & 2033
- Figure 17: Europe Canned Beans Revenue Share (%), by Types 2025 & 2033
- Figure 18: Europe Canned Beans Revenue (undefined), by Country 2025 & 2033
- Figure 19: Europe Canned Beans Revenue Share (%), by Country 2025 & 2033
- Figure 20: Middle East & Africa Canned Beans Revenue (undefined), by Application 2025 & 2033
- Figure 21: Middle East & Africa Canned Beans Revenue Share (%), by Application 2025 & 2033
- Figure 22: Middle East & Africa Canned Beans Revenue (undefined), by Types 2025 & 2033
- Figure 23: Middle East & Africa Canned Beans Revenue Share (%), by Types 2025 & 2033
- Figure 24: Middle East & Africa Canned Beans Revenue (undefined), by Country 2025 & 2033
- Figure 25: Middle East & Africa Canned Beans Revenue Share (%), by Country 2025 & 2033
- Figure 26: Asia Pacific Canned Beans Revenue (undefined), by Application 2025 & 2033
- Figure 27: Asia Pacific Canned Beans Revenue Share (%), by Application 2025 & 2033
- Figure 28: Asia Pacific Canned Beans Revenue (undefined), by Types 2025 & 2033
- Figure 29: Asia Pacific Canned Beans Revenue Share (%), by Types 2025 & 2033
- Figure 30: Asia Pacific Canned Beans Revenue (undefined), by Country 2025 & 2033
- Figure 31: Asia Pacific Canned Beans Revenue Share (%), by Country 2025 & 2033
List of Tables
- Table 1: Global Canned Beans Revenue undefined Forecast, by Application 2020 & 2033
- Table 2: Global Canned Beans Revenue undefined Forecast, by Types 2020 & 2033
- Table 3: Global Canned Beans Revenue undefined Forecast, by Region 2020 & 2033
- Table 4: Global Canned Beans Revenue undefined Forecast, by Application 2020 & 2033
- Table 5: Global Canned Beans Revenue undefined Forecast, by Types 2020 & 2033
- Table 6: Global Canned Beans Revenue undefined Forecast, by Country 2020 & 2033
- Table 7: United States Canned Beans Revenue (undefined) Forecast, by Application 2020 & 2033
- Table 8: Canada Canned Beans Revenue (undefined) Forecast, by Application 2020 & 2033
- Table 9: Mexico Canned Beans Revenue (undefined) Forecast, by Application 2020 & 2033
- Table 10: Global Canned Beans Revenue undefined Forecast, by Application 2020 & 2033
- Table 11: Global Canned Beans Revenue undefined Forecast, by Types 2020 & 2033
- Table 12: Global Canned Beans Revenue undefined Forecast, by Country 2020 & 2033
- Table 13: Brazil Canned Beans Revenue (undefined) Forecast, by Application 2020 & 2033
- Table 14: Argentina Canned Beans Revenue (undefined) Forecast, by Application 2020 & 2033
- Table 15: Rest of South America Canned Beans Revenue (undefined) Forecast, by Application 2020 & 2033
- Table 16: Global Canned Beans Revenue undefined Forecast, by Application 2020 & 2033
- Table 17: Global Canned Beans Revenue undefined Forecast, by Types 2020 & 2033
- Table 18: Global Canned Beans Revenue undefined Forecast, by Country 2020 & 2033
- Table 19: United Kingdom Canned Beans Revenue (undefined) Forecast, by Application 2020 & 2033
- Table 20: Germany Canned Beans Revenue (undefined) Forecast, by Application 2020 & 2033
- Table 21: France Canned Beans Revenue (undefined) Forecast, by Application 2020 & 2033
- Table 22: Italy Canned Beans Revenue (undefined) Forecast, by Application 2020 & 2033
- Table 23: Spain Canned Beans Revenue (undefined) Forecast, by Application 2020 & 2033
- Table 24: Russia Canned Beans Revenue (undefined) Forecast, by Application 2020 & 2033
- Table 25: Benelux Canned Beans Revenue (undefined) Forecast, by Application 2020 & 2033
- Table 26: Nordics Canned Beans Revenue (undefined) Forecast, by Application 2020 & 2033
- Table 27: Rest of Europe Canned Beans Revenue (undefined) Forecast, by Application 2020 & 2033
- Table 28: Global Canned Beans Revenue undefined Forecast, by Application 2020 & 2033
- Table 29: Global Canned Beans Revenue undefined Forecast, by Types 2020 & 2033
- Table 30: Global Canned Beans Revenue undefined Forecast, by Country 2020 & 2033
- Table 31: Turkey Canned Beans Revenue (undefined) Forecast, by Application 2020 & 2033
- Table 32: Israel Canned Beans Revenue (undefined) Forecast, by Application 2020 & 2033
- Table 33: GCC Canned Beans Revenue (undefined) Forecast, by Application 2020 & 2033
- Table 34: North Africa Canned Beans Revenue (undefined) Forecast, by Application 2020 & 2033
- Table 35: South Africa Canned Beans Revenue (undefined) Forecast, by Application 2020 & 2033
- Table 36: Rest of Middle East & Africa Canned Beans Revenue (undefined) Forecast, by Application 2020 & 2033
- Table 37: Global Canned Beans Revenue undefined Forecast, by Application 2020 & 2033
- Table 38: Global Canned Beans Revenue undefined Forecast, by Types 2020 & 2033
- Table 39: Global Canned Beans Revenue undefined Forecast, by Country 2020 & 2033
- Table 40: China Canned Beans Revenue (undefined) Forecast, by Application 2020 & 2033
- Table 41: India Canned Beans Revenue (undefined) Forecast, by Application 2020 & 2033
- Table 42: Japan Canned Beans Revenue (undefined) Forecast, by Application 2020 & 2033
- Table 43: South Korea Canned Beans Revenue (undefined) Forecast, by Application 2020 & 2033
- Table 44: ASEAN Canned Beans Revenue (undefined) Forecast, by Application 2020 & 2033
- Table 45: Oceania Canned Beans Revenue (undefined) Forecast, by Application 2020 & 2033
- Table 46: Rest of Asia Pacific Canned Beans Revenue (undefined) Forecast, by Application 2020 & 2033
Frequently Asked Questions
1. What is the projected Compound Annual Growth Rate (CAGR) of the Canned Beans?
The projected CAGR is approximately 2.7%.
2. Which companies are prominent players in the Canned Beans?
Key companies in the market include Heinz, Bush's Beans, Goya Foods, General Mills, Rosarita, Kroger, Eden Foods, Ortega, Hain Celestial Group.
3. What are the main segments of the Canned Beans?
The market segments include Application, Types.
4. Can you provide details about the market size?
The market size is estimated to be USD XXX N/A as of 2022.
5. What are some drivers contributing to market growth?
N/A
6. What are the notable trends driving market growth?
N/A
7. Are there any restraints impacting market growth?
N/A
8. Can you provide examples of recent developments in the market?
N/A
9. What pricing options are available for accessing the report?
Pricing options include single-user, multi-user, and enterprise licenses priced at USD 4900.00, USD 7350.00, and USD 9800.00 respectively.
10. Is the market size provided in terms of value or volume?
The market size is provided in terms of value, measured in N/A.
11. Are there any specific market keywords associated with the report?
Yes, the market keyword associated with the report is "Canned Beans," which aids in identifying and referencing the specific market segment covered.
12. How do I determine which pricing option suits my needs best?
The pricing options vary based on user requirements and access needs. Individual users may opt for single-user licenses, while businesses requiring broader access may choose multi-user or enterprise licenses for cost-effective access to the report.
13. Are there any additional resources or data provided in the Canned Beans report?
While the report offers comprehensive insights, it's advisable to review the specific contents or supplementary materials provided to ascertain if additional resources or data are available.
14. How can I stay updated on further developments or reports in the Canned Beans?
To stay informed about further developments, trends, and reports in the Canned Beans, consider subscribing to industry newsletters, following relevant companies and organizations, or regularly checking reputable industry news sources and publications.
Methodology
Step 1 - Identification of Relevant Samples Size from Population Database


Step 2 - Approaches for Defining Global Market Size (Value, Volume* & Price*)

Note*: In applicable scenarios
Step 3 - Data Sources
Primary Research
- Web Analytics
- Survey Reports
- Research Institute
- Latest Research Reports
- Opinion Leaders
Secondary Research
- Annual Reports
- White Paper
- Latest Press Release
- Industry Association
- Paid Database
- Investor Presentations

Step 4 - Data Triangulation
Involves using different sources of information in order to increase the validity of a study
These sources are likely to be stakeholders in a program - participants, other researchers, program staff, other community members, and so on.
Then we put all data in single framework & apply various statistical tools to find out the dynamic on the market.
During the analysis stage, feedback from the stakeholder groups would be compared to determine areas of agreement as well as areas of divergence