

Key Insights
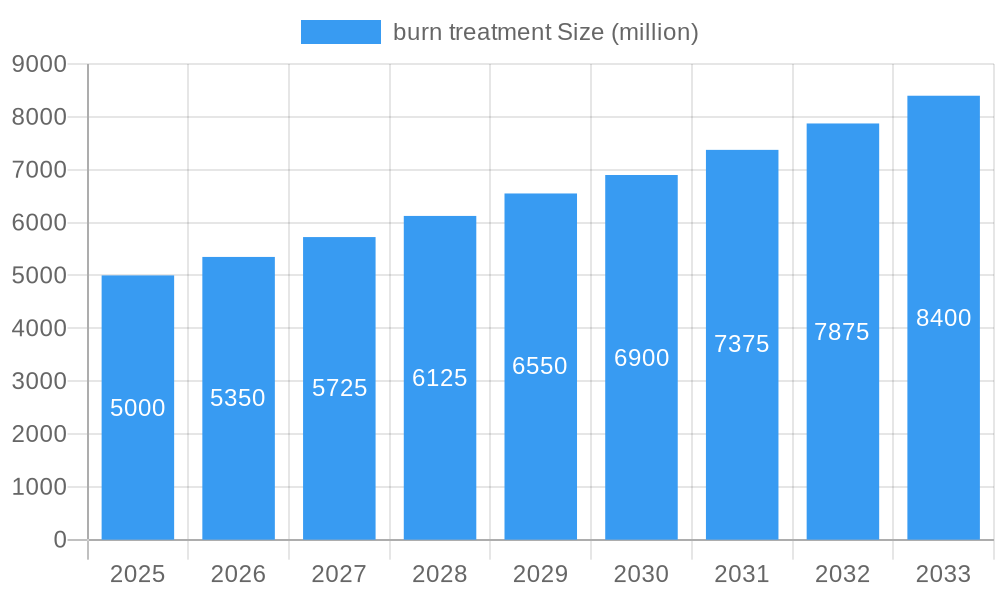
The global burn treatment market is experiencing robust growth, driven by rising incidence of burns due to accidents, increasing prevalence of chronic wounds, and advancements in treatment technologies. The market, estimated at $5 billion in 2025, is projected to exhibit a Compound Annual Growth Rate (CAGR) of approximately 7% from 2025 to 2033, reaching a value exceeding $9 billion by 2033. This growth is fueled by several key factors. Firstly, the development of innovative wound care products, including advanced bioengineered skin substitutes and antimicrobial dressings, significantly improves treatment outcomes and reduces healing time. Secondly, an aging global population, coupled with increased industrial activities and household accidents, contributes to a higher prevalence of burn injuries requiring specialized care. Thirdly, heightened awareness of burn prevention and improved access to healthcare in developing economies are also contributing factors. However, high treatment costs, especially for advanced therapies, and the complexities associated with managing severe burn injuries pose significant challenges to market expansion. Furthermore, variations in healthcare reimbursement policies across different regions influence the market dynamics.

burn treatment Market Size (In Billion)
The competitive landscape is characterized by a mix of established multinational corporations like 3M, Molnlycke Health Care, and Smith & Nephew, alongside specialized companies focused on bioengineered skin substitutes and other advanced technologies such as MEBO and Organogenesis. These companies are actively engaged in research and development, focusing on enhancing product efficacy, safety, and cost-effectiveness. Market segmentation reveals significant variations in demand across different geographical regions, with North America and Europe currently holding a dominant share, primarily due to higher healthcare expenditure and technological advancements. However, emerging economies in Asia-Pacific are witnessing rapid growth, propelled by rising healthcare infrastructure and increasing disposable incomes. This suggests a potential shift in market dynamics in the coming years, with these regions gaining significant market share. Strategic partnerships, mergers and acquisitions, and the development of new distribution channels are key strategies employed by companies to expand their market presence and cater to the growing demand.
burn treatment Company Market Share
Burn Treatment Market: A Comprehensive Report (2019-2033)
This insightful report provides a comprehensive analysis of the global burn treatment market, projecting a market value exceeding $XX million by 2033. The study covers the period from 2019 to 2033, with 2025 serving as both the base and estimated year. We delve into market composition, technological advancements, regional dominance, and future opportunities, offering invaluable insights for stakeholders across the industry.
Burn Treatment Market Composition & Trends
The global burn treatment market, valued at $XX million in 2025, is characterized by a moderately concentrated landscape. Key players such as 3M, Molnlycke Health Care, Smith & Nephew, and ConvaTec hold significant market share, while numerous smaller players contribute to the overall market dynamism. The market share distribution shows a clear concentration in the top five players, holding approximately XX% of the market in 2025. Innovation is driven by the constant need for improved wound healing solutions, particularly for severe burns. Stringent regulatory landscapes, particularly concerning biocompatibility and efficacy, shape product development. Substitute products, such as traditional wound dressings, pose competition, while the rise of regenerative medicine presents both opportunities and challenges. End-users encompass hospitals, specialized burn centers, and ambulatory care settings. M&A activity within the sector has been substantial, with over $XX million in deals recorded in the historical period (2019-2024), indicating a strong focus on consolidation and expansion.
- Market Concentration: Top 5 players hold approximately XX% of market share in 2025.
- Innovation Catalysts: Advancements in regenerative medicine and biomaterials.
- Regulatory Landscape: Stringent regulations concerning efficacy and safety.
- Substitute Products: Traditional wound dressings and alternative therapies.
- End-User Profile: Hospitals, burn centers, ambulatory care settings.
- M&A Activity: Over $XX million in deals between 2019 and 2024.
Burn Treatment Industry Evolution
The burn treatment market has witnessed significant evolution since 2019. Market growth has been driven by increasing burn incidents globally, coupled with advancements in treatment methodologies. The historical period (2019-2024) saw a Compound Annual Growth Rate (CAGR) of XX%, largely fueled by the adoption of advanced wound dressings and regenerative therapies. Technological advancements, including the development of bioengineered skin substitutes and novel antimicrobial agents, have significantly improved patient outcomes. Shifting consumer demands, prioritizing minimally invasive techniques and faster healing times, are reshaping the market landscape. The forecast period (2025-2033) projects continued growth, with a projected CAGR of XX%, driven by factors such as increasing healthcare expenditure and the rising prevalence of chronic wounds. Adoption rates of advanced therapies are projected to increase by XX% annually throughout the forecast period.
Leading Regions, Countries, or Segments in Burn Treatment
North America currently dominates the global burn treatment market, accounting for approximately XX% of the total market value in 2025. This dominance is attributable to several key factors:
- High Healthcare Expenditure: Significant investments in healthcare infrastructure and advanced medical technologies.
- Strong Regulatory Support: Supportive regulatory frameworks that facilitate the adoption of innovative therapies.
- High Prevalence of Burn Injuries: A relatively high incidence of burn injuries compared to other regions.
- Presence of Major Market Players: Concentration of major companies and research institutions within the region.
Europe follows as a significant market, while Asia-Pacific is poised for substantial growth, fueled by increasing healthcare awareness and rising disposable incomes. The presence of numerous research centers and a growing population significantly contributes to this market's potential.
Burn Treatment Product Innovations
Recent years have seen significant innovations in burn treatment products, focusing on improved biocompatibility, faster healing times, and reduced scarring. New bioengineered skin substitutes mimic natural skin functions, offering superior wound closure and minimizing the risk of infection. Advanced wound dressings incorporate antimicrobial agents and growth factors to promote healing and reduce complications. These innovations boast superior performance metrics, such as increased rates of complete wound closure and reduced hospitalization times, driving market expansion.
Propelling Factors for Burn Treatment Growth
Several factors are propelling the growth of the burn treatment market. Technological advancements in biomaterials and regenerative medicine continue to drive innovation. The increasing prevalence of burn injuries globally, fueled by industrial accidents and domestic incidents, boosts market demand. Favorable regulatory landscapes in several countries, streamlining the approval process for new products, are also conducive to growth. Finally, increased healthcare expenditure and a growing awareness of advanced burn treatment options among both healthcare providers and patients further stimulate market expansion.
Obstacles in the Burn Treatment Market
The burn treatment market faces several obstacles. Stringent regulatory requirements for new products can increase development costs and time to market, delaying the introduction of innovative solutions. Supply chain disruptions, particularly concerning specialized materials and components, can impact production and availability. Intense competition among numerous established and emerging players necessitates aggressive pricing strategies and continuous product innovation to maintain market share. The cumulative effect of these obstacles could potentially reduce market growth by approximately XX% by 2033.
Future Opportunities in Burn Treatment
Significant opportunities exist for expansion in the burn treatment market. Emerging markets in developing countries, with increasing healthcare infrastructure and growing awareness of advanced treatments, present untapped potential. The development of personalized medicine approaches, tailoring treatments to individual patient needs, is a major growth area. Furthermore, advancements in telehealth and remote monitoring technologies offer opportunities for improving post-burn care and reducing healthcare costs.
Major Players in the Burn Treatment Ecosystem
- 3M (3M)
- Molnlycke Health Care (Molnlycke Health Care)
- Smith & Nephew (Smith & Nephew)
- ConvaTec (ConvaTec)
- Paul Hartmann
- Braun
- Coloplast (Coloplast)
- Mimedx Group (Mimedx Group)
- Cardinal Health (Cardinal Health)
- Integra LifeSciences (Integra LifeSciences)
- MEBO
- Organogenesis (Organogenesis)
- Mpm Medical
- Tianjin Darentang Pharmaceutical Jingwanhong Co. Ltd
Key Developments in Burn Treatment Industry
- 2022 Q3: Smith & Nephew launched a new advanced wound dressing.
- 2023 Q1: Molnlycke Health Care announced a strategic partnership for research in regenerative medicine.
- 2024 Q2: A major merger between two smaller burn treatment companies resulted in a combined market value of $XX million. (Further details unavailable)
Strategic Burn Treatment Market Forecast
The burn treatment market is poised for robust growth in the forecast period (2025-2033), fueled by continued technological innovation, increasing healthcare spending, and the rising prevalence of burn injuries globally. The convergence of advanced materials, regenerative medicine, and personalized care will drive market expansion. This presents significant opportunities for existing players to consolidate their positions and for new entrants to carve out a niche in this dynamic and evolving sector. The market is expected to reach over $XX million by 2033.
burn treatment Segmentation
-
1. Application
- 1.1. Hospital
- 1.2. Clinic
- 1.3. Other
-
2. Types
- 2.1. Drug
- 2.2. Dressing
- 2.3. Surgery
- 2.4. Other
burn treatment Segmentation By Geography
-
1. North America
- 1.1. United States
- 1.2. Canada
- 1.3. Mexico
-
2. South America
- 2.1. Brazil
- 2.2. Argentina
- 2.3. Rest of South America
-
3. Europe
- 3.1. United Kingdom
- 3.2. Germany
- 3.3. France
- 3.4. Italy
- 3.5. Spain
- 3.6. Russia
- 3.7. Benelux
- 3.8. Nordics
- 3.9. Rest of Europe
-
4. Middle East & Africa
- 4.1. Turkey
- 4.2. Israel
- 4.3. GCC
- 4.4. North Africa
- 4.5. South Africa
- 4.6. Rest of Middle East & Africa
-
5. Asia Pacific
- 5.1. China
- 5.2. India
- 5.3. Japan
- 5.4. South Korea
- 5.5. ASEAN
- 5.6. Oceania
- 5.7. Rest of Asia Pacific

burn treatment Regional Market Share
Geographic Coverage of burn treatment
burn treatment REPORT HIGHLIGHTS
| Aspects | Details |
|---|---|
| Study Period | 2020-2034 |
| Base Year | 2025 |
| Estimated Year | 2026 |
| Forecast Period | 2026-2034 |
| Historical Period | 2020-2025 |
| Growth Rate | CAGR of XX% from 2020-2034 |
| Segmentation |
|
Table of Contents
- 1. Introduction
- 1.1. Research Scope
- 1.2. Market Segmentation
- 1.3. Research Methodology
- 1.4. Definitions and Assumptions
- 2. Executive Summary
- 2.1. Introduction
- 3. Market Dynamics
- 3.1. Introduction
- 3.2. Market Drivers
- 3.3. Market Restrains
- 3.4. Market Trends
- 4. Market Factor Analysis
- 4.1. Porters Five Forces
- 4.2. Supply/Value Chain
- 4.3. PESTEL analysis
- 4.4. Market Entropy
- 4.5. Patent/Trademark Analysis
- 5. Global burn treatment Analysis, Insights and Forecast, 2020-2032
- 5.1. Market Analysis, Insights and Forecast - by Application
- 5.1.1. Hospital
- 5.1.2. Clinic
- 5.1.3. Other
- 5.2. Market Analysis, Insights and Forecast - by Types
- 5.2.1. Drug
- 5.2.2. Dressing
- 5.2.3. Surgery
- 5.2.4. Other
- 5.3. Market Analysis, Insights and Forecast - by Region
- 5.3.1. North America
- 5.3.2. South America
- 5.3.3. Europe
- 5.3.4. Middle East & Africa
- 5.3.5. Asia Pacific
- 5.1. Market Analysis, Insights and Forecast - by Application
- 6. North America burn treatment Analysis, Insights and Forecast, 2020-2032
- 6.1. Market Analysis, Insights and Forecast - by Application
- 6.1.1. Hospital
- 6.1.2. Clinic
- 6.1.3. Other
- 6.2. Market Analysis, Insights and Forecast - by Types
- 6.2.1. Drug
- 6.2.2. Dressing
- 6.2.3. Surgery
- 6.2.4. Other
- 6.1. Market Analysis, Insights and Forecast - by Application
- 7. South America burn treatment Analysis, Insights and Forecast, 2020-2032
- 7.1. Market Analysis, Insights and Forecast - by Application
- 7.1.1. Hospital
- 7.1.2. Clinic
- 7.1.3. Other
- 7.2. Market Analysis, Insights and Forecast - by Types
- 7.2.1. Drug
- 7.2.2. Dressing
- 7.2.3. Surgery
- 7.2.4. Other
- 7.1. Market Analysis, Insights and Forecast - by Application
- 8. Europe burn treatment Analysis, Insights and Forecast, 2020-2032
- 8.1. Market Analysis, Insights and Forecast - by Application
- 8.1.1. Hospital
- 8.1.2. Clinic
- 8.1.3. Other
- 8.2. Market Analysis, Insights and Forecast - by Types
- 8.2.1. Drug
- 8.2.2. Dressing
- 8.2.3. Surgery
- 8.2.4. Other
- 8.1. Market Analysis, Insights and Forecast - by Application
- 9. Middle East & Africa burn treatment Analysis, Insights and Forecast, 2020-2032
- 9.1. Market Analysis, Insights and Forecast - by Application
- 9.1.1. Hospital
- 9.1.2. Clinic
- 9.1.3. Other
- 9.2. Market Analysis, Insights and Forecast - by Types
- 9.2.1. Drug
- 9.2.2. Dressing
- 9.2.3. Surgery
- 9.2.4. Other
- 9.1. Market Analysis, Insights and Forecast - by Application
- 10. Asia Pacific burn treatment Analysis, Insights and Forecast, 2020-2032
- 10.1. Market Analysis, Insights and Forecast - by Application
- 10.1.1. Hospital
- 10.1.2. Clinic
- 10.1.3. Other
- 10.2. Market Analysis, Insights and Forecast - by Types
- 10.2.1. Drug
- 10.2.2. Dressing
- 10.2.3. Surgery
- 10.2.4. Other
- 10.1. Market Analysis, Insights and Forecast - by Application
- 11. Competitive Analysis
- 11.1. Global Market Share Analysis 2025
- 11.2. Company Profiles
- 11.2.1 3M
- 11.2.1.1. Overview
- 11.2.1.2. Products
- 11.2.1.3. SWOT Analysis
- 11.2.1.4. Recent Developments
- 11.2.1.5. Financials (Based on Availability)
- 11.2.2 Molnlycke Health Care
- 11.2.2.1. Overview
- 11.2.2.2. Products
- 11.2.2.3. SWOT Analysis
- 11.2.2.4. Recent Developments
- 11.2.2.5. Financials (Based on Availability)
- 11.2.3 Smith & Nephew
- 11.2.3.1. Overview
- 11.2.3.2. Products
- 11.2.3.3. SWOT Analysis
- 11.2.3.4. Recent Developments
- 11.2.3.5. Financials (Based on Availability)
- 11.2.4 ConvaTec
- 11.2.4.1. Overview
- 11.2.4.2. Products
- 11.2.4.3. SWOT Analysis
- 11.2.4.4. Recent Developments
- 11.2.4.5. Financials (Based on Availability)
- 11.2.5 Paul Hartmann
- 11.2.5.1. Overview
- 11.2.5.2. Products
- 11.2.5.3. SWOT Analysis
- 11.2.5.4. Recent Developments
- 11.2.5.5. Financials (Based on Availability)
- 11.2.6 Braun
- 11.2.6.1. Overview
- 11.2.6.2. Products
- 11.2.6.3. SWOT Analysis
- 11.2.6.4. Recent Developments
- 11.2.6.5. Financials (Based on Availability)
- 11.2.7 Coloplast
- 11.2.7.1. Overview
- 11.2.7.2. Products
- 11.2.7.3. SWOT Analysis
- 11.2.7.4. Recent Developments
- 11.2.7.5. Financials (Based on Availability)
- 11.2.8 Mimedx Group
- 11.2.8.1. Overview
- 11.2.8.2. Products
- 11.2.8.3. SWOT Analysis
- 11.2.8.4. Recent Developments
- 11.2.8.5. Financials (Based on Availability)
- 11.2.9 Cardinal Health
- 11.2.9.1. Overview
- 11.2.9.2. Products
- 11.2.9.3. SWOT Analysis
- 11.2.9.4. Recent Developments
- 11.2.9.5. Financials (Based on Availability)
- 11.2.10 Integra LifeSciences
- 11.2.10.1. Overview
- 11.2.10.2. Products
- 11.2.10.3. SWOT Analysis
- 11.2.10.4. Recent Developments
- 11.2.10.5. Financials (Based on Availability)
- 11.2.11 MEBO
- 11.2.11.1. Overview
- 11.2.11.2. Products
- 11.2.11.3. SWOT Analysis
- 11.2.11.4. Recent Developments
- 11.2.11.5. Financials (Based on Availability)
- 11.2.12 Organogenesis
- 11.2.12.1. Overview
- 11.2.12.2. Products
- 11.2.12.3. SWOT Analysis
- 11.2.12.4. Recent Developments
- 11.2.12.5. Financials (Based on Availability)
- 11.2.13 Mpm Medical
- 11.2.13.1. Overview
- 11.2.13.2. Products
- 11.2.13.3. SWOT Analysis
- 11.2.13.4. Recent Developments
- 11.2.13.5. Financials (Based on Availability)
- 11.2.14 Tianjin Darentang Pharmaceutical Jingwanhong Co. Ltd
- 11.2.14.1. Overview
- 11.2.14.2. Products
- 11.2.14.3. SWOT Analysis
- 11.2.14.4. Recent Developments
- 11.2.14.5. Financials (Based on Availability)
- 11.2.1 3M
List of Figures
- Figure 1: Global burn treatment Revenue Breakdown (million, %) by Region 2025 & 2033
- Figure 2: North America burn treatment Revenue (million), by Application 2025 & 2033
- Figure 3: North America burn treatment Revenue Share (%), by Application 2025 & 2033
- Figure 4: North America burn treatment Revenue (million), by Types 2025 & 2033
- Figure 5: North America burn treatment Revenue Share (%), by Types 2025 & 2033
- Figure 6: North America burn treatment Revenue (million), by Country 2025 & 2033
- Figure 7: North America burn treatment Revenue Share (%), by Country 2025 & 2033
- Figure 8: South America burn treatment Revenue (million), by Application 2025 & 2033
- Figure 9: South America burn treatment Revenue Share (%), by Application 2025 & 2033
- Figure 10: South America burn treatment Revenue (million), by Types 2025 & 2033
- Figure 11: South America burn treatment Revenue Share (%), by Types 2025 & 2033
- Figure 12: South America burn treatment Revenue (million), by Country 2025 & 2033
- Figure 13: South America burn treatment Revenue Share (%), by Country 2025 & 2033
- Figure 14: Europe burn treatment Revenue (million), by Application 2025 & 2033
- Figure 15: Europe burn treatment Revenue Share (%), by Application 2025 & 2033
- Figure 16: Europe burn treatment Revenue (million), by Types 2025 & 2033
- Figure 17: Europe burn treatment Revenue Share (%), by Types 2025 & 2033
- Figure 18: Europe burn treatment Revenue (million), by Country 2025 & 2033
- Figure 19: Europe burn treatment Revenue Share (%), by Country 2025 & 2033
- Figure 20: Middle East & Africa burn treatment Revenue (million), by Application 2025 & 2033
- Figure 21: Middle East & Africa burn treatment Revenue Share (%), by Application 2025 & 2033
- Figure 22: Middle East & Africa burn treatment Revenue (million), by Types 2025 & 2033
- Figure 23: Middle East & Africa burn treatment Revenue Share (%), by Types 2025 & 2033
- Figure 24: Middle East & Africa burn treatment Revenue (million), by Country 2025 & 2033
- Figure 25: Middle East & Africa burn treatment Revenue Share (%), by Country 2025 & 2033
- Figure 26: Asia Pacific burn treatment Revenue (million), by Application 2025 & 2033
- Figure 27: Asia Pacific burn treatment Revenue Share (%), by Application 2025 & 2033
- Figure 28: Asia Pacific burn treatment Revenue (million), by Types 2025 & 2033
- Figure 29: Asia Pacific burn treatment Revenue Share (%), by Types 2025 & 2033
- Figure 30: Asia Pacific burn treatment Revenue (million), by Country 2025 & 2033
- Figure 31: Asia Pacific burn treatment Revenue Share (%), by Country 2025 & 2033
List of Tables
- Table 1: Global burn treatment Revenue million Forecast, by Application 2020 & 2033
- Table 2: Global burn treatment Revenue million Forecast, by Types 2020 & 2033
- Table 3: Global burn treatment Revenue million Forecast, by Region 2020 & 2033
- Table 4: Global burn treatment Revenue million Forecast, by Application 2020 & 2033
- Table 5: Global burn treatment Revenue million Forecast, by Types 2020 & 2033
- Table 6: Global burn treatment Revenue million Forecast, by Country 2020 & 2033
- Table 7: United States burn treatment Revenue (million) Forecast, by Application 2020 & 2033
- Table 8: Canada burn treatment Revenue (million) Forecast, by Application 2020 & 2033
- Table 9: Mexico burn treatment Revenue (million) Forecast, by Application 2020 & 2033
- Table 10: Global burn treatment Revenue million Forecast, by Application 2020 & 2033
- Table 11: Global burn treatment Revenue million Forecast, by Types 2020 & 2033
- Table 12: Global burn treatment Revenue million Forecast, by Country 2020 & 2033
- Table 13: Brazil burn treatment Revenue (million) Forecast, by Application 2020 & 2033
- Table 14: Argentina burn treatment Revenue (million) Forecast, by Application 2020 & 2033
- Table 15: Rest of South America burn treatment Revenue (million) Forecast, by Application 2020 & 2033
- Table 16: Global burn treatment Revenue million Forecast, by Application 2020 & 2033
- Table 17: Global burn treatment Revenue million Forecast, by Types 2020 & 2033
- Table 18: Global burn treatment Revenue million Forecast, by Country 2020 & 2033
- Table 19: United Kingdom burn treatment Revenue (million) Forecast, by Application 2020 & 2033
- Table 20: Germany burn treatment Revenue (million) Forecast, by Application 2020 & 2033
- Table 21: France burn treatment Revenue (million) Forecast, by Application 2020 & 2033
- Table 22: Italy burn treatment Revenue (million) Forecast, by Application 2020 & 2033
- Table 23: Spain burn treatment Revenue (million) Forecast, by Application 2020 & 2033
- Table 24: Russia burn treatment Revenue (million) Forecast, by Application 2020 & 2033
- Table 25: Benelux burn treatment Revenue (million) Forecast, by Application 2020 & 2033
- Table 26: Nordics burn treatment Revenue (million) Forecast, by Application 2020 & 2033
- Table 27: Rest of Europe burn treatment Revenue (million) Forecast, by Application 2020 & 2033
- Table 28: Global burn treatment Revenue million Forecast, by Application 2020 & 2033
- Table 29: Global burn treatment Revenue million Forecast, by Types 2020 & 2033
- Table 30: Global burn treatment Revenue million Forecast, by Country 2020 & 2033
- Table 31: Turkey burn treatment Revenue (million) Forecast, by Application 2020 & 2033
- Table 32: Israel burn treatment Revenue (million) Forecast, by Application 2020 & 2033
- Table 33: GCC burn treatment Revenue (million) Forecast, by Application 2020 & 2033
- Table 34: North Africa burn treatment Revenue (million) Forecast, by Application 2020 & 2033
- Table 35: South Africa burn treatment Revenue (million) Forecast, by Application 2020 & 2033
- Table 36: Rest of Middle East & Africa burn treatment Revenue (million) Forecast, by Application 2020 & 2033
- Table 37: Global burn treatment Revenue million Forecast, by Application 2020 & 2033
- Table 38: Global burn treatment Revenue million Forecast, by Types 2020 & 2033
- Table 39: Global burn treatment Revenue million Forecast, by Country 2020 & 2033
- Table 40: China burn treatment Revenue (million) Forecast, by Application 2020 & 2033
- Table 41: India burn treatment Revenue (million) Forecast, by Application 2020 & 2033
- Table 42: Japan burn treatment Revenue (million) Forecast, by Application 2020 & 2033
- Table 43: South Korea burn treatment Revenue (million) Forecast, by Application 2020 & 2033
- Table 44: ASEAN burn treatment Revenue (million) Forecast, by Application 2020 & 2033
- Table 45: Oceania burn treatment Revenue (million) Forecast, by Application 2020 & 2033
- Table 46: Rest of Asia Pacific burn treatment Revenue (million) Forecast, by Application 2020 & 2033
Frequently Asked Questions
1. What is the projected Compound Annual Growth Rate (CAGR) of the burn treatment?
The projected CAGR is approximately XX%.
2. Which companies are prominent players in the burn treatment?
Key companies in the market include 3M, Molnlycke Health Care, Smith & Nephew, ConvaTec, Paul Hartmann, Braun, Coloplast, Mimedx Group, Cardinal Health, Integra LifeSciences, MEBO, Organogenesis, Mpm Medical, Tianjin Darentang Pharmaceutical Jingwanhong Co. Ltd.
3. What are the main segments of the burn treatment?
The market segments include Application, Types.
4. Can you provide details about the market size?
The market size is estimated to be USD XXX million as of 2022.
5. What are some drivers contributing to market growth?
N/A
6. What are the notable trends driving market growth?
N/A
7. Are there any restraints impacting market growth?
N/A
8. Can you provide examples of recent developments in the market?
N/A
9. What pricing options are available for accessing the report?
Pricing options include single-user, multi-user, and enterprise licenses priced at USD 4350.00, USD 6525.00, and USD 8700.00 respectively.
10. Is the market size provided in terms of value or volume?
The market size is provided in terms of value, measured in million.
11. Are there any specific market keywords associated with the report?
Yes, the market keyword associated with the report is "burn treatment," which aids in identifying and referencing the specific market segment covered.
12. How do I determine which pricing option suits my needs best?
The pricing options vary based on user requirements and access needs. Individual users may opt for single-user licenses, while businesses requiring broader access may choose multi-user or enterprise licenses for cost-effective access to the report.
13. Are there any additional resources or data provided in the burn treatment report?
While the report offers comprehensive insights, it's advisable to review the specific contents or supplementary materials provided to ascertain if additional resources or data are available.
14. How can I stay updated on further developments or reports in the burn treatment?
To stay informed about further developments, trends, and reports in the burn treatment, consider subscribing to industry newsletters, following relevant companies and organizations, or regularly checking reputable industry news sources and publications.
Methodology
Step 1 - Identification of Relevant Samples Size from Population Database


Step 2 - Approaches for Defining Global Market Size (Value, Volume* & Price*)

Note*: In applicable scenarios
Step 3 - Data Sources
Primary Research
- Web Analytics
- Survey Reports
- Research Institute
- Latest Research Reports
- Opinion Leaders
Secondary Research
- Annual Reports
- White Paper
- Latest Press Release
- Industry Association
- Paid Database
- Investor Presentations

Step 4 - Data Triangulation
Involves using different sources of information in order to increase the validity of a study
These sources are likely to be stakeholders in a program - participants, other researchers, program staff, other community members, and so on.
Then we put all data in single framework & apply various statistical tools to find out the dynamic on the market.
During the analysis stage, feedback from the stakeholder groups would be compared to determine areas of agreement as well as areas of divergence