

Key Insights
The Bluetooth Temperature Data Logger market is experiencing robust growth, driven by the increasing demand for real-time temperature monitoring across various sectors. The convergence of IoT technologies with sophisticated data logging capabilities has fueled this expansion. Applications span diverse industries, including pharmaceuticals (cold chain logistics), food and beverage (quality control and safety), healthcare (patient monitoring and vaccine storage), and environmental monitoring (climate change research and industrial processes). The market's expansion is further propelled by the decreasing cost of Bluetooth technology, enhanced battery life in data loggers, and the growing adoption of cloud-based data management systems that allow for remote monitoring and analysis. This facilitates proactive decision-making, improves operational efficiency, and enhances compliance with stringent regulatory requirements in sectors like healthcare and pharmaceuticals. Competitive landscape analysis reveals a mix of established players and emerging companies, leading to continuous innovation in data logger functionalities, including features such as GPS tracking, alarm systems, and data visualization tools.

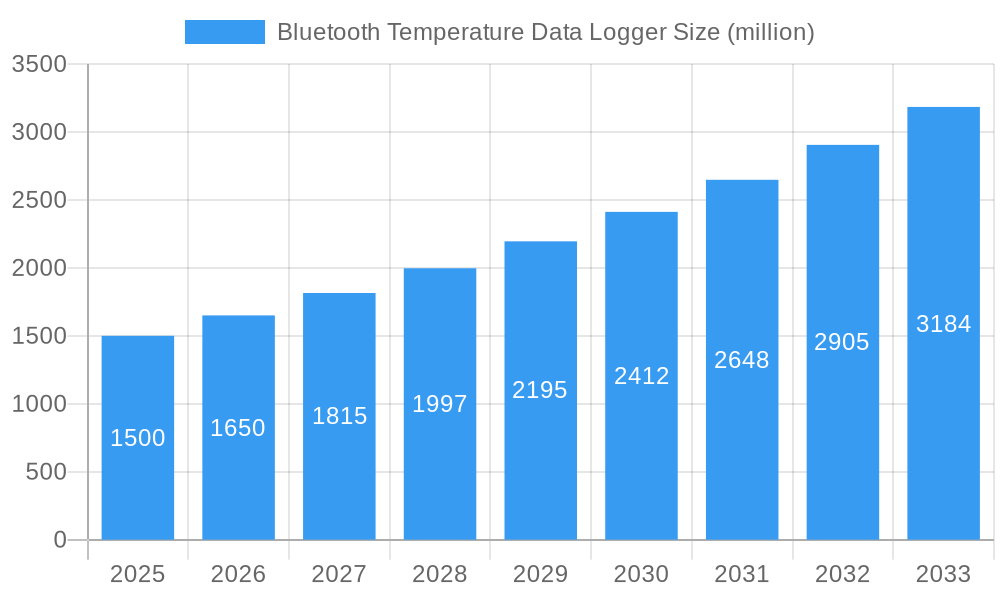
Bluetooth Temperature Data Logger Market Size (In Billion)
Despite significant growth, the market faces challenges. One key restraint is the potential for data security vulnerabilities associated with wireless communication. Concerns around data integrity and the need for robust cybersecurity measures are influencing market adoption. Another factor impacting growth is the heterogeneity of Bluetooth protocols and the need for interoperability standards to ensure seamless data integration across different systems. However, ongoing advancements in security protocols and the development of standardized communication protocols are addressing these concerns, paving the way for further market expansion. Future growth will likely be influenced by advancements in sensor technology, integration with AI-powered analytics, and the development of more user-friendly data visualization platforms. Market players are expected to focus on value-added services such as data analytics and predictive maintenance to maintain their competitive edge.
Bluetooth Temperature Data Logger Company Market Share
Bluetooth Temperature Data Logger Market Report: 2019-2033 - A Comprehensive Analysis of a Multi-Million Dollar Industry
This insightful report provides a comprehensive analysis of the Bluetooth Temperature Data Logger market, projecting a multi-million dollar valuation by 2033. The study covers the period from 2019 to 2033, with a base year of 2025 and a forecast period from 2025 to 2033. We analyze market composition, technological advancements, leading players, and future growth opportunities, offering invaluable insights for stakeholders across the industry. This report is ready for immediate use; no further modifications are required.
Bluetooth Temperature Data Logger Market Composition & Trends
The global Bluetooth Temperature Data Logger market, valued at $XX million in 2024, is characterized by a moderately concentrated landscape. Key players, including AZ Instrument Corp, DicksonData, NOVUS Automation Inc., Elitech, and others, compete based on product features, pricing, and technological innovation. The market share distribution amongst these leading companies is approximately XX% for the top three, with the remainder divided amongst numerous smaller players. Market consolidation through mergers and acquisitions (M&A) is expected to increase over the forecast period, with deal values ranging from $XX million to $XX million observed in recent years.
- Market Concentration: Moderately concentrated, with top 5 players holding approximately XX% market share.
- Innovation Catalysts: Miniaturization, enhanced connectivity, and improved data analysis capabilities.
- Regulatory Landscape: Compliance with industry-specific regulations (e.g., FDA, ISO) is crucial.
- Substitute Products: Wired data loggers and traditional thermometers present some level of competition.
- End-User Profiles: Food & beverage, pharmaceutical, logistics, healthcare and research sectors are key end users.
- M&A Activities: Significant M&A activity observed, with deal values reaching $XX million in recent transactions.
Bluetooth Temperature Data Logger Industry Evolution
The Bluetooth Temperature Data Logger market has witnessed significant growth driven by technological advancements and increasing demand for real-time temperature monitoring across various industries. Between 2019 and 2024, the market experienced a Compound Annual Growth Rate (CAGR) of XX%. The adoption of Bluetooth technology has simplified data collection and transmission, reducing reliance on wired systems and facilitating remote monitoring. This, coupled with the rising need for improved supply chain visibility and enhanced product quality control, has fueled market expansion. We project a CAGR of XX% from 2025 to 2033, reaching a market value of $XX million by 2033, driven by increasing adoption in emerging markets and continued technological innovation.
Leading Regions, Countries, or Segments in Bluetooth Temperature Data Logger
North America currently holds the dominant position in the Bluetooth Temperature Data Logger market, accounting for approximately XX% of global revenue in 2024. This dominance is attributable to several factors:
- Key Drivers in North America:
- High technological adoption rates.
- Stringent regulatory requirements for temperature-sensitive products.
- Significant investments in research and development.
- Strong presence of major market players.
The strong presence of key market players, coupled with advanced technological infrastructure and substantial R&D investments, solidify North America's leadership. However, other regions, notably Europe and Asia-Pacific, are expected to witness significant growth during the forecast period fueled by rising industrialization and increasing awareness of the benefits of real-time temperature monitoring.
Bluetooth Temperature Data Logger Product Innovations
Recent innovations focus on improved accuracy, extended battery life, enhanced data security, and seamless integration with cloud-based platforms. New products feature advanced sensors, enabling more precise temperature readings and improved data analysis capabilities. The incorporation of features such as real-time alerts and customizable reporting enhances user experience and operational efficiency. This leads to unique selling propositions like faster data retrieval, reduced operational costs, and enhanced supply chain visibility.
Propelling Factors for Bluetooth Temperature Data Logger Growth
Several key factors drive the growth of the Bluetooth Temperature Data Logger market. Technological advancements, including miniaturization and improved battery technology, are making these devices more accessible and user-friendly. Increasing demand for real-time data and remote monitoring across industries like pharmaceuticals and food & beverage further fuels market expansion. Additionally, supportive government regulations promoting efficient supply chain management and data security contribute to market growth.
Obstacles in the Bluetooth Temperature Data Logger Market
Despite its growth potential, the Bluetooth Temperature Data Logger market faces several challenges. The initial investment cost for businesses can be significant, representing a barrier to entry for some smaller players. Supply chain disruptions, particularly concerning semiconductor components, can impact production and availability. Intense competition among established players also presents a considerable challenge. These factors cumulatively impact market growth, estimated at around X% during periods of significant supply chain disruption.
Future Opportunities in Bluetooth Temperature Data Logger
Emerging opportunities lie in the integration of Bluetooth Temperature Data Loggers with IoT platforms for enhanced data analytics and predictive maintenance. Expansion into new markets, especially in developing economies with burgeoning industries, presents significant potential. The development of more energy-efficient devices and improved data security features will further drive market growth.
Major Players in the Bluetooth Temperature Data Logger Ecosystem
- AZ Instrument Corp
- DicksonData
- NOVUS Automation Inc.
- Elitech
- Data Logger Products
- TempSen
- Traceable Products
- Hangzhou Zeda Instruments
- Tzone Digital Technology Co
- MSR-Electronic GmbH
- Synotronics
- Onset
- Lascar Electronics
- DeltaTrak Inc.
- OCEASOFT
- Wagner Meters
- Data Harvest
- Smashtag
- Tecnosoft
- METER Group
- Labfacility Limited
Key Developments in Bluetooth Temperature Data Logger Industry
- 2022 Q4: Elitech launched a new generation of Bluetooth Temperature Data Loggers with enhanced battery life.
- 2023 Q1: A merger between two smaller players resulted in a more significant competitor.
- 2023 Q3: New regulations in Europe impacted the design requirements for some Bluetooth Temperature Data Loggers.
Strategic Bluetooth Temperature Data Logger Market Forecast
The Bluetooth Temperature Data Logger market is poised for sustained growth over the next decade, driven by technological advancements, increasing demand for real-time monitoring, and expansion into new applications. The market’s projected value of $XX million by 2033 signifies substantial growth opportunities for existing players and new entrants alike. Continued innovation and strategic partnerships will be crucial for success in this dynamic market.
Bluetooth Temperature Data Logger Segmentation
-
1. Application
- 1.1. Life Sciences
- 1.2. Healthcare
- 1.3. Food and Beverage
- 1.4. Cold Chain logistics
- 1.5. Industrial
- 1.6. Others
-
2. Types
- 2.1. Wired
- 2.2. Wireless
Bluetooth Temperature Data Logger Segmentation By Geography
-
1. North America
- 1.1. United States
- 1.2. Canada
- 1.3. Mexico
-
2. South America
- 2.1. Brazil
- 2.2. Argentina
- 2.3. Rest of South America
-
3. Europe
- 3.1. United Kingdom
- 3.2. Germany
- 3.3. France
- 3.4. Italy
- 3.5. Spain
- 3.6. Russia
- 3.7. Benelux
- 3.8. Nordics
- 3.9. Rest of Europe
-
4. Middle East & Africa
- 4.1. Turkey
- 4.2. Israel
- 4.3. GCC
- 4.4. North Africa
- 4.5. South Africa
- 4.6. Rest of Middle East & Africa
-
5. Asia Pacific
- 5.1. China
- 5.2. India
- 5.3. Japan
- 5.4. South Korea
- 5.5. ASEAN
- 5.6. Oceania
- 5.7. Rest of Asia Pacific

Bluetooth Temperature Data Logger Regional Market Share
Geographic Coverage of Bluetooth Temperature Data Logger
Bluetooth Temperature Data Logger REPORT HIGHLIGHTS
| Aspects | Details |
|---|---|
| Study Period | 2020-2034 |
| Base Year | 2025 |
| Estimated Year | 2026 |
| Forecast Period | 2026-2034 |
| Historical Period | 2020-2025 |
| Growth Rate | CAGR of 12.78% from 2020-2034 |
| Segmentation |
|
Table of Contents
- 1. Introduction
- 1.1. Research Scope
- 1.2. Market Segmentation
- 1.3. Research Methodology
- 1.4. Definitions and Assumptions
- 2. Executive Summary
- 2.1. Introduction
- 3. Market Dynamics
- 3.1. Introduction
- 3.2. Market Drivers
- 3.3. Market Restrains
- 3.4. Market Trends
- 4. Market Factor Analysis
- 4.1. Porters Five Forces
- 4.2. Supply/Value Chain
- 4.3. PESTEL analysis
- 4.4. Market Entropy
- 4.5. Patent/Trademark Analysis
- 5. Global Bluetooth Temperature Data Logger Analysis, Insights and Forecast, 2020-2032
- 5.1. Market Analysis, Insights and Forecast - by Application
- 5.1.1. Life Sciences
- 5.1.2. Healthcare
- 5.1.3. Food and Beverage
- 5.1.4. Cold Chain logistics
- 5.1.5. Industrial
- 5.1.6. Others
- 5.2. Market Analysis, Insights and Forecast - by Types
- 5.2.1. Wired
- 5.2.2. Wireless
- 5.3. Market Analysis, Insights and Forecast - by Region
- 5.3.1. North America
- 5.3.2. South America
- 5.3.3. Europe
- 5.3.4. Middle East & Africa
- 5.3.5. Asia Pacific
- 5.1. Market Analysis, Insights and Forecast - by Application
- 6. North America Bluetooth Temperature Data Logger Analysis, Insights and Forecast, 2020-2032
- 6.1. Market Analysis, Insights and Forecast - by Application
- 6.1.1. Life Sciences
- 6.1.2. Healthcare
- 6.1.3. Food and Beverage
- 6.1.4. Cold Chain logistics
- 6.1.5. Industrial
- 6.1.6. Others
- 6.2. Market Analysis, Insights and Forecast - by Types
- 6.2.1. Wired
- 6.2.2. Wireless
- 6.1. Market Analysis, Insights and Forecast - by Application
- 7. South America Bluetooth Temperature Data Logger Analysis, Insights and Forecast, 2020-2032
- 7.1. Market Analysis, Insights and Forecast - by Application
- 7.1.1. Life Sciences
- 7.1.2. Healthcare
- 7.1.3. Food and Beverage
- 7.1.4. Cold Chain logistics
- 7.1.5. Industrial
- 7.1.6. Others
- 7.2. Market Analysis, Insights and Forecast - by Types
- 7.2.1. Wired
- 7.2.2. Wireless
- 7.1. Market Analysis, Insights and Forecast - by Application
- 8. Europe Bluetooth Temperature Data Logger Analysis, Insights and Forecast, 2020-2032
- 8.1. Market Analysis, Insights and Forecast - by Application
- 8.1.1. Life Sciences
- 8.1.2. Healthcare
- 8.1.3. Food and Beverage
- 8.1.4. Cold Chain logistics
- 8.1.5. Industrial
- 8.1.6. Others
- 8.2. Market Analysis, Insights and Forecast - by Types
- 8.2.1. Wired
- 8.2.2. Wireless
- 8.1. Market Analysis, Insights and Forecast - by Application
- 9. Middle East & Africa Bluetooth Temperature Data Logger Analysis, Insights and Forecast, 2020-2032
- 9.1. Market Analysis, Insights and Forecast - by Application
- 9.1.1. Life Sciences
- 9.1.2. Healthcare
- 9.1.3. Food and Beverage
- 9.1.4. Cold Chain logistics
- 9.1.5. Industrial
- 9.1.6. Others
- 9.2. Market Analysis, Insights and Forecast - by Types
- 9.2.1. Wired
- 9.2.2. Wireless
- 9.1. Market Analysis, Insights and Forecast - by Application
- 10. Asia Pacific Bluetooth Temperature Data Logger Analysis, Insights and Forecast, 2020-2032
- 10.1. Market Analysis, Insights and Forecast - by Application
- 10.1.1. Life Sciences
- 10.1.2. Healthcare
- 10.1.3. Food and Beverage
- 10.1.4. Cold Chain logistics
- 10.1.5. Industrial
- 10.1.6. Others
- 10.2. Market Analysis, Insights and Forecast - by Types
- 10.2.1. Wired
- 10.2.2. Wireless
- 10.1. Market Analysis, Insights and Forecast - by Application
- 11. Competitive Analysis
- 11.1. Global Market Share Analysis 2025
- 11.2. Company Profiles
- 11.2.1 AZ Instrument Corp
- 11.2.1.1. Overview
- 11.2.1.2. Products
- 11.2.1.3. SWOT Analysis
- 11.2.1.4. Recent Developments
- 11.2.1.5. Financials (Based on Availability)
- 11.2.2 DicksonData
- 11.2.2.1. Overview
- 11.2.2.2. Products
- 11.2.2.3. SWOT Analysis
- 11.2.2.4. Recent Developments
- 11.2.2.5. Financials (Based on Availability)
- 11.2.3 NOVUS Automation Inc.
- 11.2.3.1. Overview
- 11.2.3.2. Products
- 11.2.3.3. SWOT Analysis
- 11.2.3.4. Recent Developments
- 11.2.3.5. Financials (Based on Availability)
- 11.2.4 Elitech
- 11.2.4.1. Overview
- 11.2.4.2. Products
- 11.2.4.3. SWOT Analysis
- 11.2.4.4. Recent Developments
- 11.2.4.5. Financials (Based on Availability)
- 11.2.5 Data Logger Products
- 11.2.5.1. Overview
- 11.2.5.2. Products
- 11.2.5.3. SWOT Analysis
- 11.2.5.4. Recent Developments
- 11.2.5.5. Financials (Based on Availability)
- 11.2.6 TempSen
- 11.2.6.1. Overview
- 11.2.6.2. Products
- 11.2.6.3. SWOT Analysis
- 11.2.6.4. Recent Developments
- 11.2.6.5. Financials (Based on Availability)
- 11.2.7 Traceable Products
- 11.2.7.1. Overview
- 11.2.7.2. Products
- 11.2.7.3. SWOT Analysis
- 11.2.7.4. Recent Developments
- 11.2.7.5. Financials (Based on Availability)
- 11.2.8 Hangzhou Zeda Instruments
- 11.2.8.1. Overview
- 11.2.8.2. Products
- 11.2.8.3. SWOT Analysis
- 11.2.8.4. Recent Developments
- 11.2.8.5. Financials (Based on Availability)
- 11.2.9 Tzone Digital Technology Co
- 11.2.9.1. Overview
- 11.2.9.2. Products
- 11.2.9.3. SWOT Analysis
- 11.2.9.4. Recent Developments
- 11.2.9.5. Financials (Based on Availability)
- 11.2.10 MSR-Electronic GmbH
- 11.2.10.1. Overview
- 11.2.10.2. Products
- 11.2.10.3. SWOT Analysis
- 11.2.10.4. Recent Developments
- 11.2.10.5. Financials (Based on Availability)
- 11.2.11 Synotronics
- 11.2.11.1. Overview
- 11.2.11.2. Products
- 11.2.11.3. SWOT Analysis
- 11.2.11.4. Recent Developments
- 11.2.11.5. Financials (Based on Availability)
- 11.2.12 Onset
- 11.2.12.1. Overview
- 11.2.12.2. Products
- 11.2.12.3. SWOT Analysis
- 11.2.12.4. Recent Developments
- 11.2.12.5. Financials (Based on Availability)
- 11.2.13 Lascar Electronics
- 11.2.13.1. Overview
- 11.2.13.2. Products
- 11.2.13.3. SWOT Analysis
- 11.2.13.4. Recent Developments
- 11.2.13.5. Financials (Based on Availability)
- 11.2.14 DeltaTrak Inc.
- 11.2.14.1. Overview
- 11.2.14.2. Products
- 11.2.14.3. SWOT Analysis
- 11.2.14.4. Recent Developments
- 11.2.14.5. Financials (Based on Availability)
- 11.2.15 OCEASOFT
- 11.2.15.1. Overview
- 11.2.15.2. Products
- 11.2.15.3. SWOT Analysis
- 11.2.15.4. Recent Developments
- 11.2.15.5. Financials (Based on Availability)
- 11.2.16 Wagner Meters
- 11.2.16.1. Overview
- 11.2.16.2. Products
- 11.2.16.3. SWOT Analysis
- 11.2.16.4. Recent Developments
- 11.2.16.5. Financials (Based on Availability)
- 11.2.17 Data Harvest
- 11.2.17.1. Overview
- 11.2.17.2. Products
- 11.2.17.3. SWOT Analysis
- 11.2.17.4. Recent Developments
- 11.2.17.5. Financials (Based on Availability)
- 11.2.18 Smashtag
- 11.2.18.1. Overview
- 11.2.18.2. Products
- 11.2.18.3. SWOT Analysis
- 11.2.18.4. Recent Developments
- 11.2.18.5. Financials (Based on Availability)
- 11.2.19 Tecnosoft
- 11.2.19.1. Overview
- 11.2.19.2. Products
- 11.2.19.3. SWOT Analysis
- 11.2.19.4. Recent Developments
- 11.2.19.5. Financials (Based on Availability)
- 11.2.20 METER Group
- 11.2.20.1. Overview
- 11.2.20.2. Products
- 11.2.20.3. SWOT Analysis
- 11.2.20.4. Recent Developments
- 11.2.20.5. Financials (Based on Availability)
- 11.2.21 Labfacility Limited
- 11.2.21.1. Overview
- 11.2.21.2. Products
- 11.2.21.3. SWOT Analysis
- 11.2.21.4. Recent Developments
- 11.2.21.5. Financials (Based on Availability)
- 11.2.1 AZ Instrument Corp
List of Figures
- Figure 1: Global Bluetooth Temperature Data Logger Revenue Breakdown (undefined, %) by Region 2025 & 2033
- Figure 2: Global Bluetooth Temperature Data Logger Volume Breakdown (K, %) by Region 2025 & 2033
- Figure 3: North America Bluetooth Temperature Data Logger Revenue (undefined), by Application 2025 & 2033
- Figure 4: North America Bluetooth Temperature Data Logger Volume (K), by Application 2025 & 2033
- Figure 5: North America Bluetooth Temperature Data Logger Revenue Share (%), by Application 2025 & 2033
- Figure 6: North America Bluetooth Temperature Data Logger Volume Share (%), by Application 2025 & 2033
- Figure 7: North America Bluetooth Temperature Data Logger Revenue (undefined), by Types 2025 & 2033
- Figure 8: North America Bluetooth Temperature Data Logger Volume (K), by Types 2025 & 2033
- Figure 9: North America Bluetooth Temperature Data Logger Revenue Share (%), by Types 2025 & 2033
- Figure 10: North America Bluetooth Temperature Data Logger Volume Share (%), by Types 2025 & 2033
- Figure 11: North America Bluetooth Temperature Data Logger Revenue (undefined), by Country 2025 & 2033
- Figure 12: North America Bluetooth Temperature Data Logger Volume (K), by Country 2025 & 2033
- Figure 13: North America Bluetooth Temperature Data Logger Revenue Share (%), by Country 2025 & 2033
- Figure 14: North America Bluetooth Temperature Data Logger Volume Share (%), by Country 2025 & 2033
- Figure 15: South America Bluetooth Temperature Data Logger Revenue (undefined), by Application 2025 & 2033
- Figure 16: South America Bluetooth Temperature Data Logger Volume (K), by Application 2025 & 2033
- Figure 17: South America Bluetooth Temperature Data Logger Revenue Share (%), by Application 2025 & 2033
- Figure 18: South America Bluetooth Temperature Data Logger Volume Share (%), by Application 2025 & 2033
- Figure 19: South America Bluetooth Temperature Data Logger Revenue (undefined), by Types 2025 & 2033
- Figure 20: South America Bluetooth Temperature Data Logger Volume (K), by Types 2025 & 2033
- Figure 21: South America Bluetooth Temperature Data Logger Revenue Share (%), by Types 2025 & 2033
- Figure 22: South America Bluetooth Temperature Data Logger Volume Share (%), by Types 2025 & 2033
- Figure 23: South America Bluetooth Temperature Data Logger Revenue (undefined), by Country 2025 & 2033
- Figure 24: South America Bluetooth Temperature Data Logger Volume (K), by Country 2025 & 2033
- Figure 25: South America Bluetooth Temperature Data Logger Revenue Share (%), by Country 2025 & 2033
- Figure 26: South America Bluetooth Temperature Data Logger Volume Share (%), by Country 2025 & 2033
- Figure 27: Europe Bluetooth Temperature Data Logger Revenue (undefined), by Application 2025 & 2033
- Figure 28: Europe Bluetooth Temperature Data Logger Volume (K), by Application 2025 & 2033
- Figure 29: Europe Bluetooth Temperature Data Logger Revenue Share (%), by Application 2025 & 2033
- Figure 30: Europe Bluetooth Temperature Data Logger Volume Share (%), by Application 2025 & 2033
- Figure 31: Europe Bluetooth Temperature Data Logger Revenue (undefined), by Types 2025 & 2033
- Figure 32: Europe Bluetooth Temperature Data Logger Volume (K), by Types 2025 & 2033
- Figure 33: Europe Bluetooth Temperature Data Logger Revenue Share (%), by Types 2025 & 2033
- Figure 34: Europe Bluetooth Temperature Data Logger Volume Share (%), by Types 2025 & 2033
- Figure 35: Europe Bluetooth Temperature Data Logger Revenue (undefined), by Country 2025 & 2033
- Figure 36: Europe Bluetooth Temperature Data Logger Volume (K), by Country 2025 & 2033
- Figure 37: Europe Bluetooth Temperature Data Logger Revenue Share (%), by Country 2025 & 2033
- Figure 38: Europe Bluetooth Temperature Data Logger Volume Share (%), by Country 2025 & 2033
- Figure 39: Middle East & Africa Bluetooth Temperature Data Logger Revenue (undefined), by Application 2025 & 2033
- Figure 40: Middle East & Africa Bluetooth Temperature Data Logger Volume (K), by Application 2025 & 2033
- Figure 41: Middle East & Africa Bluetooth Temperature Data Logger Revenue Share (%), by Application 2025 & 2033
- Figure 42: Middle East & Africa Bluetooth Temperature Data Logger Volume Share (%), by Application 2025 & 2033
- Figure 43: Middle East & Africa Bluetooth Temperature Data Logger Revenue (undefined), by Types 2025 & 2033
- Figure 44: Middle East & Africa Bluetooth Temperature Data Logger Volume (K), by Types 2025 & 2033
- Figure 45: Middle East & Africa Bluetooth Temperature Data Logger Revenue Share (%), by Types 2025 & 2033
- Figure 46: Middle East & Africa Bluetooth Temperature Data Logger Volume Share (%), by Types 2025 & 2033
- Figure 47: Middle East & Africa Bluetooth Temperature Data Logger Revenue (undefined), by Country 2025 & 2033
- Figure 48: Middle East & Africa Bluetooth Temperature Data Logger Volume (K), by Country 2025 & 2033
- Figure 49: Middle East & Africa Bluetooth Temperature Data Logger Revenue Share (%), by Country 2025 & 2033
- Figure 50: Middle East & Africa Bluetooth Temperature Data Logger Volume Share (%), by Country 2025 & 2033
- Figure 51: Asia Pacific Bluetooth Temperature Data Logger Revenue (undefined), by Application 2025 & 2033
- Figure 52: Asia Pacific Bluetooth Temperature Data Logger Volume (K), by Application 2025 & 2033
- Figure 53: Asia Pacific Bluetooth Temperature Data Logger Revenue Share (%), by Application 2025 & 2033
- Figure 54: Asia Pacific Bluetooth Temperature Data Logger Volume Share (%), by Application 2025 & 2033
- Figure 55: Asia Pacific Bluetooth Temperature Data Logger Revenue (undefined), by Types 2025 & 2033
- Figure 56: Asia Pacific Bluetooth Temperature Data Logger Volume (K), by Types 2025 & 2033
- Figure 57: Asia Pacific Bluetooth Temperature Data Logger Revenue Share (%), by Types 2025 & 2033
- Figure 58: Asia Pacific Bluetooth Temperature Data Logger Volume Share (%), by Types 2025 & 2033
- Figure 59: Asia Pacific Bluetooth Temperature Data Logger Revenue (undefined), by Country 2025 & 2033
- Figure 60: Asia Pacific Bluetooth Temperature Data Logger Volume (K), by Country 2025 & 2033
- Figure 61: Asia Pacific Bluetooth Temperature Data Logger Revenue Share (%), by Country 2025 & 2033
- Figure 62: Asia Pacific Bluetooth Temperature Data Logger Volume Share (%), by Country 2025 & 2033
List of Tables
- Table 1: Global Bluetooth Temperature Data Logger Revenue undefined Forecast, by Application 2020 & 2033
- Table 2: Global Bluetooth Temperature Data Logger Volume K Forecast, by Application 2020 & 2033
- Table 3: Global Bluetooth Temperature Data Logger Revenue undefined Forecast, by Types 2020 & 2033
- Table 4: Global Bluetooth Temperature Data Logger Volume K Forecast, by Types 2020 & 2033
- Table 5: Global Bluetooth Temperature Data Logger Revenue undefined Forecast, by Region 2020 & 2033
- Table 6: Global Bluetooth Temperature Data Logger Volume K Forecast, by Region 2020 & 2033
- Table 7: Global Bluetooth Temperature Data Logger Revenue undefined Forecast, by Application 2020 & 2033
- Table 8: Global Bluetooth Temperature Data Logger Volume K Forecast, by Application 2020 & 2033
- Table 9: Global Bluetooth Temperature Data Logger Revenue undefined Forecast, by Types 2020 & 2033
- Table 10: Global Bluetooth Temperature Data Logger Volume K Forecast, by Types 2020 & 2033
- Table 11: Global Bluetooth Temperature Data Logger Revenue undefined Forecast, by Country 2020 & 2033
- Table 12: Global Bluetooth Temperature Data Logger Volume K Forecast, by Country 2020 & 2033
- Table 13: United States Bluetooth Temperature Data Logger Revenue (undefined) Forecast, by Application 2020 & 2033
- Table 14: United States Bluetooth Temperature Data Logger Volume (K) Forecast, by Application 2020 & 2033
- Table 15: Canada Bluetooth Temperature Data Logger Revenue (undefined) Forecast, by Application 2020 & 2033
- Table 16: Canada Bluetooth Temperature Data Logger Volume (K) Forecast, by Application 2020 & 2033
- Table 17: Mexico Bluetooth Temperature Data Logger Revenue (undefined) Forecast, by Application 2020 & 2033
- Table 18: Mexico Bluetooth Temperature Data Logger Volume (K) Forecast, by Application 2020 & 2033
- Table 19: Global Bluetooth Temperature Data Logger Revenue undefined Forecast, by Application 2020 & 2033
- Table 20: Global Bluetooth Temperature Data Logger Volume K Forecast, by Application 2020 & 2033
- Table 21: Global Bluetooth Temperature Data Logger Revenue undefined Forecast, by Types 2020 & 2033
- Table 22: Global Bluetooth Temperature Data Logger Volume K Forecast, by Types 2020 & 2033
- Table 23: Global Bluetooth Temperature Data Logger Revenue undefined Forecast, by Country 2020 & 2033
- Table 24: Global Bluetooth Temperature Data Logger Volume K Forecast, by Country 2020 & 2033
- Table 25: Brazil Bluetooth Temperature Data Logger Revenue (undefined) Forecast, by Application 2020 & 2033
- Table 26: Brazil Bluetooth Temperature Data Logger Volume (K) Forecast, by Application 2020 & 2033
- Table 27: Argentina Bluetooth Temperature Data Logger Revenue (undefined) Forecast, by Application 2020 & 2033
- Table 28: Argentina Bluetooth Temperature Data Logger Volume (K) Forecast, by Application 2020 & 2033
- Table 29: Rest of South America Bluetooth Temperature Data Logger Revenue (undefined) Forecast, by Application 2020 & 2033
- Table 30: Rest of South America Bluetooth Temperature Data Logger Volume (K) Forecast, by Application 2020 & 2033
- Table 31: Global Bluetooth Temperature Data Logger Revenue undefined Forecast, by Application 2020 & 2033
- Table 32: Global Bluetooth Temperature Data Logger Volume K Forecast, by Application 2020 & 2033
- Table 33: Global Bluetooth Temperature Data Logger Revenue undefined Forecast, by Types 2020 & 2033
- Table 34: Global Bluetooth Temperature Data Logger Volume K Forecast, by Types 2020 & 2033
- Table 35: Global Bluetooth Temperature Data Logger Revenue undefined Forecast, by Country 2020 & 2033
- Table 36: Global Bluetooth Temperature Data Logger Volume K Forecast, by Country 2020 & 2033
- Table 37: United Kingdom Bluetooth Temperature Data Logger Revenue (undefined) Forecast, by Application 2020 & 2033
- Table 38: United Kingdom Bluetooth Temperature Data Logger Volume (K) Forecast, by Application 2020 & 2033
- Table 39: Germany Bluetooth Temperature Data Logger Revenue (undefined) Forecast, by Application 2020 & 2033
- Table 40: Germany Bluetooth Temperature Data Logger Volume (K) Forecast, by Application 2020 & 2033
- Table 41: France Bluetooth Temperature Data Logger Revenue (undefined) Forecast, by Application 2020 & 2033
- Table 42: France Bluetooth Temperature Data Logger Volume (K) Forecast, by Application 2020 & 2033
- Table 43: Italy Bluetooth Temperature Data Logger Revenue (undefined) Forecast, by Application 2020 & 2033
- Table 44: Italy Bluetooth Temperature Data Logger Volume (K) Forecast, by Application 2020 & 2033
- Table 45: Spain Bluetooth Temperature Data Logger Revenue (undefined) Forecast, by Application 2020 & 2033
- Table 46: Spain Bluetooth Temperature Data Logger Volume (K) Forecast, by Application 2020 & 2033
- Table 47: Russia Bluetooth Temperature Data Logger Revenue (undefined) Forecast, by Application 2020 & 2033
- Table 48: Russia Bluetooth Temperature Data Logger Volume (K) Forecast, by Application 2020 & 2033
- Table 49: Benelux Bluetooth Temperature Data Logger Revenue (undefined) Forecast, by Application 2020 & 2033
- Table 50: Benelux Bluetooth Temperature Data Logger Volume (K) Forecast, by Application 2020 & 2033
- Table 51: Nordics Bluetooth Temperature Data Logger Revenue (undefined) Forecast, by Application 2020 & 2033
- Table 52: Nordics Bluetooth Temperature Data Logger Volume (K) Forecast, by Application 2020 & 2033
- Table 53: Rest of Europe Bluetooth Temperature Data Logger Revenue (undefined) Forecast, by Application 2020 & 2033
- Table 54: Rest of Europe Bluetooth Temperature Data Logger Volume (K) Forecast, by Application 2020 & 2033
- Table 55: Global Bluetooth Temperature Data Logger Revenue undefined Forecast, by Application 2020 & 2033
- Table 56: Global Bluetooth Temperature Data Logger Volume K Forecast, by Application 2020 & 2033
- Table 57: Global Bluetooth Temperature Data Logger Revenue undefined Forecast, by Types 2020 & 2033
- Table 58: Global Bluetooth Temperature Data Logger Volume K Forecast, by Types 2020 & 2033
- Table 59: Global Bluetooth Temperature Data Logger Revenue undefined Forecast, by Country 2020 & 2033
- Table 60: Global Bluetooth Temperature Data Logger Volume K Forecast, by Country 2020 & 2033
- Table 61: Turkey Bluetooth Temperature Data Logger Revenue (undefined) Forecast, by Application 2020 & 2033
- Table 62: Turkey Bluetooth Temperature Data Logger Volume (K) Forecast, by Application 2020 & 2033
- Table 63: Israel Bluetooth Temperature Data Logger Revenue (undefined) Forecast, by Application 2020 & 2033
- Table 64: Israel Bluetooth Temperature Data Logger Volume (K) Forecast, by Application 2020 & 2033
- Table 65: GCC Bluetooth Temperature Data Logger Revenue (undefined) Forecast, by Application 2020 & 2033
- Table 66: GCC Bluetooth Temperature Data Logger Volume (K) Forecast, by Application 2020 & 2033
- Table 67: North Africa Bluetooth Temperature Data Logger Revenue (undefined) Forecast, by Application 2020 & 2033
- Table 68: North Africa Bluetooth Temperature Data Logger Volume (K) Forecast, by Application 2020 & 2033
- Table 69: South Africa Bluetooth Temperature Data Logger Revenue (undefined) Forecast, by Application 2020 & 2033
- Table 70: South Africa Bluetooth Temperature Data Logger Volume (K) Forecast, by Application 2020 & 2033
- Table 71: Rest of Middle East & Africa Bluetooth Temperature Data Logger Revenue (undefined) Forecast, by Application 2020 & 2033
- Table 72: Rest of Middle East & Africa Bluetooth Temperature Data Logger Volume (K) Forecast, by Application 2020 & 2033
- Table 73: Global Bluetooth Temperature Data Logger Revenue undefined Forecast, by Application 2020 & 2033
- Table 74: Global Bluetooth Temperature Data Logger Volume K Forecast, by Application 2020 & 2033
- Table 75: Global Bluetooth Temperature Data Logger Revenue undefined Forecast, by Types 2020 & 2033
- Table 76: Global Bluetooth Temperature Data Logger Volume K Forecast, by Types 2020 & 2033
- Table 77: Global Bluetooth Temperature Data Logger Revenue undefined Forecast, by Country 2020 & 2033
- Table 78: Global Bluetooth Temperature Data Logger Volume K Forecast, by Country 2020 & 2033
- Table 79: China Bluetooth Temperature Data Logger Revenue (undefined) Forecast, by Application 2020 & 2033
- Table 80: China Bluetooth Temperature Data Logger Volume (K) Forecast, by Application 2020 & 2033
- Table 81: India Bluetooth Temperature Data Logger Revenue (undefined) Forecast, by Application 2020 & 2033
- Table 82: India Bluetooth Temperature Data Logger Volume (K) Forecast, by Application 2020 & 2033
- Table 83: Japan Bluetooth Temperature Data Logger Revenue (undefined) Forecast, by Application 2020 & 2033
- Table 84: Japan Bluetooth Temperature Data Logger Volume (K) Forecast, by Application 2020 & 2033
- Table 85: South Korea Bluetooth Temperature Data Logger Revenue (undefined) Forecast, by Application 2020 & 2033
- Table 86: South Korea Bluetooth Temperature Data Logger Volume (K) Forecast, by Application 2020 & 2033
- Table 87: ASEAN Bluetooth Temperature Data Logger Revenue (undefined) Forecast, by Application 2020 & 2033
- Table 88: ASEAN Bluetooth Temperature Data Logger Volume (K) Forecast, by Application 2020 & 2033
- Table 89: Oceania Bluetooth Temperature Data Logger Revenue (undefined) Forecast, by Application 2020 & 2033
- Table 90: Oceania Bluetooth Temperature Data Logger Volume (K) Forecast, by Application 2020 & 2033
- Table 91: Rest of Asia Pacific Bluetooth Temperature Data Logger Revenue (undefined) Forecast, by Application 2020 & 2033
- Table 92: Rest of Asia Pacific Bluetooth Temperature Data Logger Volume (K) Forecast, by Application 2020 & 2033
Frequently Asked Questions
1. What is the projected Compound Annual Growth Rate (CAGR) of the Bluetooth Temperature Data Logger?
The projected CAGR is approximately 12.78%.
2. Which companies are prominent players in the Bluetooth Temperature Data Logger?
Key companies in the market include AZ Instrument Corp, DicksonData, NOVUS Automation Inc., Elitech, Data Logger Products, TempSen, Traceable Products, Hangzhou Zeda Instruments, Tzone Digital Technology Co, MSR-Electronic GmbH, Synotronics, Onset, Lascar Electronics, DeltaTrak Inc., OCEASOFT, Wagner Meters, Data Harvest, Smashtag, Tecnosoft, METER Group, Labfacility Limited.
3. What are the main segments of the Bluetooth Temperature Data Logger?
The market segments include Application, Types.
4. Can you provide details about the market size?
The market size is estimated to be USD XXX N/A as of 2022.
5. What are some drivers contributing to market growth?
N/A
6. What are the notable trends driving market growth?
N/A
7. Are there any restraints impacting market growth?
N/A
8. Can you provide examples of recent developments in the market?
N/A
9. What pricing options are available for accessing the report?
Pricing options include single-user, multi-user, and enterprise licenses priced at USD 4350.00, USD 6525.00, and USD 8700.00 respectively.
10. Is the market size provided in terms of value or volume?
The market size is provided in terms of value, measured in N/A and volume, measured in K.
11. Are there any specific market keywords associated with the report?
Yes, the market keyword associated with the report is "Bluetooth Temperature Data Logger," which aids in identifying and referencing the specific market segment covered.
12. How do I determine which pricing option suits my needs best?
The pricing options vary based on user requirements and access needs. Individual users may opt for single-user licenses, while businesses requiring broader access may choose multi-user or enterprise licenses for cost-effective access to the report.
13. Are there any additional resources or data provided in the Bluetooth Temperature Data Logger report?
While the report offers comprehensive insights, it's advisable to review the specific contents or supplementary materials provided to ascertain if additional resources or data are available.
14. How can I stay updated on further developments or reports in the Bluetooth Temperature Data Logger?
To stay informed about further developments, trends, and reports in the Bluetooth Temperature Data Logger, consider subscribing to industry newsletters, following relevant companies and organizations, or regularly checking reputable industry news sources and publications.
Methodology
Step 1 - Identification of Relevant Samples Size from Population Database


Step 2 - Approaches for Defining Global Market Size (Value, Volume* & Price*)

Note*: In applicable scenarios
Step 3 - Data Sources
Primary Research
- Web Analytics
- Survey Reports
- Research Institute
- Latest Research Reports
- Opinion Leaders
Secondary Research
- Annual Reports
- White Paper
- Latest Press Release
- Industry Association
- Paid Database
- Investor Presentations

Step 4 - Data Triangulation
Involves using different sources of information in order to increase the validity of a study
These sources are likely to be stakeholders in a program - participants, other researchers, program staff, other community members, and so on.
Then we put all data in single framework & apply various statistical tools to find out the dynamic on the market.
During the analysis stage, feedback from the stakeholder groups would be compared to determine areas of agreement as well as areas of divergence