

Key Insights
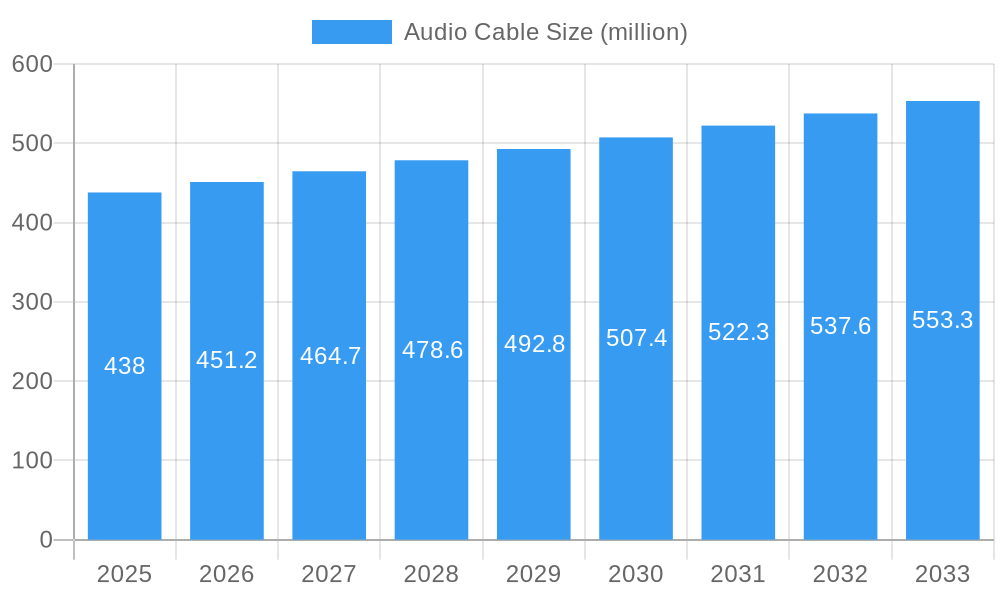
The global audio cable market, valued at $438 million in 2025, is projected to experience steady growth, driven by the increasing demand for high-fidelity audio experiences across various consumer electronics. The 3.1% CAGR from 2025 to 2033 indicates a consistent expansion, fueled by factors such as the rising popularity of high-resolution audio formats (like FLAC and WAV), the growth of the gaming industry (requiring high-quality audio peripherals), and the continued adoption of smart home devices with advanced audio capabilities. Premium audio cable brands like Tara Labs and Siltech cater to the high-end market segment focused on superior sound quality, while brands such as UGREEN, Anker, and Belkin dominate the mass market with a wider range of price points and functionalities. Market restraints could include the growing prevalence of wireless audio solutions and the potential for price sensitivity among budget-conscious consumers. However, the continued innovation in cable technology, such as the introduction of improved materials and designs to enhance signal transmission and durability, is expected to counteract these challenges.
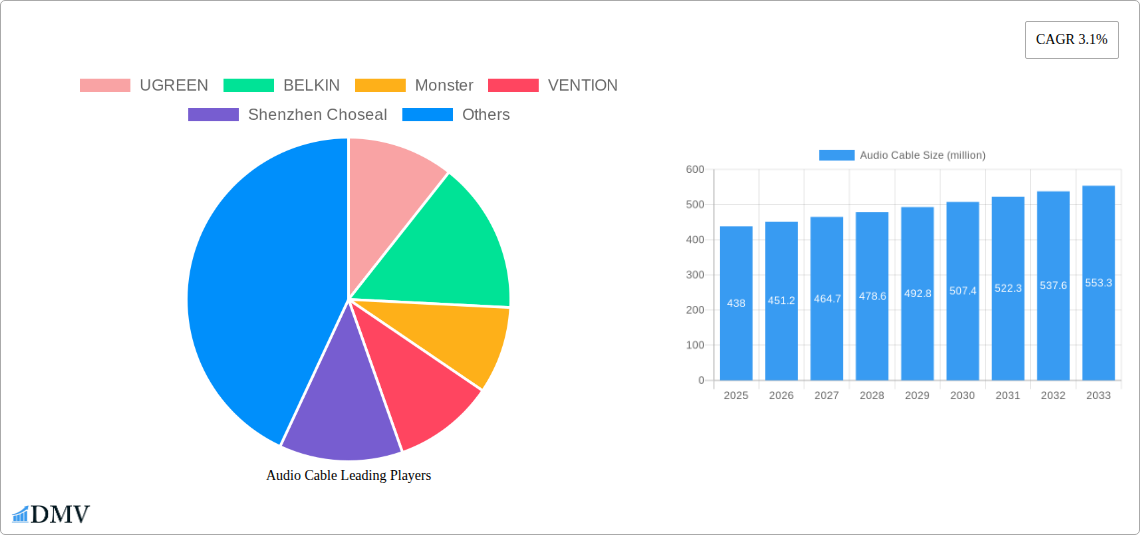
Audio Cable Market Size (In Million)
The competitive landscape is characterized by a blend of established players and emerging brands. Established brands leverage their brand recognition and distribution networks, while newer entrants often focus on niche markets or innovative technologies. Regional market variations are likely, with developed economies exhibiting higher per-capita consumption and a preference for premium products. Emerging markets will likely show slower but significant growth, driven by increasing affordability and expanding access to consumer electronics. Future market growth will hinge on factors including the development of advanced audio technologies (like lossless audio codecs), the increasing integration of audio cables into smart home ecosystems, and the ongoing evolution of consumer preferences related to sound quality and convenience. Continued innovation in materials science and manufacturing processes will play a crucial role in driving market expansion by making better-performing, more durable, and potentially more cost-effective cables available.
Audio Cable Company Market Share
Audio Cable Market Report: A Comprehensive Analysis (2019-2033)
This comprehensive report provides an in-depth analysis of the global audio cable market, projecting a multi-million-dollar valuation by 2033. The study covers the period from 2019 to 2033, with a base year of 2025 and a forecast period spanning 2025-2033. Key market segments are analyzed, along with major players like UGREEN, BELKIN, Monster, and others, revealing key trends and growth drivers shaping this dynamic industry. This report is invaluable for stakeholders seeking to understand the market landscape and make strategic decisions in the audio cable sector.
Audio Cable Market Composition & Trends
This section evaluates the audio cable market's competitive landscape, highlighting market concentration and innovation trends. We analyze regulatory changes, the presence of substitute products, and the evolving end-user profiles that impact market dynamics. Furthermore, we examine merger and acquisition (M&A) activities within the industry, quantifying deal values in millions of dollars.
- Market Concentration: The market exhibits a moderately concentrated structure, with the top five players holding an estimated xx% market share in 2025. UGREEN, BELKIN, and Monster are among the leading players.
- Innovation Catalysts: The rising demand for high-fidelity audio, advancements in materials science (e.g., improved conductors), and miniaturization trends are driving innovation.
- Regulatory Landscape: Compliance with international standards (e.g., RoHS, REACH) impacts product design and manufacturing.
- Substitute Products: Wireless technologies (Bluetooth, Wi-Fi) pose a competitive threat, but wired audio cables maintain relevance due to superior audio quality and reliability in certain applications.
- End-User Profiles: Key end-users include consumers (home audio, mobile devices), professional audio studios, and automotive manufacturers.
- M&A Activities: Significant M&A activities were observed during the historical period (2019-2024), with total deal values exceeding $xx million. The report details specific transactions and their impact on market consolidation.
Audio Cable Industry Evolution
This section meticulously analyzes the evolution of the audio cable market, charting growth trajectories and technological advancements from 2019 to 2033. We explore shifting consumer preferences and the adoption of new technologies.
The global audio cable market experienced a Compound Annual Growth Rate (CAGR) of xx% during the historical period (2019-2024). This growth was fueled by the increasing penetration of smartphones, smart speakers, and other audio devices. The forecast period (2025-2033) projects a CAGR of xx%, driven by the rising demand for high-resolution audio and the expansion of the gaming and automotive audio segments. Technological advancements such as the introduction of braided cables, improved shielding techniques, and the incorporation of advanced materials significantly impact market dynamics. The growing preference for high-quality audio experiences continues to boost market growth. Consumer demand for durability, aesthetically pleasing designs, and compatibility with a wider range of devices shapes product development.
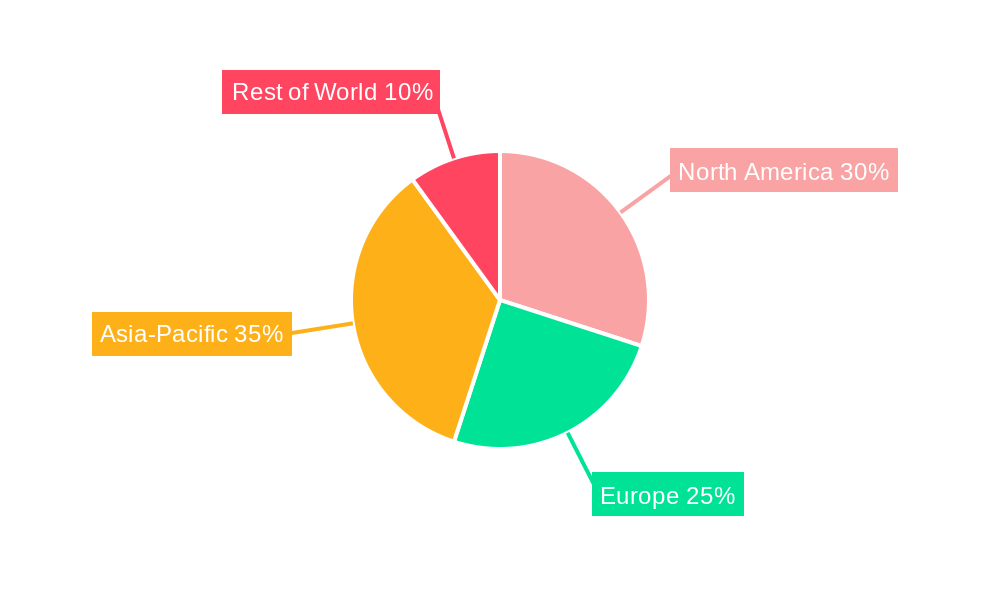
Leading Regions, Countries, or Segments in Audio Cable
This section identifies the dominant regions, countries, or segments within the audio cable market and provides a detailed explanation of their leading positions. We discuss factors such as investment trends, regulatory frameworks, and unique market characteristics.
Dominant Region: North America currently holds the largest market share, driven by high consumer spending on electronics and a strong preference for high-quality audio equipment. Asia Pacific is expected to experience significant growth in the forecast period due to increasing smartphone adoption and rising disposable incomes.
Key Drivers for North American Dominance:
- High per capita income and spending on consumer electronics.
- Established presence of major audio cable manufacturers.
- Strong regulatory framework supporting innovation and quality control.
Key Drivers for Asia Pacific Growth:
- Rapid expansion of the smartphone and consumer electronics market.
- Increasing disposable income among the middle class.
- Growing popularity of online audio streaming services.
Audio Cable Product Innovations
Recent innovations in audio cables include the introduction of high-purity copper and silver conductors, improved shielding to reduce electromagnetic interference (EMI), and the development of more durable and flexible materials. These advancements enhance audio quality, signal transmission, and the overall lifespan of the cables. Unique selling propositions often involve claims of superior audio clarity, reduced signal loss, and increased durability compared to standard cables.
Propelling Factors for Audio Cable Growth
Several factors drive the growth of the audio cable market. Technological advancements in cable materials and designs contribute to enhanced audio quality. Economic factors like increasing disposable incomes boost consumer spending on high-quality audio equipment. Lastly, favorable regulatory environments encouraging innovation further support market expansion.
Obstacles in the Audio Cable Market
The audio cable market faces challenges including the rise of wireless audio technologies, supply chain disruptions impacting material availability and costs, and intense competition from numerous players. These factors can restrict market growth and profitability.
Future Opportunities in Audio Cable
Future opportunities lie in expanding into emerging markets, developing cables for new applications (e.g., high-speed data transmission), and catering to the increasing demand for customized and specialized audio cables for specific uses.
Key Developments in Audio Cable Industry
- 2022 Q3: UGREEN launched a new line of USB-C audio cables with improved noise cancellation technology.
- 2023 Q1: BELKIN acquired a smaller audio cable manufacturer, expanding its product portfolio. (Value: $xx million)
Strategic Audio Cable Market Forecast
The audio cable market is poised for continued growth, driven by advancements in audio technology, increasing consumer demand for high-quality audio, and expansion into new markets. The forecast suggests a significant increase in market value over the next decade, presenting lucrative opportunities for existing players and new entrants alike.
Audio Cable Segmentation
-
1. Application
- 1.1. Online
- 1.2. Offline
-
2. Types
- 2.1. Consumer Level
- 2.2. Professional Level
Audio Cable Segmentation By Geography
-
1. North America
- 1.1. United States
- 1.2. Canada
- 1.3. Mexico
-
2. South America
- 2.1. Brazil
- 2.2. Argentina
- 2.3. Rest of South America
-
3. Europe
- 3.1. United Kingdom
- 3.2. Germany
- 3.3. France
- 3.4. Italy
- 3.5. Spain
- 3.6. Russia
- 3.7. Benelux
- 3.8. Nordics
- 3.9. Rest of Europe
-
4. Middle East & Africa
- 4.1. Turkey
- 4.2. Israel
- 4.3. GCC
- 4.4. North Africa
- 4.5. South Africa
- 4.6. Rest of Middle East & Africa
-
5. Asia Pacific
- 5.1. China
- 5.2. India
- 5.3. Japan
- 5.4. South Korea
- 5.5. ASEAN
- 5.6. Oceania
- 5.7. Rest of Asia Pacific
Audio Cable Regional Market Share
Geographic Coverage of Audio Cable
Audio Cable REPORT HIGHLIGHTS
| Aspects | Details |
|---|---|
| Study Period | 2020-2034 |
| Base Year | 2025 |
| Estimated Year | 2026 |
| Forecast Period | 2026-2034 |
| Historical Period | 2020-2025 |
| Growth Rate | CAGR of 3.1% from 2020-2034 |
| Segmentation |
|
Table of Contents
- 1. Introduction
- 1.1. Research Scope
- 1.2. Market Segmentation
- 1.3. Research Methodology
- 1.4. Definitions and Assumptions
- 2. Executive Summary
- 2.1. Introduction
- 3. Market Dynamics
- 3.1. Introduction
- 3.2. Market Drivers
- 3.3. Market Restrains
- 3.4. Market Trends
- 4. Market Factor Analysis
- 4.1. Porters Five Forces
- 4.2. Supply/Value Chain
- 4.3. PESTEL analysis
- 4.4. Market Entropy
- 4.5. Patent/Trademark Analysis
- 5. Global Audio Cable Analysis, Insights and Forecast, 2020-2032
- 5.1. Market Analysis, Insights and Forecast - by Application
- 5.1.1. Online
- 5.1.2. Offline
- 5.2. Market Analysis, Insights and Forecast - by Types
- 5.2.1. Consumer Level
- 5.2.2. Professional Level
- 5.3. Market Analysis, Insights and Forecast - by Region
- 5.3.1. North America
- 5.3.2. South America
- 5.3.3. Europe
- 5.3.4. Middle East & Africa
- 5.3.5. Asia Pacific
- 5.1. Market Analysis, Insights and Forecast - by Application
- 6. North America Audio Cable Analysis, Insights and Forecast, 2020-2032
- 6.1. Market Analysis, Insights and Forecast - by Application
- 6.1.1. Online
- 6.1.2. Offline
- 6.2. Market Analysis, Insights and Forecast - by Types
- 6.2.1. Consumer Level
- 6.2.2. Professional Level
- 6.1. Market Analysis, Insights and Forecast - by Application
- 7. South America Audio Cable Analysis, Insights and Forecast, 2020-2032
- 7.1. Market Analysis, Insights and Forecast - by Application
- 7.1.1. Online
- 7.1.2. Offline
- 7.2. Market Analysis, Insights and Forecast - by Types
- 7.2.1. Consumer Level
- 7.2.2. Professional Level
- 7.1. Market Analysis, Insights and Forecast - by Application
- 8. Europe Audio Cable Analysis, Insights and Forecast, 2020-2032
- 8.1. Market Analysis, Insights and Forecast - by Application
- 8.1.1. Online
- 8.1.2. Offline
- 8.2. Market Analysis, Insights and Forecast - by Types
- 8.2.1. Consumer Level
- 8.2.2. Professional Level
- 8.1. Market Analysis, Insights and Forecast - by Application
- 9. Middle East & Africa Audio Cable Analysis, Insights and Forecast, 2020-2032
- 9.1. Market Analysis, Insights and Forecast - by Application
- 9.1.1. Online
- 9.1.2. Offline
- 9.2. Market Analysis, Insights and Forecast - by Types
- 9.2.1. Consumer Level
- 9.2.2. Professional Level
- 9.1. Market Analysis, Insights and Forecast - by Application
- 10. Asia Pacific Audio Cable Analysis, Insights and Forecast, 2020-2032
- 10.1. Market Analysis, Insights and Forecast - by Application
- 10.1.1. Online
- 10.1.2. Offline
- 10.2. Market Analysis, Insights and Forecast - by Types
- 10.2.1. Consumer Level
- 10.2.2. Professional Level
- 10.1. Market Analysis, Insights and Forecast - by Application
- 11. Competitive Analysis
- 11.1. Global Market Share Analysis 2025
- 11.2. Company Profiles
- 11.2.1 UGREEN
- 11.2.1.1. Overview
- 11.2.1.2. Products
- 11.2.1.3. SWOT Analysis
- 11.2.1.4. Recent Developments
- 11.2.1.5. Financials (Based on Availability)
- 11.2.2 BELKIN
- 11.2.2.1. Overview
- 11.2.2.2. Products
- 11.2.2.3. SWOT Analysis
- 11.2.2.4. Recent Developments
- 11.2.2.5. Financials (Based on Availability)
- 11.2.3 Monster
- 11.2.3.1. Overview
- 11.2.3.2. Products
- 11.2.3.3. SWOT Analysis
- 11.2.3.4. Recent Developments
- 11.2.3.5. Financials (Based on Availability)
- 11.2.4 VENTION
- 11.2.4.1. Overview
- 11.2.4.2. Products
- 11.2.4.3. SWOT Analysis
- 11.2.4.4. Recent Developments
- 11.2.4.5. Financials (Based on Availability)
- 11.2.5 Shenzhen Choseal
- 11.2.5.1. Overview
- 11.2.5.2. Products
- 11.2.5.3. SWOT Analysis
- 11.2.5.4. Recent Developments
- 11.2.5.5. Financials (Based on Availability)
- 11.2.6 PHILIPS
- 11.2.6.1. Overview
- 11.2.6.2. Products
- 11.2.6.3. SWOT Analysis
- 11.2.6.4. Recent Developments
- 11.2.6.5. Financials (Based on Availability)
- 11.2.7 Siltech
- 11.2.7.1. Overview
- 11.2.7.2. Products
- 11.2.7.3. SWOT Analysis
- 11.2.7.4. Recent Developments
- 11.2.7.5. Financials (Based on Availability)
- 11.2.8 Anker
- 11.2.8.1. Overview
- 11.2.8.2. Products
- 11.2.8.3. SWOT Analysis
- 11.2.8.4. Recent Developments
- 11.2.8.5. Financials (Based on Availability)
- 11.2.9 Tara Labs
- 11.2.9.1. Overview
- 11.2.9.2. Products
- 11.2.9.3. SWOT Analysis
- 11.2.9.4. Recent Developments
- 11.2.9.5. Financials (Based on Availability)
- 11.2.10 UNITEK
- 11.2.10.1. Overview
- 11.2.10.2. Products
- 11.2.10.3. SWOT Analysis
- 11.2.10.4. Recent Developments
- 11.2.10.5. Financials (Based on Availability)
- 11.2.1 UGREEN
List of Figures
- Figure 1: Global Audio Cable Revenue Breakdown (million, %) by Region 2025 & 2033
- Figure 2: Global Audio Cable Volume Breakdown (K, %) by Region 2025 & 2033
- Figure 3: North America Audio Cable Revenue (million), by Application 2025 & 2033
- Figure 4: North America Audio Cable Volume (K), by Application 2025 & 2033
- Figure 5: North America Audio Cable Revenue Share (%), by Application 2025 & 2033
- Figure 6: North America Audio Cable Volume Share (%), by Application 2025 & 2033
- Figure 7: North America Audio Cable Revenue (million), by Types 2025 & 2033
- Figure 8: North America Audio Cable Volume (K), by Types 2025 & 2033
- Figure 9: North America Audio Cable Revenue Share (%), by Types 2025 & 2033
- Figure 10: North America Audio Cable Volume Share (%), by Types 2025 & 2033
- Figure 11: North America Audio Cable Revenue (million), by Country 2025 & 2033
- Figure 12: North America Audio Cable Volume (K), by Country 2025 & 2033
- Figure 13: North America Audio Cable Revenue Share (%), by Country 2025 & 2033
- Figure 14: North America Audio Cable Volume Share (%), by Country 2025 & 2033
- Figure 15: South America Audio Cable Revenue (million), by Application 2025 & 2033
- Figure 16: South America Audio Cable Volume (K), by Application 2025 & 2033
- Figure 17: South America Audio Cable Revenue Share (%), by Application 2025 & 2033
- Figure 18: South America Audio Cable Volume Share (%), by Application 2025 & 2033
- Figure 19: South America Audio Cable Revenue (million), by Types 2025 & 2033
- Figure 20: South America Audio Cable Volume (K), by Types 2025 & 2033
- Figure 21: South America Audio Cable Revenue Share (%), by Types 2025 & 2033
- Figure 22: South America Audio Cable Volume Share (%), by Types 2025 & 2033
- Figure 23: South America Audio Cable Revenue (million), by Country 2025 & 2033
- Figure 24: South America Audio Cable Volume (K), by Country 2025 & 2033
- Figure 25: South America Audio Cable Revenue Share (%), by Country 2025 & 2033
- Figure 26: South America Audio Cable Volume Share (%), by Country 2025 & 2033
- Figure 27: Europe Audio Cable Revenue (million), by Application 2025 & 2033
- Figure 28: Europe Audio Cable Volume (K), by Application 2025 & 2033
- Figure 29: Europe Audio Cable Revenue Share (%), by Application 2025 & 2033
- Figure 30: Europe Audio Cable Volume Share (%), by Application 2025 & 2033
- Figure 31: Europe Audio Cable Revenue (million), by Types 2025 & 2033
- Figure 32: Europe Audio Cable Volume (K), by Types 2025 & 2033
- Figure 33: Europe Audio Cable Revenue Share (%), by Types 2025 & 2033
- Figure 34: Europe Audio Cable Volume Share (%), by Types 2025 & 2033
- Figure 35: Europe Audio Cable Revenue (million), by Country 2025 & 2033
- Figure 36: Europe Audio Cable Volume (K), by Country 2025 & 2033
- Figure 37: Europe Audio Cable Revenue Share (%), by Country 2025 & 2033
- Figure 38: Europe Audio Cable Volume Share (%), by Country 2025 & 2033
- Figure 39: Middle East & Africa Audio Cable Revenue (million), by Application 2025 & 2033
- Figure 40: Middle East & Africa Audio Cable Volume (K), by Application 2025 & 2033
- Figure 41: Middle East & Africa Audio Cable Revenue Share (%), by Application 2025 & 2033
- Figure 42: Middle East & Africa Audio Cable Volume Share (%), by Application 2025 & 2033
- Figure 43: Middle East & Africa Audio Cable Revenue (million), by Types 2025 & 2033
- Figure 44: Middle East & Africa Audio Cable Volume (K), by Types 2025 & 2033
- Figure 45: Middle East & Africa Audio Cable Revenue Share (%), by Types 2025 & 2033
- Figure 46: Middle East & Africa Audio Cable Volume Share (%), by Types 2025 & 2033
- Figure 47: Middle East & Africa Audio Cable Revenue (million), by Country 2025 & 2033
- Figure 48: Middle East & Africa Audio Cable Volume (K), by Country 2025 & 2033
- Figure 49: Middle East & Africa Audio Cable Revenue Share (%), by Country 2025 & 2033
- Figure 50: Middle East & Africa Audio Cable Volume Share (%), by Country 2025 & 2033
- Figure 51: Asia Pacific Audio Cable Revenue (million), by Application 2025 & 2033
- Figure 52: Asia Pacific Audio Cable Volume (K), by Application 2025 & 2033
- Figure 53: Asia Pacific Audio Cable Revenue Share (%), by Application 2025 & 2033
- Figure 54: Asia Pacific Audio Cable Volume Share (%), by Application 2025 & 2033
- Figure 55: Asia Pacific Audio Cable Revenue (million), by Types 2025 & 2033
- Figure 56: Asia Pacific Audio Cable Volume (K), by Types 2025 & 2033
- Figure 57: Asia Pacific Audio Cable Revenue Share (%), by Types 2025 & 2033
- Figure 58: Asia Pacific Audio Cable Volume Share (%), by Types 2025 & 2033
- Figure 59: Asia Pacific Audio Cable Revenue (million), by Country 2025 & 2033
- Figure 60: Asia Pacific Audio Cable Volume (K), by Country 2025 & 2033
- Figure 61: Asia Pacific Audio Cable Revenue Share (%), by Country 2025 & 2033
- Figure 62: Asia Pacific Audio Cable Volume Share (%), by Country 2025 & 2033
List of Tables
- Table 1: Global Audio Cable Revenue million Forecast, by Application 2020 & 2033
- Table 2: Global Audio Cable Volume K Forecast, by Application 2020 & 2033
- Table 3: Global Audio Cable Revenue million Forecast, by Types 2020 & 2033
- Table 4: Global Audio Cable Volume K Forecast, by Types 2020 & 2033
- Table 5: Global Audio Cable Revenue million Forecast, by Region 2020 & 2033
- Table 6: Global Audio Cable Volume K Forecast, by Region 2020 & 2033
- Table 7: Global Audio Cable Revenue million Forecast, by Application 2020 & 2033
- Table 8: Global Audio Cable Volume K Forecast, by Application 2020 & 2033
- Table 9: Global Audio Cable Revenue million Forecast, by Types 2020 & 2033
- Table 10: Global Audio Cable Volume K Forecast, by Types 2020 & 2033
- Table 11: Global Audio Cable Revenue million Forecast, by Country 2020 & 2033
- Table 12: Global Audio Cable Volume K Forecast, by Country 2020 & 2033
- Table 13: United States Audio Cable Revenue (million) Forecast, by Application 2020 & 2033
- Table 14: United States Audio Cable Volume (K) Forecast, by Application 2020 & 2033
- Table 15: Canada Audio Cable Revenue (million) Forecast, by Application 2020 & 2033
- Table 16: Canada Audio Cable Volume (K) Forecast, by Application 2020 & 2033
- Table 17: Mexico Audio Cable Revenue (million) Forecast, by Application 2020 & 2033
- Table 18: Mexico Audio Cable Volume (K) Forecast, by Application 2020 & 2033
- Table 19: Global Audio Cable Revenue million Forecast, by Application 2020 & 2033
- Table 20: Global Audio Cable Volume K Forecast, by Application 2020 & 2033
- Table 21: Global Audio Cable Revenue million Forecast, by Types 2020 & 2033
- Table 22: Global Audio Cable Volume K Forecast, by Types 2020 & 2033
- Table 23: Global Audio Cable Revenue million Forecast, by Country 2020 & 2033
- Table 24: Global Audio Cable Volume K Forecast, by Country 2020 & 2033
- Table 25: Brazil Audio Cable Revenue (million) Forecast, by Application 2020 & 2033
- Table 26: Brazil Audio Cable Volume (K) Forecast, by Application 2020 & 2033
- Table 27: Argentina Audio Cable Revenue (million) Forecast, by Application 2020 & 2033
- Table 28: Argentina Audio Cable Volume (K) Forecast, by Application 2020 & 2033
- Table 29: Rest of South America Audio Cable Revenue (million) Forecast, by Application 2020 & 2033
- Table 30: Rest of South America Audio Cable Volume (K) Forecast, by Application 2020 & 2033
- Table 31: Global Audio Cable Revenue million Forecast, by Application 2020 & 2033
- Table 32: Global Audio Cable Volume K Forecast, by Application 2020 & 2033
- Table 33: Global Audio Cable Revenue million Forecast, by Types 2020 & 2033
- Table 34: Global Audio Cable Volume K Forecast, by Types 2020 & 2033
- Table 35: Global Audio Cable Revenue million Forecast, by Country 2020 & 2033
- Table 36: Global Audio Cable Volume K Forecast, by Country 2020 & 2033
- Table 37: United Kingdom Audio Cable Revenue (million) Forecast, by Application 2020 & 2033
- Table 38: United Kingdom Audio Cable Volume (K) Forecast, by Application 2020 & 2033
- Table 39: Germany Audio Cable Revenue (million) Forecast, by Application 2020 & 2033
- Table 40: Germany Audio Cable Volume (K) Forecast, by Application 2020 & 2033
- Table 41: France Audio Cable Revenue (million) Forecast, by Application 2020 & 2033
- Table 42: France Audio Cable Volume (K) Forecast, by Application 2020 & 2033
- Table 43: Italy Audio Cable Revenue (million) Forecast, by Application 2020 & 2033
- Table 44: Italy Audio Cable Volume (K) Forecast, by Application 2020 & 2033
- Table 45: Spain Audio Cable Revenue (million) Forecast, by Application 2020 & 2033
- Table 46: Spain Audio Cable Volume (K) Forecast, by Application 2020 & 2033
- Table 47: Russia Audio Cable Revenue (million) Forecast, by Application 2020 & 2033
- Table 48: Russia Audio Cable Volume (K) Forecast, by Application 2020 & 2033
- Table 49: Benelux Audio Cable Revenue (million) Forecast, by Application 2020 & 2033
- Table 50: Benelux Audio Cable Volume (K) Forecast, by Application 2020 & 2033
- Table 51: Nordics Audio Cable Revenue (million) Forecast, by Application 2020 & 2033
- Table 52: Nordics Audio Cable Volume (K) Forecast, by Application 2020 & 2033
- Table 53: Rest of Europe Audio Cable Revenue (million) Forecast, by Application 2020 & 2033
- Table 54: Rest of Europe Audio Cable Volume (K) Forecast, by Application 2020 & 2033
- Table 55: Global Audio Cable Revenue million Forecast, by Application 2020 & 2033
- Table 56: Global Audio Cable Volume K Forecast, by Application 2020 & 2033
- Table 57: Global Audio Cable Revenue million Forecast, by Types 2020 & 2033
- Table 58: Global Audio Cable Volume K Forecast, by Types 2020 & 2033
- Table 59: Global Audio Cable Revenue million Forecast, by Country 2020 & 2033
- Table 60: Global Audio Cable Volume K Forecast, by Country 2020 & 2033
- Table 61: Turkey Audio Cable Revenue (million) Forecast, by Application 2020 & 2033
- Table 62: Turkey Audio Cable Volume (K) Forecast, by Application 2020 & 2033
- Table 63: Israel Audio Cable Revenue (million) Forecast, by Application 2020 & 2033
- Table 64: Israel Audio Cable Volume (K) Forecast, by Application 2020 & 2033
- Table 65: GCC Audio Cable Revenue (million) Forecast, by Application 2020 & 2033
- Table 66: GCC Audio Cable Volume (K) Forecast, by Application 2020 & 2033
- Table 67: North Africa Audio Cable Revenue (million) Forecast, by Application 2020 & 2033
- Table 68: North Africa Audio Cable Volume (K) Forecast, by Application 2020 & 2033
- Table 69: South Africa Audio Cable Revenue (million) Forecast, by Application 2020 & 2033
- Table 70: South Africa Audio Cable Volume (K) Forecast, by Application 2020 & 2033
- Table 71: Rest of Middle East & Africa Audio Cable Revenue (million) Forecast, by Application 2020 & 2033
- Table 72: Rest of Middle East & Africa Audio Cable Volume (K) Forecast, by Application 2020 & 2033
- Table 73: Global Audio Cable Revenue million Forecast, by Application 2020 & 2033
- Table 74: Global Audio Cable Volume K Forecast, by Application 2020 & 2033
- Table 75: Global Audio Cable Revenue million Forecast, by Types 2020 & 2033
- Table 76: Global Audio Cable Volume K Forecast, by Types 2020 & 2033
- Table 77: Global Audio Cable Revenue million Forecast, by Country 2020 & 2033
- Table 78: Global Audio Cable Volume K Forecast, by Country 2020 & 2033
- Table 79: China Audio Cable Revenue (million) Forecast, by Application 2020 & 2033
- Table 80: China Audio Cable Volume (K) Forecast, by Application 2020 & 2033
- Table 81: India Audio Cable Revenue (million) Forecast, by Application 2020 & 2033
- Table 82: India Audio Cable Volume (K) Forecast, by Application 2020 & 2033
- Table 83: Japan Audio Cable Revenue (million) Forecast, by Application 2020 & 2033
- Table 84: Japan Audio Cable Volume (K) Forecast, by Application 2020 & 2033
- Table 85: South Korea Audio Cable Revenue (million) Forecast, by Application 2020 & 2033
- Table 86: South Korea Audio Cable Volume (K) Forecast, by Application 2020 & 2033
- Table 87: ASEAN Audio Cable Revenue (million) Forecast, by Application 2020 & 2033
- Table 88: ASEAN Audio Cable Volume (K) Forecast, by Application 2020 & 2033
- Table 89: Oceania Audio Cable Revenue (million) Forecast, by Application 2020 & 2033
- Table 90: Oceania Audio Cable Volume (K) Forecast, by Application 2020 & 2033
- Table 91: Rest of Asia Pacific Audio Cable Revenue (million) Forecast, by Application 2020 & 2033
- Table 92: Rest of Asia Pacific Audio Cable Volume (K) Forecast, by Application 2020 & 2033
Frequently Asked Questions
1. What is the projected Compound Annual Growth Rate (CAGR) of the Audio Cable?
The projected CAGR is approximately 3.1%.
2. Which companies are prominent players in the Audio Cable?
Key companies in the market include UGREEN, BELKIN, Monster, VENTION, Shenzhen Choseal, PHILIPS, Siltech, Anker, Tara Labs, UNITEK.
3. What are the main segments of the Audio Cable?
The market segments include Application, Types.
4. Can you provide details about the market size?
The market size is estimated to be USD 438 million as of 2022.
5. What are some drivers contributing to market growth?
N/A
6. What are the notable trends driving market growth?
N/A
7. Are there any restraints impacting market growth?
N/A
8. Can you provide examples of recent developments in the market?
N/A
9. What pricing options are available for accessing the report?
Pricing options include single-user, multi-user, and enterprise licenses priced at USD 4350.00, USD 6525.00, and USD 8700.00 respectively.
10. Is the market size provided in terms of value or volume?
The market size is provided in terms of value, measured in million and volume, measured in K.
11. Are there any specific market keywords associated with the report?
Yes, the market keyword associated with the report is "Audio Cable," which aids in identifying and referencing the specific market segment covered.
12. How do I determine which pricing option suits my needs best?
The pricing options vary based on user requirements and access needs. Individual users may opt for single-user licenses, while businesses requiring broader access may choose multi-user or enterprise licenses for cost-effective access to the report.
13. Are there any additional resources or data provided in the Audio Cable report?
While the report offers comprehensive insights, it's advisable to review the specific contents or supplementary materials provided to ascertain if additional resources or data are available.
14. How can I stay updated on further developments or reports in the Audio Cable?
To stay informed about further developments, trends, and reports in the Audio Cable, consider subscribing to industry newsletters, following relevant companies and organizations, or regularly checking reputable industry news sources and publications.
Methodology
Step 1 - Identification of Relevant Samples Size from Population Database


Step 2 - Approaches for Defining Global Market Size (Value, Volume* & Price*)

Note*: In applicable scenarios
Step 3 - Data Sources
Primary Research
- Web Analytics
- Survey Reports
- Research Institute
- Latest Research Reports
- Opinion Leaders
Secondary Research
- Annual Reports
- White Paper
- Latest Press Release
- Industry Association
- Paid Database
- Investor Presentations

Step 4 - Data Triangulation
Involves using different sources of information in order to increase the validity of a study
These sources are likely to be stakeholders in a program - participants, other researchers, program staff, other community members, and so on.
Then we put all data in single framework & apply various statistical tools to find out the dynamic on the market.
During the analysis stage, feedback from the stakeholder groups would be compared to determine areas of agreement as well as areas of divergence