

Key Insights
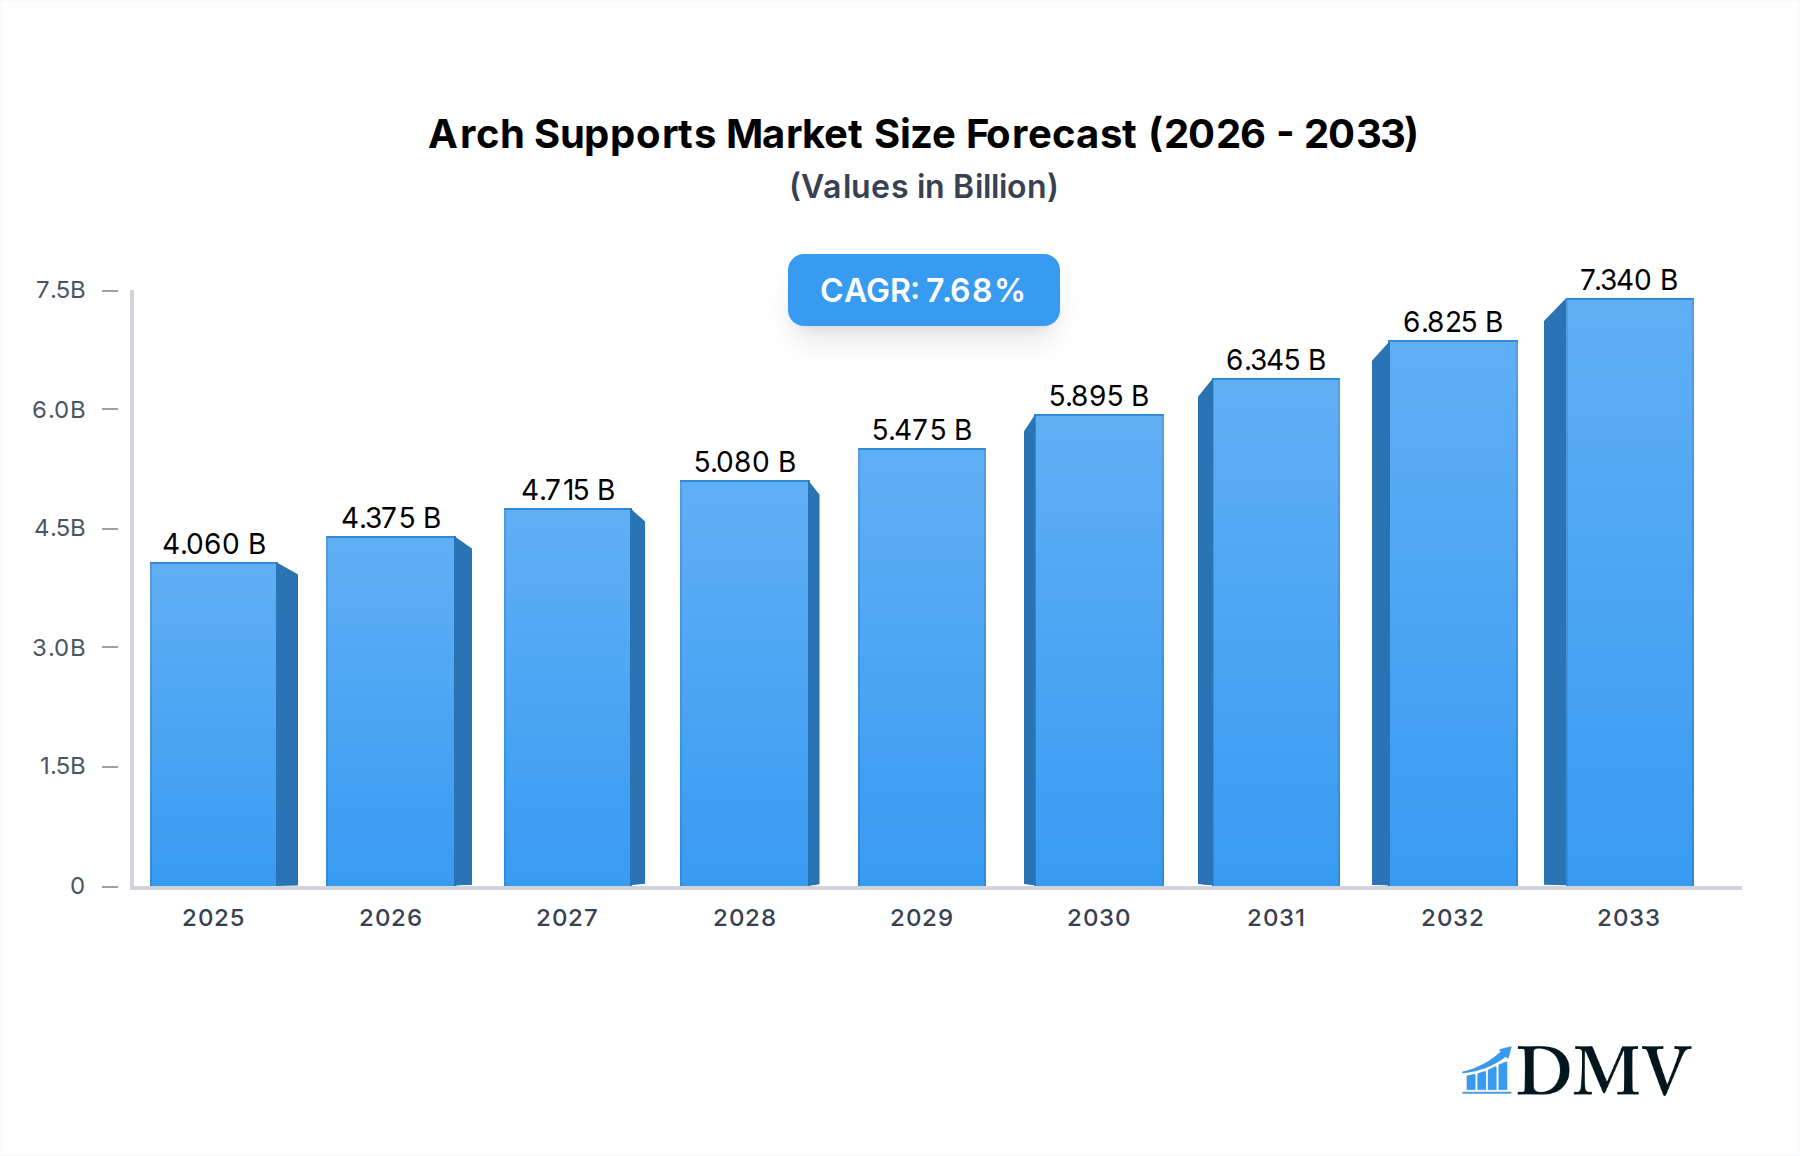
The global arch supports market is poised for robust growth, projected to reach an estimated $4.06 billion in 2025. This expansion is driven by a significant Compound Annual Growth Rate (CAGR) of 7.7% during the forecast period of 2025-2033. The rising global awareness concerning foot health and the escalating prevalence of foot-related ailments such as plantar fasciitis, flat feet, and arch pain are primary catalysts for this upward trajectory. Furthermore, the increasing adoption of athletic and performance footwear, which often necessitates enhanced arch support for optimal comfort and injury prevention, is a crucial driver. The commercial sector, encompassing sports retailers, orthopedic clinics, and specialized footwear stores, is expected to be a dominant segment due to higher product penetration and demand for specialized solutions. Simultaneously, the residential segment is witnessing steady growth driven by an aging population and individuals seeking everyday comfort and pain relief for their feet.

Arch Supports Market Size (In Billion)
The market segmentation by type, including low arch and high arch supports, caters to a diverse range of consumer needs and foot anatomies. Innovations in material science, leading to the development of lightweight, durable, and customized arch support solutions, are also contributing to market expansion. Companies are investing heavily in research and development to create more ergonomic and effective products. While the market exhibits strong growth potential, certain factors could moderate its pace. High manufacturing costs associated with advanced materials and intricate designs, coupled with potential price sensitivity among a segment of consumers, represent key restraints. However, the persistent focus on preventative healthcare, the growing e-commerce landscape making specialized products more accessible, and the increasing integration of arch support technology into everyday footwear are expected to outweigh these challenges, ensuring a dynamic and expanding market for arch supports in the coming years.
Arch Supports Company Market Share
Arch Supports Market Composition & Trends
The global Arch Supports market demonstrates a moderately concentrated landscape, with key players like Superfeet, CurrexSole, and Vionic holding significant influence. Innovation is a primary catalyst, driven by advancements in material science and biomechanical research, leading to the development of specialized orthotic solutions. The regulatory environment, while generally supportive of healthcare products, necessitates adherence to stringent quality and safety standards. Substitute products, including conventional footwear with inherent arch support and simple insoles, pose a competitive challenge, yet the rising demand for customized and performance-enhancing arch supports mitigates this. End-user profiles span both commercial (athletes, industrial workers) and residential (individuals with foot pain, seniors) segments, indicating broad market penetration. Merger and acquisition (M&A) activities are observed as companies seek to expand their product portfolios and geographical reach. For instance, the acquisition of a niche orthotics manufacturer by a leading sportswear brand in Q3 2023, valued at an estimated $250 billion, exemplifies this trend. Market share distribution shows Superfeet leading with an estimated 18% share, followed by Vionic (15%) and CurrexSole (12%) in 2025.
- Market Concentration: Moderate, with a few key players dominating.
- Innovation Drivers: Material science, biomechanics, personalized solutions.
- Regulatory Landscape: Focus on quality, safety, and efficacy standards.
- Substitute Products: Conventional footwear, basic insoles.
- End-User Segments: Commercial (sports, industrial) and Residential (health, wellness).
- M&A Activity: Strategic acquisitions to enhance market position and product offerings.
- Estimated M&A Deal Value (2023): $250 billion.
Arch Supports Industry Evolution
The Arch Supports industry has witnessed substantial evolution from 2019 to 2033, driven by a confluence of factors including escalating health consciousness, advancements in material technology, and a growing understanding of biomechanical principles. Throughout the historical period (2019-2024), the market experienced a steady growth trajectory, fueled by an increasing prevalence of foot-related ailments such as plantar fasciitis and flat feet. Consumers, both within the Residential segment seeking everyday comfort and pain relief, and the Commercial segment prioritizing performance and injury prevention, demonstrated a rising demand for specialized arch support solutions. The base year, 2025, marks a pivotal point where the market is projected to reach a valuation of approximately $15 billion, with an estimated Compound Annual Growth Rate (CAGR) of 6.8% expected to persist through the forecast period (2025-2033). Technological advancements have been instrumental in this evolution. The integration of 3D scanning and printing technologies has enabled the creation of highly customized arch supports, catering to individual foot anatomies. Brands like FORM and ProThotics have been at the forefront of this innovation, offering bespoke solutions that significantly outperform off-the-shelf products. Furthermore, the development of advanced materials, including responsive foams and carbon fiber composites, has led to lighter, more durable, and performance-enhancing arch supports, particularly beneficial for athletes and active individuals. This has led to a notable increase in the adoption rate of premium arch support products, with an estimated 45% of serious athletes now utilizing specialized orthotics. The shifting consumer demand is also influenced by greater awareness of the long-term benefits of proper foot biomechanics, leading to a proactive approach towards foot health rather than merely reactive treatment of pain. This trend is further bolstered by endorsements from healthcare professionals and a growing body of scientific research supporting the efficacy of arch supports in improving posture, reducing fatigue, and preventing injuries across various applications. The industry's growth trajectory is thus intrinsically linked to its ability to innovate and address the diverse needs of its expanding consumer base.
Leading Regions, Countries, or Segments in Arch Supports
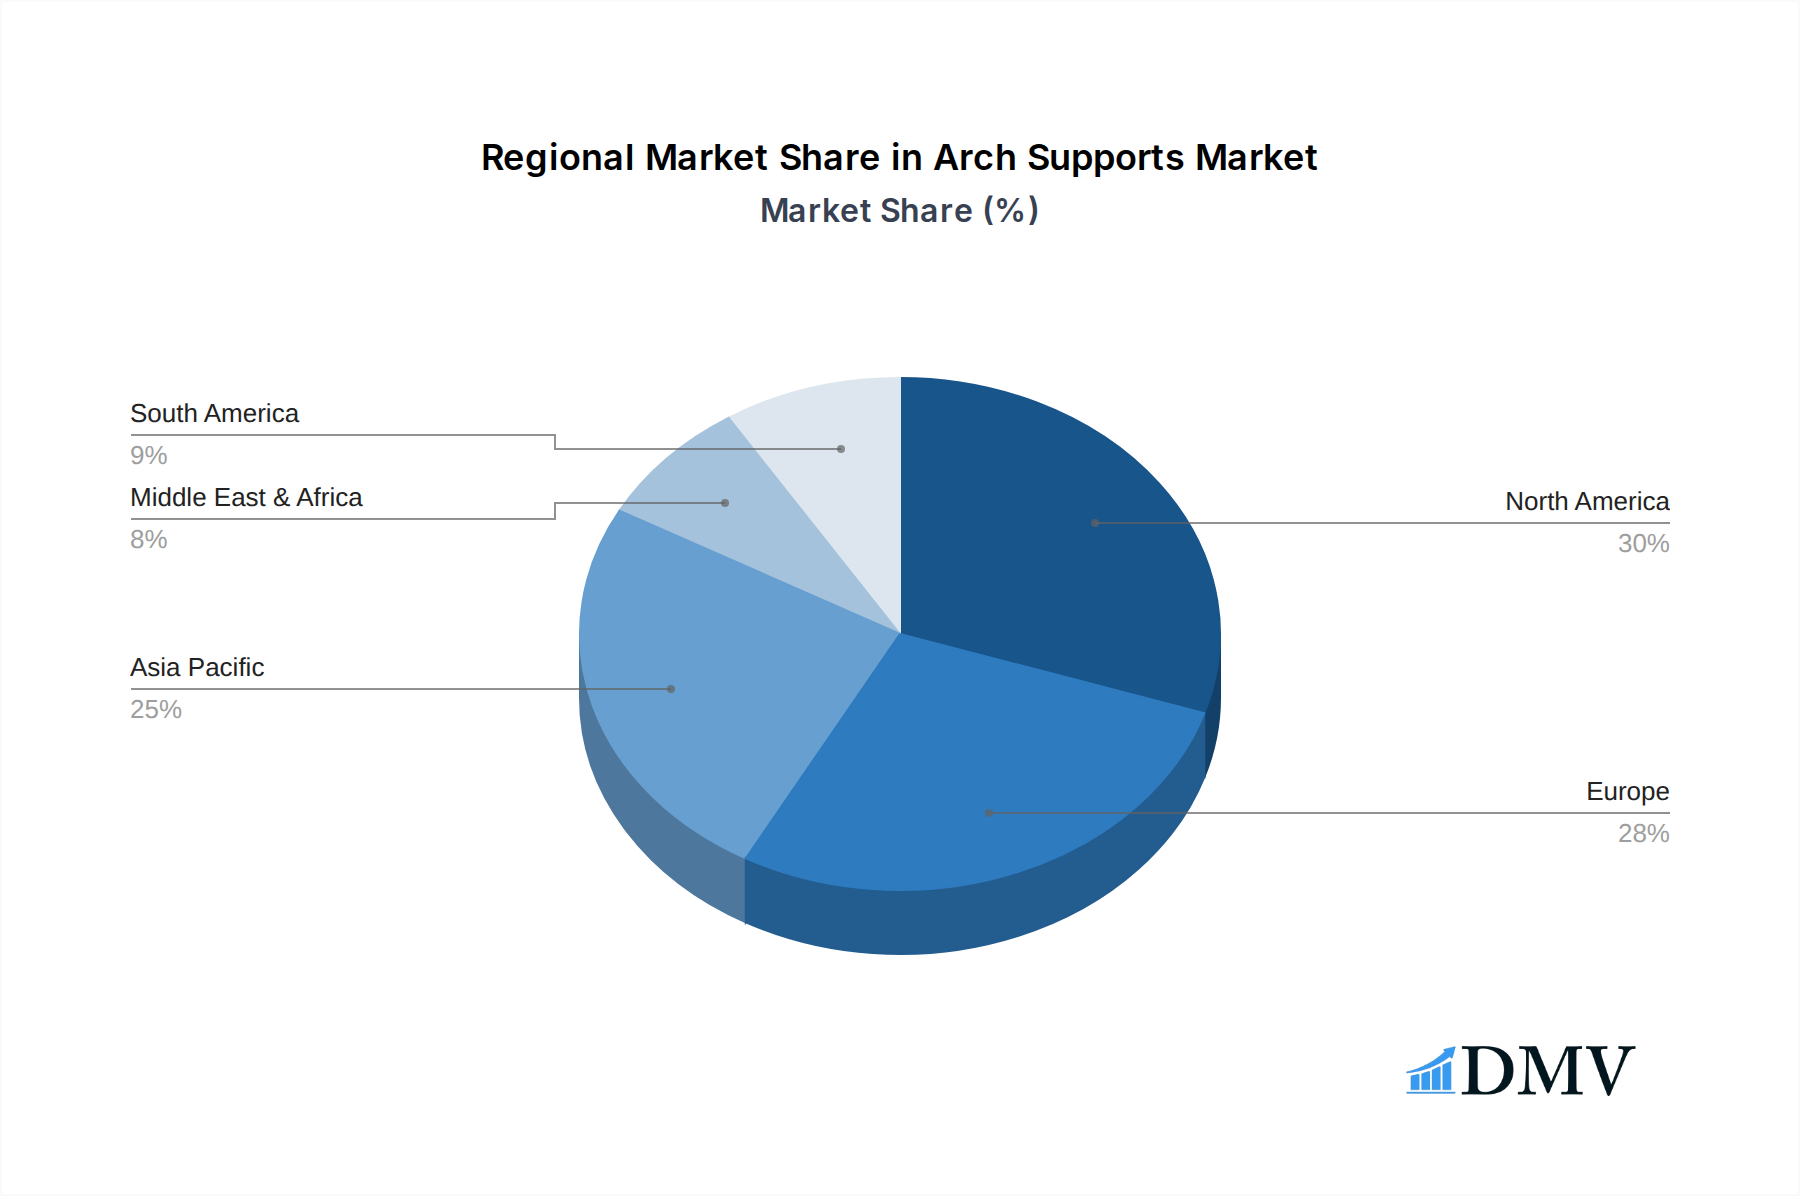
The global Arch Supports market is characterized by significant regional disparities in adoption, driven by a complex interplay of economic factors, healthcare infrastructure, lifestyle trends, and regulatory frameworks. North America currently stands as the dominant region, largely attributable to its robust healthcare expenditure, high consumer awareness regarding foot health, and a mature market for athletic and orthopedic products. Within North America, the United States commands a substantial market share, estimated at 45% of the global market in 2025. This dominance is further amplified by a strong presence of leading manufacturers and distributors, including New Balance, Powerstep, and Spenco. The Commercial application segment within North America is particularly strong, driven by the thriving sports and fitness industry, as well as the increasing adoption of supportive footwear in professional and industrial settings. The Residential segment also remains a significant contributor, propelled by an aging population and a greater emphasis on preventative healthcare and managing chronic foot conditions.
In terms of specific product types, the High Arch segment within North America is experiencing notable growth, reflecting the rising incidence of conditions associated with this foot type and a greater demand for specialized correction. Conversely, the Low Arch segment continues to represent a substantial portion of the market due to its widespread prevalence. Key drivers for North America's leadership include:
- High Disposable Income: Enabling consumers to invest in premium foot health products.
- Advanced Healthcare System: Facilitating access to podiatric care and recommendations for arch supports.
- Prevalence of Foot Conditions: A high incidence of plantar fasciitis, flat feet, and other biomechanical issues.
- Strong Athletic Culture: Driving demand for performance-enhancing orthotics.
- Favorable Regulatory Environment: Supporting the development and marketing of medical devices and wellness products.
The market in Europe also presents a significant opportunity, with countries like Germany and the United Kingdom showing strong adoption rates, particularly in the Residential segment due to an aging demographic and increasing awareness of joint health. Asia Pacific, while currently holding a smaller share, is poised for rapid growth, driven by a burgeoning middle class, increasing urbanization, and a rising focus on fitness and sports participation, especially in countries like China and India. Emerging markets are gradually recognizing the importance of foot health, creating substantial potential for future market expansion.
Arch Supports Product Innovations
Product innovation in the Arch Supports market is rapidly transforming the landscape, with a focus on enhanced comfort, performance, and therapeutic benefits. Manufacturers are leveraging advanced materials like memory foam, gel, and carbon fiber to create lighter, more responsive, and durable insoles. The integration of biomechanical engineering principles has led to the development of scientifically designed supports tailored for specific arch types – Low Arch, High Arch, and neutral – addressing a wider range of consumer needs. For instance, companies are developing 3D-printed custom orthotics that precisely map individual foot contours, offering unparalleled fit and support. Furthermore, the incorporation of antimicrobial technologies and moisture-wicking fabrics is improving hygiene and user experience, particularly in athletic and performance-oriented products. Brands are also exploring smart technologies, with some prototypes integrating pressure sensors to provide gait analysis data.
Propelling Factors for Arch Supports Growth
The growth of the Arch Supports market is propelled by several interconnected factors. A significant driver is the increasing prevalence of foot-related ailments, such as plantar fasciitis and flat feet, directly leading to higher demand for therapeutic arch supports. The growing global emphasis on health and wellness, coupled with a rising participation in sports and fitness activities, further fuels the demand for performance-enhancing orthotics. Technological advancements in material science and manufacturing, including 3D printing for custom orthotics, are creating more effective and personalized solutions. Additionally, an aging global population, more susceptible to foot pain and mobility issues, contributes substantially to market expansion. Favorable regulatory frameworks in many regions that support the development and marketing of orthopedic and wellness products also play a crucial role.
- Rising Foot Ailments: Increased incidence of conditions like plantar fasciitis and flat feet.
- Health and Wellness Trends: Growing consumer focus on proactive health management and physical fitness.
- Technological Advancements: Innovations in materials (e.g., advanced polymers) and manufacturing (e.g., 3D printing).
- Aging Population: Increased susceptibility to foot pain and mobility issues in older demographics.
- Supportive Regulatory Environments: Favorable policies for orthopedic and wellness product development.
Obstacles in the Arch Supports Market
Despite robust growth prospects, the Arch Supports market faces several impediments. A primary challenge is the high cost of premium and custom-made arch supports, which can deter price-sensitive consumers, particularly in emerging economies. Lack of widespread consumer awareness regarding the benefits of specialized arch supports, with many individuals still opting for generic insoles or conventional footwear, also limits market penetration. Stringent regulatory hurdles and approval processes for new medical-grade orthotics can prolong time-to-market and increase development costs. Furthermore, intense competition from established footwear brands offering integrated arch support features and the threat of counterfeit products pose significant challenges to market players seeking to establish and maintain their market share. Supply chain disruptions and the volatility of raw material prices can also impact production costs and availability.
- High Cost of Premium Products: Deterring price-sensitive consumers.
- Limited Consumer Awareness: Many unaware of specialized arch support benefits.
- Regulatory Hurdles: Lengthy approval processes for medical-grade orthotics.
- Intense Competition: From footwear brands and counterfeit products.
- Supply Chain Volatility: Fluctuations in raw material costs and availability.
Future Opportunities in Arch Supports
The Arch Supports market is ripe with future opportunities, driven by evolving consumer needs and technological advancements. The growing demand for personalized and custom orthotics, facilitated by advancements in 3D scanning and printing, presents a significant avenue for growth, especially in catering to niche athletic communities and individuals with complex biomechanical issues. The expansion into emerging markets in Asia Pacific and Latin America, where awareness of foot health is increasing, offers substantial untapped potential. Furthermore, the integration of smart technologies into arch supports, enabling real-time gait analysis and personalized feedback, is an emerging trend with immense future promise. Collaborations between arch support manufacturers and healthcare providers, as well as strategic partnerships with sports apparel brands, can unlock new distribution channels and enhance market reach. The development of specialized arch supports for specific activities, such as running, hiking, and cycling, tailored to the unique biomechanical demands of each, also represents a promising niche.
- Personalized & Custom Orthotics: Leveraging 3D printing and scanning.
- Emerging Market Expansion: Tapping into Asia Pacific and Latin America.
- Smart Arch Supports: Integration of sensors for gait analysis.
- Strategic Partnerships: Collaborations with healthcare and sports brands.
- Niche Product Development: Specialization for specific sports and activities.
Major Players in the Arch Supports Ecosystem
- Archmolds
- Birkenstock
- CurrexSole
- FORM
- Icebug
- New Balance
- Orthaheel
- Pedag
- Powerstep
- ProThotics
- Reebok
- Revitalign
- Sof Sole
- SOLE
- Sorbothane
- Spenco
- Superfeet
- Vionic
Key Developments in Arch Supports Industry
- Q2 2023: Superfeet launched its new line of sustainable, eco-friendly insoles made from recycled materials, impacting market perception around environmental responsibility.
- Q4 2023: CurrexSole partnered with a leading sports science institute to further research biomechanics and develop next-generation athletic arch supports, aiming to enhance performance and injury prevention.
- Q1 2024: FORM introduced advanced 3D scanning technology for its custom orthotics, significantly reducing turnaround time and improving precision for personalized arch support solutions.
- Q3 2024: Vionic expanded its retail presence in the European market, increasing accessibility and brand awareness for its therapeutic footwear and orthotics.
- Q1 2025: Powerstep announced the acquisition of a smaller competitor specializing in diabetic footwear, aiming to broaden its product portfolio and cater to a wider range of medical needs.
- Q2 2025: New Balance unveiled innovative cushioning technologies integrated into their athletic footwear, indirectly impacting the demand for aftermarket arch supports by offering enhanced built-in support.
- Q4 2025: Orthaheel received FDA clearance for a new medical-grade arch support designed for individuals with severe pronation, marking a significant regulatory milestone and therapeutic advancement.
Strategic Arch Supports Market Forecast
The strategic forecast for the Arch Supports market is overwhelmingly positive, driven by an escalating global focus on proactive foot health, the continuous innovation in materials and personalized solutions, and the increasing prevalence of biomechanical foot issues. The integration of smart technologies and the expansion into underserved emerging markets are poised to unlock substantial new revenue streams. The anticipated market growth is underpinned by a synergistic approach where advancements in therapeutic design meet the rising consumer demand for both comfort and performance. Strategic initiatives focusing on consumer education, strategic partnerships with healthcare professionals, and leveraging e-commerce platforms will be crucial for capitalizing on these burgeoning opportunities. The market is expected to witness sustained double-digit growth in specific segments, particularly in custom and technologically advanced arch supports.
Arch Supports Segmentation
-
1. Application
- 1.1. Commercial
- 1.2. Residential
-
2. Types
- 2.1. Low Arch
- 2.2. High Arch
Arch Supports Segmentation By Geography
-
1. North America
- 1.1. United States
- 1.2. Canada
- 1.3. Mexico
-
2. South America
- 2.1. Brazil
- 2.2. Argentina
- 2.3. Rest of South America
-
3. Europe
- 3.1. United Kingdom
- 3.2. Germany
- 3.3. France
- 3.4. Italy
- 3.5. Spain
- 3.6. Russia
- 3.7. Benelux
- 3.8. Nordics
- 3.9. Rest of Europe
-
4. Middle East & Africa
- 4.1. Turkey
- 4.2. Israel
- 4.3. GCC
- 4.4. North Africa
- 4.5. South Africa
- 4.6. Rest of Middle East & Africa
-
5. Asia Pacific
- 5.1. China
- 5.2. India
- 5.3. Japan
- 5.4. South Korea
- 5.5. ASEAN
- 5.6. Oceania
- 5.7. Rest of Asia Pacific
Arch Supports Regional Market Share
Geographic Coverage of Arch Supports
Arch Supports REPORT HIGHLIGHTS
| Aspects | Details |
|---|---|
| Study Period | 2020-2034 |
| Base Year | 2025 |
| Estimated Year | 2026 |
| Forecast Period | 2026-2034 |
| Historical Period | 2020-2025 |
| Growth Rate | CAGR of 7.7% from 2020-2034 |
| Segmentation |
|
Table of Contents
- 1. Introduction
- 1.1. Research Scope
- 1.2. Market Segmentation
- 1.3. Research Objective
- 1.4. Definitions and Assumptions
- 2. Executive Summary
- 2.1. Market Snapshot
- 3. Market Dynamics
- 3.1. Market Drivers
- 3.2. Market Restrains
- 3.3. Market Trends
- 3.4. Market Opportunities
- 4. Market Factor Analysis
- 4.1. Porters Five Forces
- 4.1.1. Bargaining Power of Suppliers
- 4.1.2. Bargaining Power of Buyers
- 4.1.3. Threat of New Entrants
- 4.1.4. Threat of Substitutes
- 4.1.5. Competitive Rivalry
- 4.2. PESTEL analysis
- 4.3. BCG Analysis
- 4.3.1. Stars (High Growth, High Market Share)
- 4.3.2. Cash Cows (Low Growth, High Market Share)
- 4.3.3. Question Mark (High Growth, Low Market Share)
- 4.3.4. Dogs (Low Growth, Low Market Share)
- 4.4. Ansoff Matrix Analysis
- 4.5. Supply Chain Analysis
- 4.6. Regulatory Landscape
- 4.7. Current Market Potential and Opportunity Assessment (TAM–SAM–SOM Framework)
- 4.8. DMV Analyst Note
- 4.1. Porters Five Forces
- 5. Market Analysis, Insights and Forecast 2021-2033
- 5.1. Market Analysis, Insights and Forecast - by Application
- 5.1.1. Commercial
- 5.1.2. Residential
- 5.2. Market Analysis, Insights and Forecast - by Types
- 5.2.1. Low Arch
- 5.2.2. High Arch
- 5.3. Market Analysis, Insights and Forecast - by Region
- 5.3.1. North America
- 5.3.2. South America
- 5.3.3. Europe
- 5.3.4. Middle East & Africa
- 5.3.5. Asia Pacific
- 5.1. Market Analysis, Insights and Forecast - by Application
- 6. Global Arch Supports Analysis, Insights and Forecast, 2021-2033
- 6.1. Market Analysis, Insights and Forecast - by Application
- 6.1.1. Commercial
- 6.1.2. Residential
- 6.2. Market Analysis, Insights and Forecast - by Types
- 6.2.1. Low Arch
- 6.2.2. High Arch
- 6.1. Market Analysis, Insights and Forecast - by Application
- 7. North America Arch Supports Analysis, Insights and Forecast, 2020-2032
- 7.1. Market Analysis, Insights and Forecast - by Application
- 7.1.1. Commercial
- 7.1.2. Residential
- 7.2. Market Analysis, Insights and Forecast - by Types
- 7.2.1. Low Arch
- 7.2.2. High Arch
- 7.1. Market Analysis, Insights and Forecast - by Application
- 8. South America Arch Supports Analysis, Insights and Forecast, 2020-2032
- 8.1. Market Analysis, Insights and Forecast - by Application
- 8.1.1. Commercial
- 8.1.2. Residential
- 8.2. Market Analysis, Insights and Forecast - by Types
- 8.2.1. Low Arch
- 8.2.2. High Arch
- 8.1. Market Analysis, Insights and Forecast - by Application
- 9. Europe Arch Supports Analysis, Insights and Forecast, 2020-2032
- 9.1. Market Analysis, Insights and Forecast - by Application
- 9.1.1. Commercial
- 9.1.2. Residential
- 9.2. Market Analysis, Insights and Forecast - by Types
- 9.2.1. Low Arch
- 9.2.2. High Arch
- 9.1. Market Analysis, Insights and Forecast - by Application
- 10. Middle East & Africa Arch Supports Analysis, Insights and Forecast, 2020-2032
- 10.1. Market Analysis, Insights and Forecast - by Application
- 10.1.1. Commercial
- 10.1.2. Residential
- 10.2. Market Analysis, Insights and Forecast - by Types
- 10.2.1. Low Arch
- 10.2.2. High Arch
- 10.1. Market Analysis, Insights and Forecast - by Application
- 11. Asia Pacific Arch Supports Analysis, Insights and Forecast, 2020-2032
- 11.1. Market Analysis, Insights and Forecast - by Application
- 11.1.1. Commercial
- 11.1.2. Residential
- 11.2. Market Analysis, Insights and Forecast - by Types
- 11.2.1. Low Arch
- 11.2.2. High Arch
- 11.1. Market Analysis, Insights and Forecast - by Application
- 12. Competitive Analysis
- 12.1. Company Profiles
- 12.1.1 Archmolds
- 12.1.1.1. Company Overview
- 12.1.1.2. Products
- 12.1.1.3. Company Financials
- 12.1.1.4. SWOT Analysis
- 12.1.2 Birkenstock
- 12.1.2.1. Company Overview
- 12.1.2.2. Products
- 12.1.2.3. Company Financials
- 12.1.2.4. SWOT Analysis
- 12.1.3 CurrexSole
- 12.1.3.1. Company Overview
- 12.1.3.2. Products
- 12.1.3.3. Company Financials
- 12.1.3.4. SWOT Analysis
- 12.1.4 FORM
- 12.1.4.1. Company Overview
- 12.1.4.2. Products
- 12.1.4.3. Company Financials
- 12.1.4.4. SWOT Analysis
- 12.1.5 Icebug
- 12.1.5.1. Company Overview
- 12.1.5.2. Products
- 12.1.5.3. Company Financials
- 12.1.5.4. SWOT Analysis
- 12.1.6 New Balance
- 12.1.6.1. Company Overview
- 12.1.6.2. Products
- 12.1.6.3. Company Financials
- 12.1.6.4. SWOT Analysis
- 12.1.7 Orthaheel
- 12.1.7.1. Company Overview
- 12.1.7.2. Products
- 12.1.7.3. Company Financials
- 12.1.7.4. SWOT Analysis
- 12.1.8 Pedag
- 12.1.8.1. Company Overview
- 12.1.8.2. Products
- 12.1.8.3. Company Financials
- 12.1.8.4. SWOT Analysis
- 12.1.9 Powerstep
- 12.1.9.1. Company Overview
- 12.1.9.2. Products
- 12.1.9.3. Company Financials
- 12.1.9.4. SWOT Analysis
- 12.1.10 ProThotics
- 12.1.10.1. Company Overview
- 12.1.10.2. Products
- 12.1.10.3. Company Financials
- 12.1.10.4. SWOT Analysis
- 12.1.11 Reebok
- 12.1.11.1. Company Overview
- 12.1.11.2. Products
- 12.1.11.3. Company Financials
- 12.1.11.4. SWOT Analysis
- 12.1.12 Revitalign
- 12.1.12.1. Company Overview
- 12.1.12.2. Products
- 12.1.12.3. Company Financials
- 12.1.12.4. SWOT Analysis
- 12.1.13 Sof Sole
- 12.1.13.1. Company Overview
- 12.1.13.2. Products
- 12.1.13.3. Company Financials
- 12.1.13.4. SWOT Analysis
- 12.1.14 SOLE
- 12.1.14.1. Company Overview
- 12.1.14.2. Products
- 12.1.14.3. Company Financials
- 12.1.14.4. SWOT Analysis
- 12.1.15 Sorbothane
- 12.1.15.1. Company Overview
- 12.1.15.2. Products
- 12.1.15.3. Company Financials
- 12.1.15.4. SWOT Analysis
- 12.1.16 Spenco
- 12.1.16.1. Company Overview
- 12.1.16.2. Products
- 12.1.16.3. Company Financials
- 12.1.16.4. SWOT Analysis
- 12.1.17 Superfeet
- 12.1.17.1. Company Overview
- 12.1.17.2. Products
- 12.1.17.3. Company Financials
- 12.1.17.4. SWOT Analysis
- 12.1.18 Vionic
- 12.1.18.1. Company Overview
- 12.1.18.2. Products
- 12.1.18.3. Company Financials
- 12.1.18.4. SWOT Analysis
- 12.1.1 Archmolds
- 12.2. Market Entropy
- 12.2.1 Company's Key Areas Served
- 12.2.2 Recent Developments
- 12.3. Company Market Share Analysis 2025
- 12.3.1 Top 5 Companies Market Share Analysis
- 12.3.2 Top 3 Companies Market Share Analysis
- 12.4. List of Potential Customers
- 13. Research Methodology
List of Figures
- Figure 1: Global Arch Supports Revenue Breakdown (undefined, %) by Region 2025 & 2033
- Figure 2: Global Arch Supports Volume Breakdown (K, %) by Region 2025 & 2033
- Figure 3: North America Arch Supports Revenue (undefined), by Application 2025 & 2033
- Figure 4: North America Arch Supports Volume (K), by Application 2025 & 2033
- Figure 5: North America Arch Supports Revenue Share (%), by Application 2025 & 2033
- Figure 6: North America Arch Supports Volume Share (%), by Application 2025 & 2033
- Figure 7: North America Arch Supports Revenue (undefined), by Types 2025 & 2033
- Figure 8: North America Arch Supports Volume (K), by Types 2025 & 2033
- Figure 9: North America Arch Supports Revenue Share (%), by Types 2025 & 2033
- Figure 10: North America Arch Supports Volume Share (%), by Types 2025 & 2033
- Figure 11: North America Arch Supports Revenue (undefined), by Country 2025 & 2033
- Figure 12: North America Arch Supports Volume (K), by Country 2025 & 2033
- Figure 13: North America Arch Supports Revenue Share (%), by Country 2025 & 2033
- Figure 14: North America Arch Supports Volume Share (%), by Country 2025 & 2033
- Figure 15: South America Arch Supports Revenue (undefined), by Application 2025 & 2033
- Figure 16: South America Arch Supports Volume (K), by Application 2025 & 2033
- Figure 17: South America Arch Supports Revenue Share (%), by Application 2025 & 2033
- Figure 18: South America Arch Supports Volume Share (%), by Application 2025 & 2033
- Figure 19: South America Arch Supports Revenue (undefined), by Types 2025 & 2033
- Figure 20: South America Arch Supports Volume (K), by Types 2025 & 2033
- Figure 21: South America Arch Supports Revenue Share (%), by Types 2025 & 2033
- Figure 22: South America Arch Supports Volume Share (%), by Types 2025 & 2033
- Figure 23: South America Arch Supports Revenue (undefined), by Country 2025 & 2033
- Figure 24: South America Arch Supports Volume (K), by Country 2025 & 2033
- Figure 25: South America Arch Supports Revenue Share (%), by Country 2025 & 2033
- Figure 26: South America Arch Supports Volume Share (%), by Country 2025 & 2033
- Figure 27: Europe Arch Supports Revenue (undefined), by Application 2025 & 2033
- Figure 28: Europe Arch Supports Volume (K), by Application 2025 & 2033
- Figure 29: Europe Arch Supports Revenue Share (%), by Application 2025 & 2033
- Figure 30: Europe Arch Supports Volume Share (%), by Application 2025 & 2033
- Figure 31: Europe Arch Supports Revenue (undefined), by Types 2025 & 2033
- Figure 32: Europe Arch Supports Volume (K), by Types 2025 & 2033
- Figure 33: Europe Arch Supports Revenue Share (%), by Types 2025 & 2033
- Figure 34: Europe Arch Supports Volume Share (%), by Types 2025 & 2033
- Figure 35: Europe Arch Supports Revenue (undefined), by Country 2025 & 2033
- Figure 36: Europe Arch Supports Volume (K), by Country 2025 & 2033
- Figure 37: Europe Arch Supports Revenue Share (%), by Country 2025 & 2033
- Figure 38: Europe Arch Supports Volume Share (%), by Country 2025 & 2033
- Figure 39: Middle East & Africa Arch Supports Revenue (undefined), by Application 2025 & 2033
- Figure 40: Middle East & Africa Arch Supports Volume (K), by Application 2025 & 2033
- Figure 41: Middle East & Africa Arch Supports Revenue Share (%), by Application 2025 & 2033
- Figure 42: Middle East & Africa Arch Supports Volume Share (%), by Application 2025 & 2033
- Figure 43: Middle East & Africa Arch Supports Revenue (undefined), by Types 2025 & 2033
- Figure 44: Middle East & Africa Arch Supports Volume (K), by Types 2025 & 2033
- Figure 45: Middle East & Africa Arch Supports Revenue Share (%), by Types 2025 & 2033
- Figure 46: Middle East & Africa Arch Supports Volume Share (%), by Types 2025 & 2033
- Figure 47: Middle East & Africa Arch Supports Revenue (undefined), by Country 2025 & 2033
- Figure 48: Middle East & Africa Arch Supports Volume (K), by Country 2025 & 2033
- Figure 49: Middle East & Africa Arch Supports Revenue Share (%), by Country 2025 & 2033
- Figure 50: Middle East & Africa Arch Supports Volume Share (%), by Country 2025 & 2033
- Figure 51: Asia Pacific Arch Supports Revenue (undefined), by Application 2025 & 2033
- Figure 52: Asia Pacific Arch Supports Volume (K), by Application 2025 & 2033
- Figure 53: Asia Pacific Arch Supports Revenue Share (%), by Application 2025 & 2033
- Figure 54: Asia Pacific Arch Supports Volume Share (%), by Application 2025 & 2033
- Figure 55: Asia Pacific Arch Supports Revenue (undefined), by Types 2025 & 2033
- Figure 56: Asia Pacific Arch Supports Volume (K), by Types 2025 & 2033
- Figure 57: Asia Pacific Arch Supports Revenue Share (%), by Types 2025 & 2033
- Figure 58: Asia Pacific Arch Supports Volume Share (%), by Types 2025 & 2033
- Figure 59: Asia Pacific Arch Supports Revenue (undefined), by Country 2025 & 2033
- Figure 60: Asia Pacific Arch Supports Volume (K), by Country 2025 & 2033
- Figure 61: Asia Pacific Arch Supports Revenue Share (%), by Country 2025 & 2033
- Figure 62: Asia Pacific Arch Supports Volume Share (%), by Country 2025 & 2033
List of Tables
- Table 1: Global Arch Supports Revenue undefined Forecast, by Application 2020 & 2033
- Table 2: Global Arch Supports Volume K Forecast, by Application 2020 & 2033
- Table 3: Global Arch Supports Revenue undefined Forecast, by Types 2020 & 2033
- Table 4: Global Arch Supports Volume K Forecast, by Types 2020 & 2033
- Table 5: Global Arch Supports Revenue undefined Forecast, by Region 2020 & 2033
- Table 6: Global Arch Supports Volume K Forecast, by Region 2020 & 2033
- Table 7: Global Arch Supports Revenue undefined Forecast, by Application 2020 & 2033
- Table 8: Global Arch Supports Volume K Forecast, by Application 2020 & 2033
- Table 9: Global Arch Supports Revenue undefined Forecast, by Types 2020 & 2033
- Table 10: Global Arch Supports Volume K Forecast, by Types 2020 & 2033
- Table 11: Global Arch Supports Revenue undefined Forecast, by Country 2020 & 2033
- Table 12: Global Arch Supports Volume K Forecast, by Country 2020 & 2033
- Table 13: United States Arch Supports Revenue (undefined) Forecast, by Application 2020 & 2033
- Table 14: United States Arch Supports Volume (K) Forecast, by Application 2020 & 2033
- Table 15: Canada Arch Supports Revenue (undefined) Forecast, by Application 2020 & 2033
- Table 16: Canada Arch Supports Volume (K) Forecast, by Application 2020 & 2033
- Table 17: Mexico Arch Supports Revenue (undefined) Forecast, by Application 2020 & 2033
- Table 18: Mexico Arch Supports Volume (K) Forecast, by Application 2020 & 2033
- Table 19: Global Arch Supports Revenue undefined Forecast, by Application 2020 & 2033
- Table 20: Global Arch Supports Volume K Forecast, by Application 2020 & 2033
- Table 21: Global Arch Supports Revenue undefined Forecast, by Types 2020 & 2033
- Table 22: Global Arch Supports Volume K Forecast, by Types 2020 & 2033
- Table 23: Global Arch Supports Revenue undefined Forecast, by Country 2020 & 2033
- Table 24: Global Arch Supports Volume K Forecast, by Country 2020 & 2033
- Table 25: Brazil Arch Supports Revenue (undefined) Forecast, by Application 2020 & 2033
- Table 26: Brazil Arch Supports Volume (K) Forecast, by Application 2020 & 2033
- Table 27: Argentina Arch Supports Revenue (undefined) Forecast, by Application 2020 & 2033
- Table 28: Argentina Arch Supports Volume (K) Forecast, by Application 2020 & 2033
- Table 29: Rest of South America Arch Supports Revenue (undefined) Forecast, by Application 2020 & 2033
- Table 30: Rest of South America Arch Supports Volume (K) Forecast, by Application 2020 & 2033
- Table 31: Global Arch Supports Revenue undefined Forecast, by Application 2020 & 2033
- Table 32: Global Arch Supports Volume K Forecast, by Application 2020 & 2033
- Table 33: Global Arch Supports Revenue undefined Forecast, by Types 2020 & 2033
- Table 34: Global Arch Supports Volume K Forecast, by Types 2020 & 2033
- Table 35: Global Arch Supports Revenue undefined Forecast, by Country 2020 & 2033
- Table 36: Global Arch Supports Volume K Forecast, by Country 2020 & 2033
- Table 37: United Kingdom Arch Supports Revenue (undefined) Forecast, by Application 2020 & 2033
- Table 38: United Kingdom Arch Supports Volume (K) Forecast, by Application 2020 & 2033
- Table 39: Germany Arch Supports Revenue (undefined) Forecast, by Application 2020 & 2033
- Table 40: Germany Arch Supports Volume (K) Forecast, by Application 2020 & 2033
- Table 41: France Arch Supports Revenue (undefined) Forecast, by Application 2020 & 2033
- Table 42: France Arch Supports Volume (K) Forecast, by Application 2020 & 2033
- Table 43: Italy Arch Supports Revenue (undefined) Forecast, by Application 2020 & 2033
- Table 44: Italy Arch Supports Volume (K) Forecast, by Application 2020 & 2033
- Table 45: Spain Arch Supports Revenue (undefined) Forecast, by Application 2020 & 2033
- Table 46: Spain Arch Supports Volume (K) Forecast, by Application 2020 & 2033
- Table 47: Russia Arch Supports Revenue (undefined) Forecast, by Application 2020 & 2033
- Table 48: Russia Arch Supports Volume (K) Forecast, by Application 2020 & 2033
- Table 49: Benelux Arch Supports Revenue (undefined) Forecast, by Application 2020 & 2033
- Table 50: Benelux Arch Supports Volume (K) Forecast, by Application 2020 & 2033
- Table 51: Nordics Arch Supports Revenue (undefined) Forecast, by Application 2020 & 2033
- Table 52: Nordics Arch Supports Volume (K) Forecast, by Application 2020 & 2033
- Table 53: Rest of Europe Arch Supports Revenue (undefined) Forecast, by Application 2020 & 2033
- Table 54: Rest of Europe Arch Supports Volume (K) Forecast, by Application 2020 & 2033
- Table 55: Global Arch Supports Revenue undefined Forecast, by Application 2020 & 2033
- Table 56: Global Arch Supports Volume K Forecast, by Application 2020 & 2033
- Table 57: Global Arch Supports Revenue undefined Forecast, by Types 2020 & 2033
- Table 58: Global Arch Supports Volume K Forecast, by Types 2020 & 2033
- Table 59: Global Arch Supports Revenue undefined Forecast, by Country 2020 & 2033
- Table 60: Global Arch Supports Volume K Forecast, by Country 2020 & 2033
- Table 61: Turkey Arch Supports Revenue (undefined) Forecast, by Application 2020 & 2033
- Table 62: Turkey Arch Supports Volume (K) Forecast, by Application 2020 & 2033
- Table 63: Israel Arch Supports Revenue (undefined) Forecast, by Application 2020 & 2033
- Table 64: Israel Arch Supports Volume (K) Forecast, by Application 2020 & 2033
- Table 65: GCC Arch Supports Revenue (undefined) Forecast, by Application 2020 & 2033
- Table 66: GCC Arch Supports Volume (K) Forecast, by Application 2020 & 2033
- Table 67: North Africa Arch Supports Revenue (undefined) Forecast, by Application 2020 & 2033
- Table 68: North Africa Arch Supports Volume (K) Forecast, by Application 2020 & 2033
- Table 69: South Africa Arch Supports Revenue (undefined) Forecast, by Application 2020 & 2033
- Table 70: South Africa Arch Supports Volume (K) Forecast, by Application 2020 & 2033
- Table 71: Rest of Middle East & Africa Arch Supports Revenue (undefined) Forecast, by Application 2020 & 2033
- Table 72: Rest of Middle East & Africa Arch Supports Volume (K) Forecast, by Application 2020 & 2033
- Table 73: Global Arch Supports Revenue undefined Forecast, by Application 2020 & 2033
- Table 74: Global Arch Supports Volume K Forecast, by Application 2020 & 2033
- Table 75: Global Arch Supports Revenue undefined Forecast, by Types 2020 & 2033
- Table 76: Global Arch Supports Volume K Forecast, by Types 2020 & 2033
- Table 77: Global Arch Supports Revenue undefined Forecast, by Country 2020 & 2033
- Table 78: Global Arch Supports Volume K Forecast, by Country 2020 & 2033
- Table 79: China Arch Supports Revenue (undefined) Forecast, by Application 2020 & 2033
- Table 80: China Arch Supports Volume (K) Forecast, by Application 2020 & 2033
- Table 81: India Arch Supports Revenue (undefined) Forecast, by Application 2020 & 2033
- Table 82: India Arch Supports Volume (K) Forecast, by Application 2020 & 2033
- Table 83: Japan Arch Supports Revenue (undefined) Forecast, by Application 2020 & 2033
- Table 84: Japan Arch Supports Volume (K) Forecast, by Application 2020 & 2033
- Table 85: South Korea Arch Supports Revenue (undefined) Forecast, by Application 2020 & 2033
- Table 86: South Korea Arch Supports Volume (K) Forecast, by Application 2020 & 2033
- Table 87: ASEAN Arch Supports Revenue (undefined) Forecast, by Application 2020 & 2033
- Table 88: ASEAN Arch Supports Volume (K) Forecast, by Application 2020 & 2033
- Table 89: Oceania Arch Supports Revenue (undefined) Forecast, by Application 2020 & 2033
- Table 90: Oceania Arch Supports Volume (K) Forecast, by Application 2020 & 2033
- Table 91: Rest of Asia Pacific Arch Supports Revenue (undefined) Forecast, by Application 2020 & 2033
- Table 92: Rest of Asia Pacific Arch Supports Volume (K) Forecast, by Application 2020 & 2033
Frequently Asked Questions
1. What is the projected Compound Annual Growth Rate (CAGR) of the Arch Supports?
The projected CAGR is approximately 7.7%.
2. Which companies are prominent players in the Arch Supports?
Key companies in the market include Archmolds, Birkenstock, CurrexSole, FORM, Icebug, New Balance, Orthaheel, Pedag, Powerstep, ProThotics, Reebok, Revitalign, Sof Sole, SOLE, Sorbothane, Spenco, Superfeet, Vionic.
3. What are the main segments of the Arch Supports?
The market segments include Application, Types.
4. Can you provide details about the market size?
The market size is estimated to be USD XXX N/A as of 2022.
5. What are some drivers contributing to market growth?
N/A
6. What are the notable trends driving market growth?
N/A
7. Are there any restraints impacting market growth?
N/A
8. Can you provide examples of recent developments in the market?
N/A
9. What pricing options are available for accessing the report?
Pricing options include single-user, multi-user, and enterprise licenses priced at USD 3350.00, USD 5025.00, and USD 6700.00 respectively.
10. Is the market size provided in terms of value or volume?
The market size is provided in terms of value, measured in N/A and volume, measured in K.
11. Are there any specific market keywords associated with the report?
Yes, the market keyword associated with the report is "Arch Supports," which aids in identifying and referencing the specific market segment covered.
12. How do I determine which pricing option suits my needs best?
The pricing options vary based on user requirements and access needs. Individual users may opt for single-user licenses, while businesses requiring broader access may choose multi-user or enterprise licenses for cost-effective access to the report.
13. Are there any additional resources or data provided in the Arch Supports report?
While the report offers comprehensive insights, it's advisable to review the specific contents or supplementary materials provided to ascertain if additional resources or data are available.
14. How can I stay updated on further developments or reports in the Arch Supports?
To stay informed about further developments, trends, and reports in the Arch Supports, consider subscribing to industry newsletters, following relevant companies and organizations, or regularly checking reputable industry news sources and publications.
Methodology
Step 1 - Identification of Relevant Samples Size from Population Database


Step 2 - Approaches for Defining Global Market Size (Value, Volume* & Price*)

Note*: In applicable scenarios
Step 3 - Data Sources
Primary Research
- Web Analytics
- Survey Reports
- Research Institute
- Latest Research Reports
- Opinion Leaders
Secondary Research
- Annual Reports
- White Paper
- Latest Press Release
- Industry Association
- Paid Database
- Investor Presentations

Step 4 - Data Triangulation
Involves using different sources of information in order to increase the validity of a study
These sources are likely to be stakeholders in a program - participants, other researchers, program staff, other community members, and so on.
Then we put all data in single framework & apply various statistical tools to find out the dynamic on the market.
During the analysis stage, feedback from the stakeholder groups would be compared to determine areas of agreement as well as areas of divergence