

Key Insights
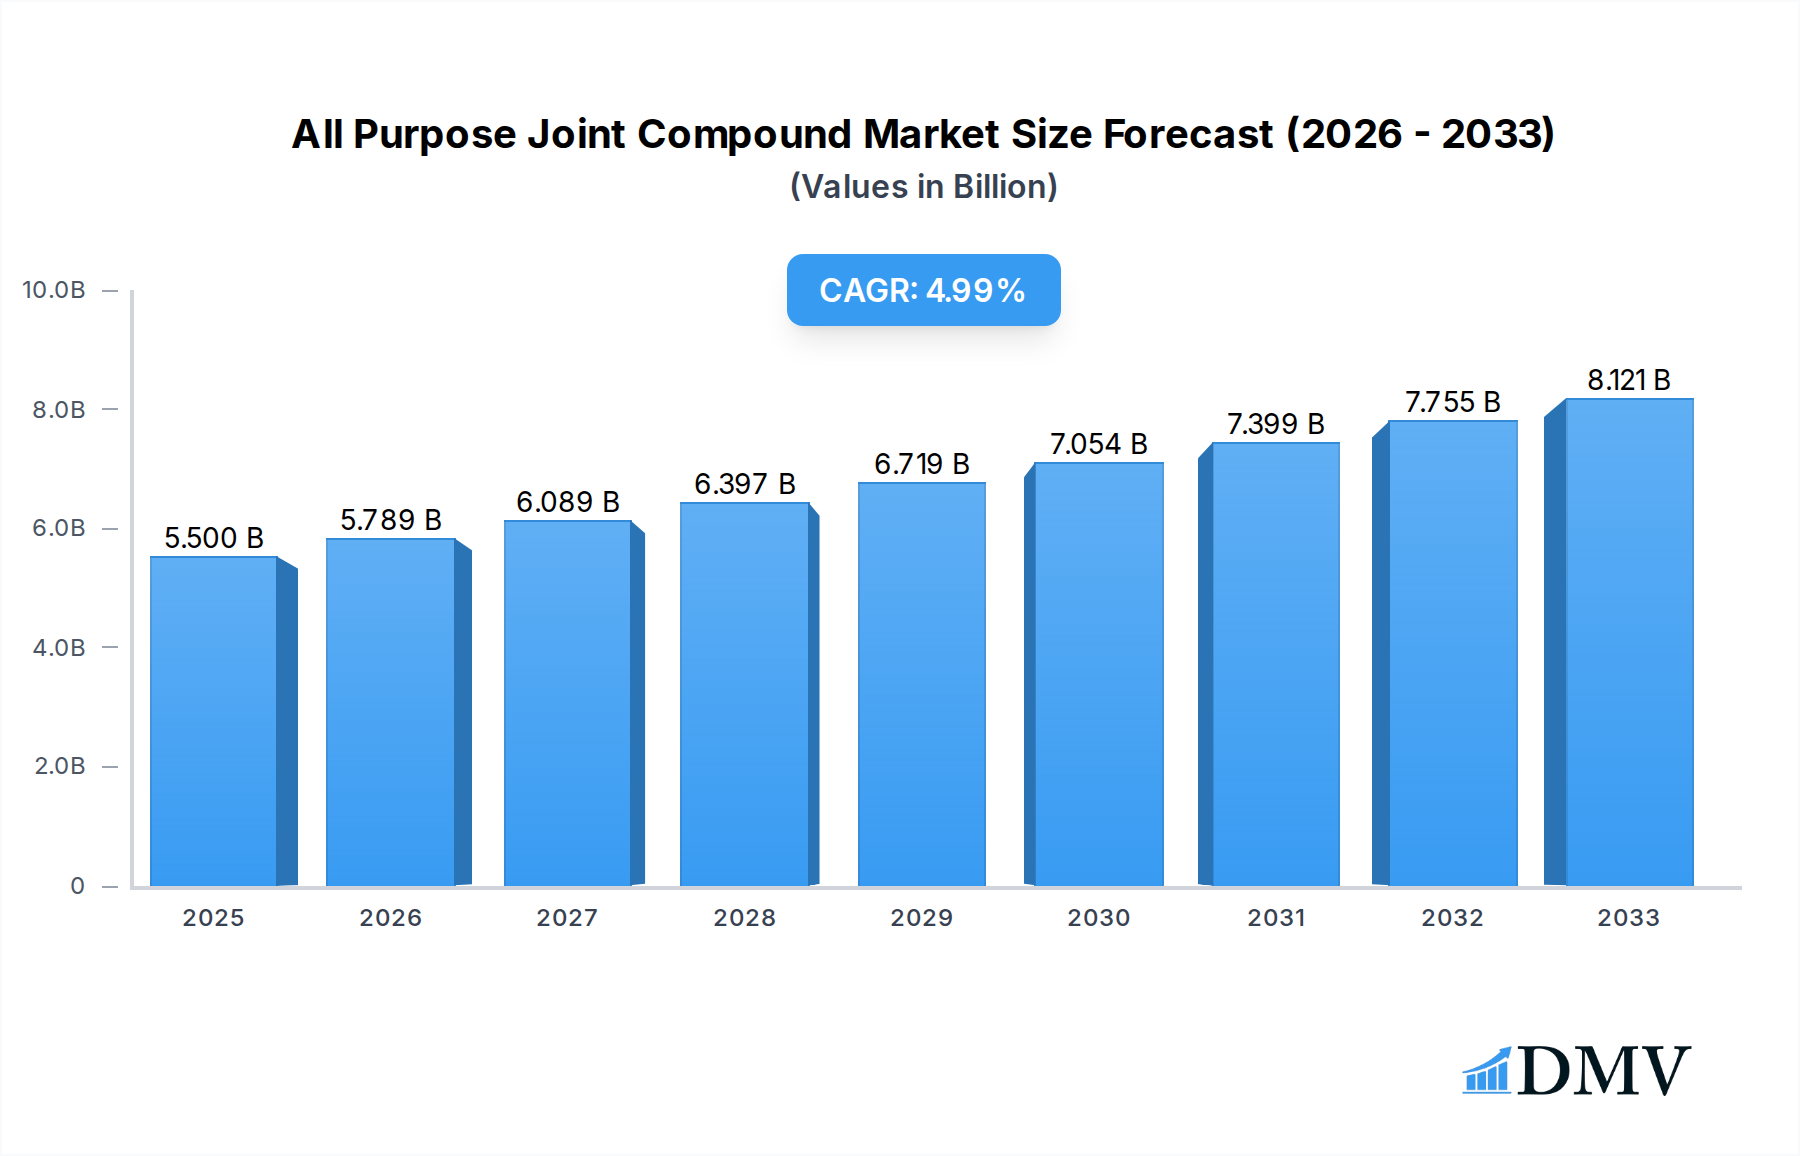
The global All Purpose Joint Compound market is poised for robust expansion, projected to reach a significant valuation of USD 5.5 billion in 2025. This growth is underpinned by a healthy Compound Annual Growth Rate (CAGR) of 5.2% throughout the forecast period of 2025-2033. This steady upward trajectory is primarily fueled by the increasing demand across residential, commercial, and industrial applications, driven by new construction projects and extensive renovation activities worldwide. The compound's versatility in patching, repairing, and finishing drywall makes it an indispensable material in modern construction and remodeling. Furthermore, the growing emphasis on interior aesthetics and the demand for seamless finishes in both new builds and retrofitting projects will continue to propel market growth. The shift towards ready-mix formulations, offering convenience and ease of application, is also a key trend contributing to market dynamism.

All Purpose Joint Compound Market Size (In Billion)
Despite the promising outlook, the market faces certain restraints. The volatile prices of raw materials, coupled with the energy-intensive manufacturing processes, can impact profitability and influence pricing strategies for manufacturers. Additionally, the availability of alternative finishing solutions and the ongoing development of newer, potentially more sustainable materials could present competitive challenges. However, the inherent cost-effectiveness and proven performance of all-purpose joint compound are expected to maintain its strong market position. Key players in the market are focusing on product innovation, expanding their distribution networks, and exploring sustainable manufacturing practices to maintain a competitive edge and capitalize on the growing opportunities in both developed and emerging economies, particularly within the Asia Pacific region.
All Purpose Joint Compound Company Market Share
All Purpose Joint Compound Market Composition & Trends
This comprehensive report delves into the intricate market composition and evolving trends of the All Purpose Joint Compound industry, offering a panoramic view of its dynamics from 2019 to 2033. The market, currently valued at approximately 5 billion, is characterized by a moderate concentration with key players like Knauf, National Gypsum (ProForm), Georgia-Pacific, and Saint-Gobain holding significant market shares. Innovation remains a critical catalyst, driven by the demand for faster application times, reduced dust, and improved workability. Regulatory landscapes, particularly concerning VOC emissions and safety standards, are progressively shaping product development and market entry strategies. Substitute products, such as pre-mixed skim coats and sprayable plasters, present a growing challenge, necessitating continuous product enhancement and competitive pricing. End-user profiles are diverse, spanning the Residential sector, where DIY enthusiasts and professional remodelers dominate, to the Commercial segment focusing on new constructions and renovations, and the Industrial sector, requiring specialized high-performance compounds. Mergers and acquisitions (M&A) activity, with estimated deal values in the hundreds of millions of dollars, continue to consolidate the market, aiming for economies of scale and expanded market reach. The study anticipates a compound annual growth rate (CAGR) of approximately 4.5% during the forecast period.
All Purpose Joint Compound Industry Evolution
The All Purpose Joint Compound industry has witnessed a significant evolutionary trajectory over the study period (2019–2033), marked by sustained growth and transformative advancements. The base year of 2025 positions the market at an estimated value of 5 billion, with projections indicating a robust expansion to over 7 billion by 2033. This growth trajectory is underpinned by several key factors. Firstly, the persistent demand from the construction sector, both for new builds and extensive renovation projects across Residential, Commercial, and Industrial applications, continues to be a primary engine. The ease of use and cost-effectiveness of all-purpose joint compound make it an indispensable material in drywall finishing.
Technological advancements have played a pivotal role in shaping the industry's evolution. Manufacturers have invested heavily in research and development to create lighter formulations, significantly reducing material weight and thereby lowering transportation costs and improving ease of handling for workers. The introduction of low-VOC (Volatile Organic Compound) and no-VOC formulations has been a direct response to increasing environmental awareness and stricter regulatory mandates, enhancing product appeal and ensuring compliance. Furthermore, innovations in "fast-setting" and "quick-drying" compounds have dramatically improved application efficiency, enabling contractors to complete projects faster and reduce labor costs. The adoption rate of these advanced formulations has been consistently high, especially in professional settings where time is a critical factor.
Shifting consumer demands have also significantly influenced the industry's evolution. Homeowners and builders are increasingly prioritizing products that offer superior performance, durability, and aesthetic appeal, while also being environmentally responsible. This has led to a greater demand for compounds that are not only easy to apply but also provide a smoother finish, require less sanding, and are resistant to cracking and shrinkage. The rise of the DIY market has further propelled the demand for user-friendly products, with clear instructions and minimal risk of application errors. The report estimates that the Ready Mix segment will continue to dominate, accounting for over 70% of the market share, due to its convenience and widespread availability. However, the Lightweight segment is expected to witness a higher CAGR of approximately 5.2%, driven by the aforementioned benefits. Overall, the industry's evolution is a testament to its adaptability and responsiveness to market forces and technological innovation, ensuring its continued relevance and growth.
Leading Regions, Countries, or Segments in All Purpose Joint Compound
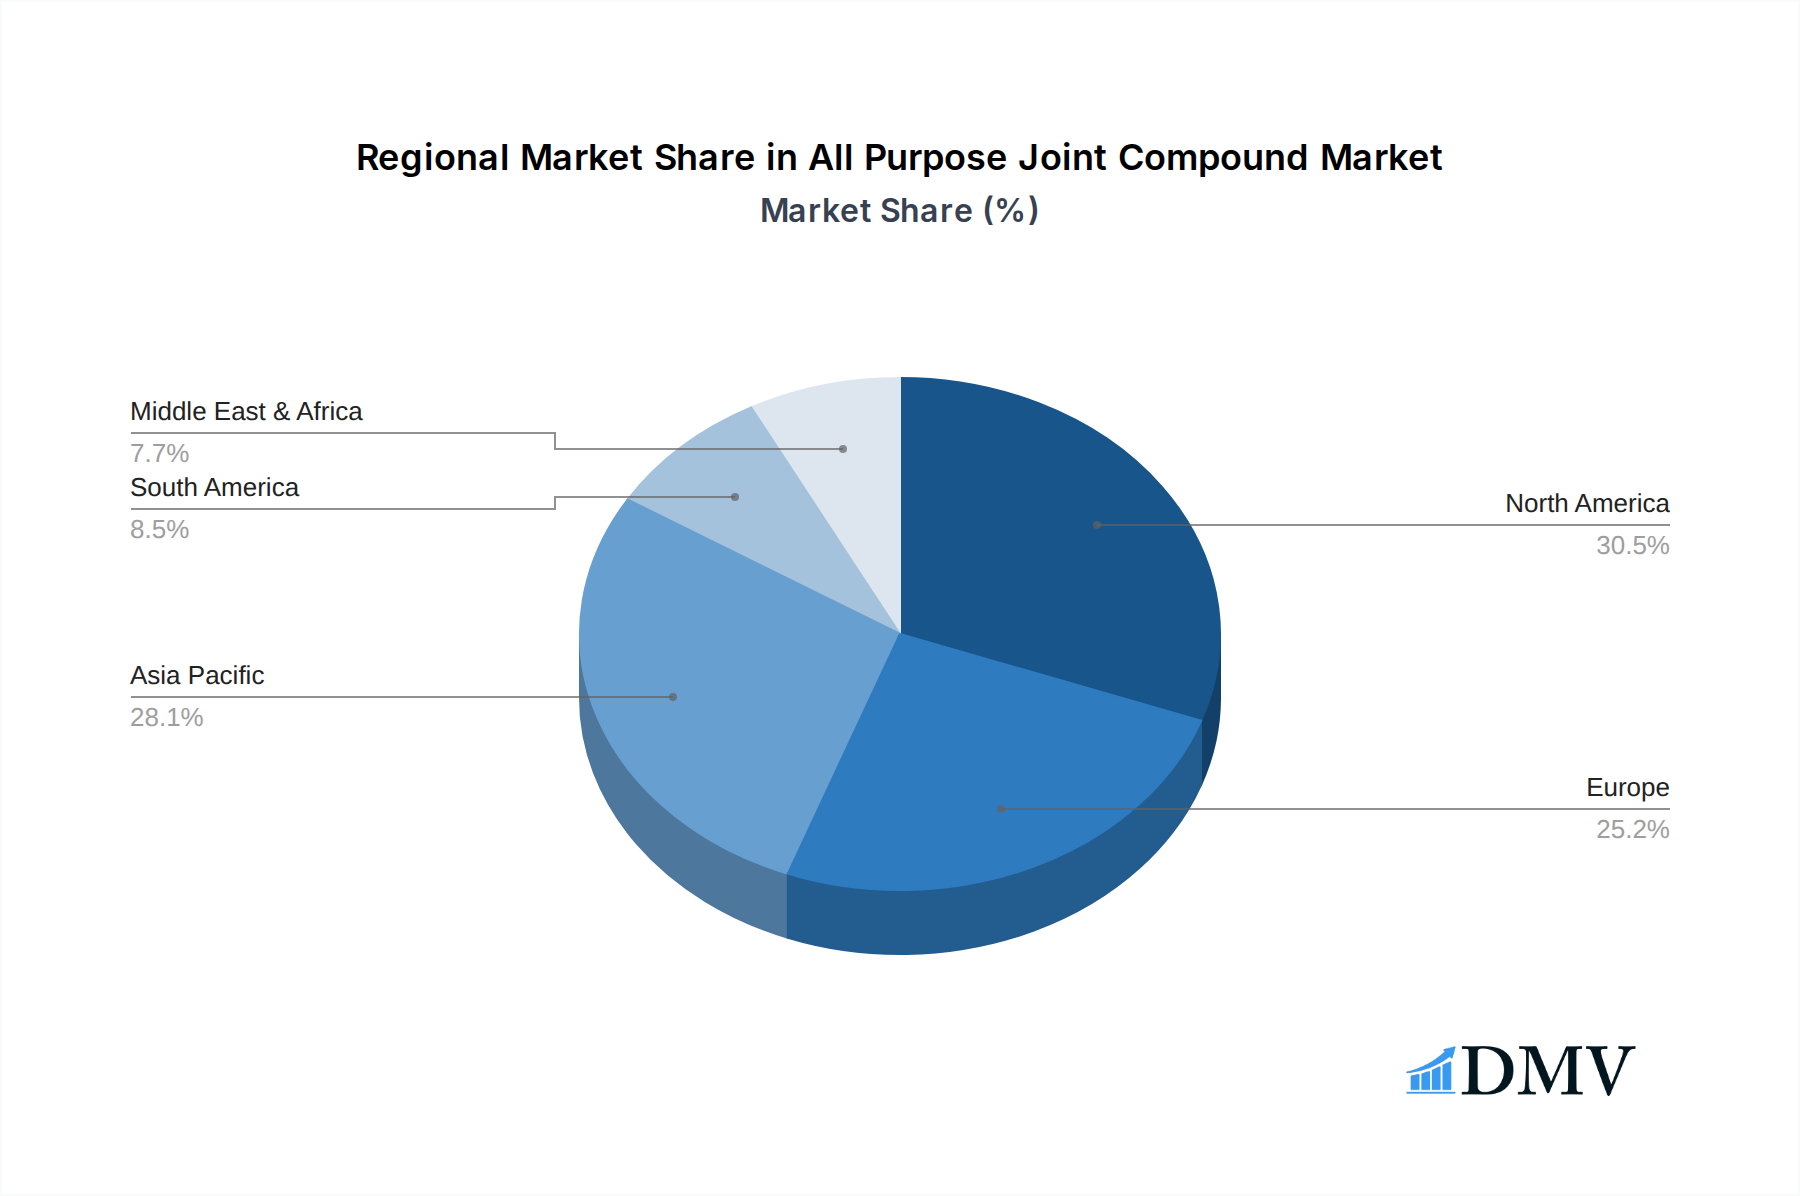
The global All Purpose Joint Compound market exhibits distinct regional dominance, with North America emerging as the leading market, primarily driven by the United States. This leadership is attributed to several interconnected factors, including a robust construction industry, extensive existing housing stock requiring frequent renovations, and a high adoption rate of advanced building materials. The Residential application segment within North America is particularly strong, fueled by consistent home improvement trends and a growing DIY culture. The estimated market share for North America is projected to be around 35% of the global market.
In terms of product types, the Ready Mix segment holds a commanding position globally and within key regions. Its inherent convenience, ease of use, and availability make it the preferred choice for a wide array of applications, from small residential repairs to large commercial projects. The Ready Mix segment is estimated to capture over 70% of the total market share, with significant demand from both professional contractors and do-it-yourself enthusiasts. However, the Lightweight segment, while smaller in market share, is experiencing a notable surge in growth. This is due to its inherent benefits, such as reduced worker fatigue, lower transportation costs, and improved environmental profiles through reduced material density. The Lightweight segment is projected to witness a CAGR of approximately 5.2% during the forecast period, outpacing the overall market growth.
Key drivers contributing to the dominance of specific regions and segments include:
- Investment Trends: Significant ongoing investments in infrastructure development and residential construction projects across North America and parts of Asia-Pacific directly translate into sustained demand for all-purpose joint compounds. For instance, the US construction spending is projected to reach over 2.1 trillion by 2025.
- Regulatory Support: Favorable building codes and environmental regulations that encourage the use of low-VOC and non-toxic materials are indirectly boosting the market, particularly for advanced formulations.
- Technological Adoption: The rapid adoption of new technologies, such as faster-setting and easier-to-sand compounds, fuels the growth of segments like Lightweight, while the sheer convenience of Ready Mix ensures its continued market leadership.
- End-User Preferences: A strong preference for DIY projects in the Residential sector and the need for efficient, cost-effective solutions in Commercial and Industrial applications solidify the market positions of Ready Mix and Lightweight compounds respectively.
The Commercial application segment is also a significant contributor to market growth, driven by new office building constructions, retail space developments, and the renovation of existing commercial properties. Industrial applications, while representing a smaller portion of the market, often require specialized, high-performance joint compounds that contribute to higher value sales. The interplay of these application segments and product types, coupled with regional economic conditions and construction activity, defines the evolving landscape of the All Purpose Joint Compound market.
All Purpose Joint Compound Product Innovations
Product innovations in the All Purpose Joint Compound market are centered on enhancing user experience, performance, and environmental sustainability. Manufacturers are increasingly developing lightweight formulations that significantly reduce material weight, making them easier to transport and handle, thereby minimizing worker fatigue. Advancements in drying times have led to "fast-setting" compounds that allow for quicker application and reduced project timelines. Furthermore, the focus on "low-VOC" and "no-VOC" formulations addresses growing environmental concerns and stricter regulatory requirements, offering healthier indoor air quality. Unique selling propositions now include compounds that are pre-mixed for immediate use, require minimal sanding for a smooth finish, and exhibit superior crack and shrink resistance, ensuring greater durability and aesthetic appeal in both residential and commercial applications.
Propelling Factors for All Purpose Joint Compound Growth
The All Purpose Joint Compound market is propelled by several key growth drivers. The sustained global construction activity, both in new builds and renovations across residential, commercial, and industrial sectors, forms the bedrock of demand. Technological advancements, leading to lighter, faster-drying, and easier-to-sand compounds, significantly enhance application efficiency, appealing to time-conscious contractors. Growing environmental awareness and stringent regulations regarding VOC emissions are driving the adoption of low-VOC and no-VOC formulations, opening new market avenues. Furthermore, the increasing popularity of DIY home improvement projects, particularly in developed economies, directly boosts the demand for user-friendly, ready-to-use joint compounds. The economic recovery and government stimulus packages aimed at boosting infrastructure and housing projects in various regions also act as significant accelerators.
Obstacles in the All Purpose Joint Compound Market
Despite robust growth, the All Purpose Joint Compound market faces several obstacles. Fluctuations in raw material prices, such as gypsum and polymers, can significantly impact manufacturing costs and profit margins. Stringent environmental regulations, while driving innovation, also necessitate substantial investment in research and development and can lead to increased production expenses. Supply chain disruptions, exacerbated by global events, can lead to material shortages and delayed project completions, affecting market stability. Intense competition among established players and the emergence of new entrants can lead to price wars, compressing profitability. Additionally, the availability of substitute products and evolving construction techniques might pose a long-term challenge, requiring continuous product differentiation and market adaptation.
Future Opportunities in All Purpose Joint Compound
Emerging opportunities in the All Purpose Joint Compound market are multifaceted. The increasing demand for sustainable building materials presents a significant avenue for biodegradable or recycled-content joint compounds. Growing urbanization and the subsequent need for affordable housing in developing economies offer substantial untapped market potential. Advancements in nanotechnology could lead to the development of self-healing or antimicrobial joint compounds with enhanced durability and hygiene properties. The rise of smart homes and sustainable construction practices will also create demand for specialized compounds that integrate with innovative building systems. Furthermore, expansion into emerging markets with developing construction sectors represents a key opportunity for market players.
Major Players in the All Purpose Joint Compound Ecosystem
- Knauf
- National Gypsum (ProForm)
- Georgia-Pacific
- Saint-Gobain
- Dap
- Hamilton
- Murco
- Freeman
- CTS Cement
- Solid Products
- Southern Wall Products
- ASG Asian Super Gypsum
- Yoshino Gypsum
- CSR Limited (Gyprock)
Key Developments in All Purpose Joint Compound Industry
- 2024: Knauf introduces a new line of ultra-lightweight joint compound offering enhanced ease of use and reduced material waste.
- 2024: National Gypsum (ProForm) expands its ProROK™ series with an enhanced faster-setting formulation for commercial applications.
- 2023: Georgia-Pacific launches a series of low-VOC certified joint compounds to meet growing environmental demands.
- 2023: Saint-Gobain invests significantly in R&D for innovative, eco-friendly joint compound solutions.
- 2023: Dap announces a strategic partnership to enhance its distribution network in emerging markets.
- 2022: Yoshino Gypsum expands its production capacity to meet the surging demand in the Asia-Pacific region.
- 2022: CSR Limited (Gyprock) acquires a smaller regional manufacturer to strengthen its market presence in Australia.
- 2021: Several companies, including Hamilton and Murco, focus on optimizing their supply chains to mitigate disruptions.
- 2020: The industry sees a surge in demand for DIY-friendly, pre-mixed joint compounds due to increased home renovation activities.
- 2019: CTS Cement develops a specialized joint compound for industrial applications requiring high chemical resistance.
Strategic All Purpose Joint Compound Market Forecast
The strategic All Purpose Joint Compound market forecast indicates sustained growth driven by ongoing construction activity and increasing demand for efficient, environmentally responsible building materials. The forecast period (2025–2033) is expected to witness a CAGR of approximately 4.5%, with the market value projected to exceed 7 billion. Key growth catalysts include continued technological innovation leading to lighter and faster-drying compounds, a growing emphasis on low-VOC and sustainable products, and the robust expansion of the residential and commercial construction sectors, particularly in emerging economies. The market's ability to adapt to evolving consumer preferences for ease of use and superior finish will be crucial in capitalizing on future opportunities and solidifying its position in the global construction materials landscape.
All Purpose Joint Compound Segmentation
-
1. Application
- 1.1. Residential
- 1.2. Commercial
- 1.3. Industrial
-
2. Types
- 2.1. Ready Mix
- 2.2. Lightweight
All Purpose Joint Compound Segmentation By Geography
-
1. North America
- 1.1. United States
- 1.2. Canada
- 1.3. Mexico
-
2. South America
- 2.1. Brazil
- 2.2. Argentina
- 2.3. Rest of South America
-
3. Europe
- 3.1. United Kingdom
- 3.2. Germany
- 3.3. France
- 3.4. Italy
- 3.5. Spain
- 3.6. Russia
- 3.7. Benelux
- 3.8. Nordics
- 3.9. Rest of Europe
-
4. Middle East & Africa
- 4.1. Turkey
- 4.2. Israel
- 4.3. GCC
- 4.4. North Africa
- 4.5. South Africa
- 4.6. Rest of Middle East & Africa
-
5. Asia Pacific
- 5.1. China
- 5.2. India
- 5.3. Japan
- 5.4. South Korea
- 5.5. ASEAN
- 5.6. Oceania
- 5.7. Rest of Asia Pacific
All Purpose Joint Compound Regional Market Share
Geographic Coverage of All Purpose Joint Compound
All Purpose Joint Compound REPORT HIGHLIGHTS
| Aspects | Details |
|---|---|
| Study Period | 2020-2034 |
| Base Year | 2025 |
| Estimated Year | 2026 |
| Forecast Period | 2026-2034 |
| Historical Period | 2020-2025 |
| Growth Rate | CAGR of 5.2% from 2020-2034 |
| Segmentation |
|
Table of Contents
- 1. Introduction
- 1.1. Research Scope
- 1.2. Market Segmentation
- 1.3. Research Methodology
- 1.4. Definitions and Assumptions
- 2. Executive Summary
- 2.1. Introduction
- 3. Market Dynamics
- 3.1. Introduction
- 3.2. Market Drivers
- 3.3. Market Restrains
- 3.4. Market Trends
- 4. Market Factor Analysis
- 4.1. Porters Five Forces
- 4.2. Supply/Value Chain
- 4.3. PESTEL analysis
- 4.4. Market Entropy
- 4.5. Patent/Trademark Analysis
- 5. Global All Purpose Joint Compound Analysis, Insights and Forecast, 2020-2032
- 5.1. Market Analysis, Insights and Forecast - by Application
- 5.1.1. Residential
- 5.1.2. Commercial
- 5.1.3. Industrial
- 5.2. Market Analysis, Insights and Forecast - by Types
- 5.2.1. Ready Mix
- 5.2.2. Lightweight
- 5.3. Market Analysis, Insights and Forecast - by Region
- 5.3.1. North America
- 5.3.2. South America
- 5.3.3. Europe
- 5.3.4. Middle East & Africa
- 5.3.5. Asia Pacific
- 5.1. Market Analysis, Insights and Forecast - by Application
- 6. North America All Purpose Joint Compound Analysis, Insights and Forecast, 2020-2032
- 6.1. Market Analysis, Insights and Forecast - by Application
- 6.1.1. Residential
- 6.1.2. Commercial
- 6.1.3. Industrial
- 6.2. Market Analysis, Insights and Forecast - by Types
- 6.2.1. Ready Mix
- 6.2.2. Lightweight
- 6.1. Market Analysis, Insights and Forecast - by Application
- 7. South America All Purpose Joint Compound Analysis, Insights and Forecast, 2020-2032
- 7.1. Market Analysis, Insights and Forecast - by Application
- 7.1.1. Residential
- 7.1.2. Commercial
- 7.1.3. Industrial
- 7.2. Market Analysis, Insights and Forecast - by Types
- 7.2.1. Ready Mix
- 7.2.2. Lightweight
- 7.1. Market Analysis, Insights and Forecast - by Application
- 8. Europe All Purpose Joint Compound Analysis, Insights and Forecast, 2020-2032
- 8.1. Market Analysis, Insights and Forecast - by Application
- 8.1.1. Residential
- 8.1.2. Commercial
- 8.1.3. Industrial
- 8.2. Market Analysis, Insights and Forecast - by Types
- 8.2.1. Ready Mix
- 8.2.2. Lightweight
- 8.1. Market Analysis, Insights and Forecast - by Application
- 9. Middle East & Africa All Purpose Joint Compound Analysis, Insights and Forecast, 2020-2032
- 9.1. Market Analysis, Insights and Forecast - by Application
- 9.1.1. Residential
- 9.1.2. Commercial
- 9.1.3. Industrial
- 9.2. Market Analysis, Insights and Forecast - by Types
- 9.2.1. Ready Mix
- 9.2.2. Lightweight
- 9.1. Market Analysis, Insights and Forecast - by Application
- 10. Asia Pacific All Purpose Joint Compound Analysis, Insights and Forecast, 2020-2032
- 10.1. Market Analysis, Insights and Forecast - by Application
- 10.1.1. Residential
- 10.1.2. Commercial
- 10.1.3. Industrial
- 10.2. Market Analysis, Insights and Forecast - by Types
- 10.2.1. Ready Mix
- 10.2.2. Lightweight
- 10.1. Market Analysis, Insights and Forecast - by Application
- 11. Competitive Analysis
- 11.1. Global Market Share Analysis 2025
- 11.2. Company Profiles
- 11.2.1 Knauf
- 11.2.1.1. Overview
- 11.2.1.2. Products
- 11.2.1.3. SWOT Analysis
- 11.2.1.4. Recent Developments
- 11.2.1.5. Financials (Based on Availability)
- 11.2.2 National Gypsum (ProForm)
- 11.2.2.1. Overview
- 11.2.2.2. Products
- 11.2.2.3. SWOT Analysis
- 11.2.2.4. Recent Developments
- 11.2.2.5. Financials (Based on Availability)
- 11.2.3 Georgia-Pacific
- 11.2.3.1. Overview
- 11.2.3.2. Products
- 11.2.3.3. SWOT Analysis
- 11.2.3.4. Recent Developments
- 11.2.3.5. Financials (Based on Availability)
- 11.2.4 Saint-Gobain
- 11.2.4.1. Overview
- 11.2.4.2. Products
- 11.2.4.3. SWOT Analysis
- 11.2.4.4. Recent Developments
- 11.2.4.5. Financials (Based on Availability)
- 11.2.5 Dap
- 11.2.5.1. Overview
- 11.2.5.2. Products
- 11.2.5.3. SWOT Analysis
- 11.2.5.4. Recent Developments
- 11.2.5.5. Financials (Based on Availability)
- 11.2.6 Hamilton
- 11.2.6.1. Overview
- 11.2.6.2. Products
- 11.2.6.3. SWOT Analysis
- 11.2.6.4. Recent Developments
- 11.2.6.5. Financials (Based on Availability)
- 11.2.7 Murco
- 11.2.7.1. Overview
- 11.2.7.2. Products
- 11.2.7.3. SWOT Analysis
- 11.2.7.4. Recent Developments
- 11.2.7.5. Financials (Based on Availability)
- 11.2.8 Freeman
- 11.2.8.1. Overview
- 11.2.8.2. Products
- 11.2.8.3. SWOT Analysis
- 11.2.8.4. Recent Developments
- 11.2.8.5. Financials (Based on Availability)
- 11.2.9 CTS Cement
- 11.2.9.1. Overview
- 11.2.9.2. Products
- 11.2.9.3. SWOT Analysis
- 11.2.9.4. Recent Developments
- 11.2.9.5. Financials (Based on Availability)
- 11.2.10 Solid Products
- 11.2.10.1. Overview
- 11.2.10.2. Products
- 11.2.10.3. SWOT Analysis
- 11.2.10.4. Recent Developments
- 11.2.10.5. Financials (Based on Availability)
- 11.2.11 Southern Wall Products
- 11.2.11.1. Overview
- 11.2.11.2. Products
- 11.2.11.3. SWOT Analysis
- 11.2.11.4. Recent Developments
- 11.2.11.5. Financials (Based on Availability)
- 11.2.12 ASG Asian Super Gypsum
- 11.2.12.1. Overview
- 11.2.12.2. Products
- 11.2.12.3. SWOT Analysis
- 11.2.12.4. Recent Developments
- 11.2.12.5. Financials (Based on Availability)
- 11.2.13 Yoshino Gypsum
- 11.2.13.1. Overview
- 11.2.13.2. Products
- 11.2.13.3. SWOT Analysis
- 11.2.13.4. Recent Developments
- 11.2.13.5. Financials (Based on Availability)
- 11.2.14 CSR Limited (Gyprock)
- 11.2.14.1. Overview
- 11.2.14.2. Products
- 11.2.14.3. SWOT Analysis
- 11.2.14.4. Recent Developments
- 11.2.14.5. Financials (Based on Availability)
- 11.2.1 Knauf
List of Figures
- Figure 1: Global All Purpose Joint Compound Revenue Breakdown (billion, %) by Region 2025 & 2033
- Figure 2: Global All Purpose Joint Compound Volume Breakdown (K, %) by Region 2025 & 2033
- Figure 3: North America All Purpose Joint Compound Revenue (billion), by Application 2025 & 2033
- Figure 4: North America All Purpose Joint Compound Volume (K), by Application 2025 & 2033
- Figure 5: North America All Purpose Joint Compound Revenue Share (%), by Application 2025 & 2033
- Figure 6: North America All Purpose Joint Compound Volume Share (%), by Application 2025 & 2033
- Figure 7: North America All Purpose Joint Compound Revenue (billion), by Types 2025 & 2033
- Figure 8: North America All Purpose Joint Compound Volume (K), by Types 2025 & 2033
- Figure 9: North America All Purpose Joint Compound Revenue Share (%), by Types 2025 & 2033
- Figure 10: North America All Purpose Joint Compound Volume Share (%), by Types 2025 & 2033
- Figure 11: North America All Purpose Joint Compound Revenue (billion), by Country 2025 & 2033
- Figure 12: North America All Purpose Joint Compound Volume (K), by Country 2025 & 2033
- Figure 13: North America All Purpose Joint Compound Revenue Share (%), by Country 2025 & 2033
- Figure 14: North America All Purpose Joint Compound Volume Share (%), by Country 2025 & 2033
- Figure 15: South America All Purpose Joint Compound Revenue (billion), by Application 2025 & 2033
- Figure 16: South America All Purpose Joint Compound Volume (K), by Application 2025 & 2033
- Figure 17: South America All Purpose Joint Compound Revenue Share (%), by Application 2025 & 2033
- Figure 18: South America All Purpose Joint Compound Volume Share (%), by Application 2025 & 2033
- Figure 19: South America All Purpose Joint Compound Revenue (billion), by Types 2025 & 2033
- Figure 20: South America All Purpose Joint Compound Volume (K), by Types 2025 & 2033
- Figure 21: South America All Purpose Joint Compound Revenue Share (%), by Types 2025 & 2033
- Figure 22: South America All Purpose Joint Compound Volume Share (%), by Types 2025 & 2033
- Figure 23: South America All Purpose Joint Compound Revenue (billion), by Country 2025 & 2033
- Figure 24: South America All Purpose Joint Compound Volume (K), by Country 2025 & 2033
- Figure 25: South America All Purpose Joint Compound Revenue Share (%), by Country 2025 & 2033
- Figure 26: South America All Purpose Joint Compound Volume Share (%), by Country 2025 & 2033
- Figure 27: Europe All Purpose Joint Compound Revenue (billion), by Application 2025 & 2033
- Figure 28: Europe All Purpose Joint Compound Volume (K), by Application 2025 & 2033
- Figure 29: Europe All Purpose Joint Compound Revenue Share (%), by Application 2025 & 2033
- Figure 30: Europe All Purpose Joint Compound Volume Share (%), by Application 2025 & 2033
- Figure 31: Europe All Purpose Joint Compound Revenue (billion), by Types 2025 & 2033
- Figure 32: Europe All Purpose Joint Compound Volume (K), by Types 2025 & 2033
- Figure 33: Europe All Purpose Joint Compound Revenue Share (%), by Types 2025 & 2033
- Figure 34: Europe All Purpose Joint Compound Volume Share (%), by Types 2025 & 2033
- Figure 35: Europe All Purpose Joint Compound Revenue (billion), by Country 2025 & 2033
- Figure 36: Europe All Purpose Joint Compound Volume (K), by Country 2025 & 2033
- Figure 37: Europe All Purpose Joint Compound Revenue Share (%), by Country 2025 & 2033
- Figure 38: Europe All Purpose Joint Compound Volume Share (%), by Country 2025 & 2033
- Figure 39: Middle East & Africa All Purpose Joint Compound Revenue (billion), by Application 2025 & 2033
- Figure 40: Middle East & Africa All Purpose Joint Compound Volume (K), by Application 2025 & 2033
- Figure 41: Middle East & Africa All Purpose Joint Compound Revenue Share (%), by Application 2025 & 2033
- Figure 42: Middle East & Africa All Purpose Joint Compound Volume Share (%), by Application 2025 & 2033
- Figure 43: Middle East & Africa All Purpose Joint Compound Revenue (billion), by Types 2025 & 2033
- Figure 44: Middle East & Africa All Purpose Joint Compound Volume (K), by Types 2025 & 2033
- Figure 45: Middle East & Africa All Purpose Joint Compound Revenue Share (%), by Types 2025 & 2033
- Figure 46: Middle East & Africa All Purpose Joint Compound Volume Share (%), by Types 2025 & 2033
- Figure 47: Middle East & Africa All Purpose Joint Compound Revenue (billion), by Country 2025 & 2033
- Figure 48: Middle East & Africa All Purpose Joint Compound Volume (K), by Country 2025 & 2033
- Figure 49: Middle East & Africa All Purpose Joint Compound Revenue Share (%), by Country 2025 & 2033
- Figure 50: Middle East & Africa All Purpose Joint Compound Volume Share (%), by Country 2025 & 2033
- Figure 51: Asia Pacific All Purpose Joint Compound Revenue (billion), by Application 2025 & 2033
- Figure 52: Asia Pacific All Purpose Joint Compound Volume (K), by Application 2025 & 2033
- Figure 53: Asia Pacific All Purpose Joint Compound Revenue Share (%), by Application 2025 & 2033
- Figure 54: Asia Pacific All Purpose Joint Compound Volume Share (%), by Application 2025 & 2033
- Figure 55: Asia Pacific All Purpose Joint Compound Revenue (billion), by Types 2025 & 2033
- Figure 56: Asia Pacific All Purpose Joint Compound Volume (K), by Types 2025 & 2033
- Figure 57: Asia Pacific All Purpose Joint Compound Revenue Share (%), by Types 2025 & 2033
- Figure 58: Asia Pacific All Purpose Joint Compound Volume Share (%), by Types 2025 & 2033
- Figure 59: Asia Pacific All Purpose Joint Compound Revenue (billion), by Country 2025 & 2033
- Figure 60: Asia Pacific All Purpose Joint Compound Volume (K), by Country 2025 & 2033
- Figure 61: Asia Pacific All Purpose Joint Compound Revenue Share (%), by Country 2025 & 2033
- Figure 62: Asia Pacific All Purpose Joint Compound Volume Share (%), by Country 2025 & 2033
List of Tables
- Table 1: Global All Purpose Joint Compound Revenue billion Forecast, by Application 2020 & 2033
- Table 2: Global All Purpose Joint Compound Volume K Forecast, by Application 2020 & 2033
- Table 3: Global All Purpose Joint Compound Revenue billion Forecast, by Types 2020 & 2033
- Table 4: Global All Purpose Joint Compound Volume K Forecast, by Types 2020 & 2033
- Table 5: Global All Purpose Joint Compound Revenue billion Forecast, by Region 2020 & 2033
- Table 6: Global All Purpose Joint Compound Volume K Forecast, by Region 2020 & 2033
- Table 7: Global All Purpose Joint Compound Revenue billion Forecast, by Application 2020 & 2033
- Table 8: Global All Purpose Joint Compound Volume K Forecast, by Application 2020 & 2033
- Table 9: Global All Purpose Joint Compound Revenue billion Forecast, by Types 2020 & 2033
- Table 10: Global All Purpose Joint Compound Volume K Forecast, by Types 2020 & 2033
- Table 11: Global All Purpose Joint Compound Revenue billion Forecast, by Country 2020 & 2033
- Table 12: Global All Purpose Joint Compound Volume K Forecast, by Country 2020 & 2033
- Table 13: United States All Purpose Joint Compound Revenue (billion) Forecast, by Application 2020 & 2033
- Table 14: United States All Purpose Joint Compound Volume (K) Forecast, by Application 2020 & 2033
- Table 15: Canada All Purpose Joint Compound Revenue (billion) Forecast, by Application 2020 & 2033
- Table 16: Canada All Purpose Joint Compound Volume (K) Forecast, by Application 2020 & 2033
- Table 17: Mexico All Purpose Joint Compound Revenue (billion) Forecast, by Application 2020 & 2033
- Table 18: Mexico All Purpose Joint Compound Volume (K) Forecast, by Application 2020 & 2033
- Table 19: Global All Purpose Joint Compound Revenue billion Forecast, by Application 2020 & 2033
- Table 20: Global All Purpose Joint Compound Volume K Forecast, by Application 2020 & 2033
- Table 21: Global All Purpose Joint Compound Revenue billion Forecast, by Types 2020 & 2033
- Table 22: Global All Purpose Joint Compound Volume K Forecast, by Types 2020 & 2033
- Table 23: Global All Purpose Joint Compound Revenue billion Forecast, by Country 2020 & 2033
- Table 24: Global All Purpose Joint Compound Volume K Forecast, by Country 2020 & 2033
- Table 25: Brazil All Purpose Joint Compound Revenue (billion) Forecast, by Application 2020 & 2033
- Table 26: Brazil All Purpose Joint Compound Volume (K) Forecast, by Application 2020 & 2033
- Table 27: Argentina All Purpose Joint Compound Revenue (billion) Forecast, by Application 2020 & 2033
- Table 28: Argentina All Purpose Joint Compound Volume (K) Forecast, by Application 2020 & 2033
- Table 29: Rest of South America All Purpose Joint Compound Revenue (billion) Forecast, by Application 2020 & 2033
- Table 30: Rest of South America All Purpose Joint Compound Volume (K) Forecast, by Application 2020 & 2033
- Table 31: Global All Purpose Joint Compound Revenue billion Forecast, by Application 2020 & 2033
- Table 32: Global All Purpose Joint Compound Volume K Forecast, by Application 2020 & 2033
- Table 33: Global All Purpose Joint Compound Revenue billion Forecast, by Types 2020 & 2033
- Table 34: Global All Purpose Joint Compound Volume K Forecast, by Types 2020 & 2033
- Table 35: Global All Purpose Joint Compound Revenue billion Forecast, by Country 2020 & 2033
- Table 36: Global All Purpose Joint Compound Volume K Forecast, by Country 2020 & 2033
- Table 37: United Kingdom All Purpose Joint Compound Revenue (billion) Forecast, by Application 2020 & 2033
- Table 38: United Kingdom All Purpose Joint Compound Volume (K) Forecast, by Application 2020 & 2033
- Table 39: Germany All Purpose Joint Compound Revenue (billion) Forecast, by Application 2020 & 2033
- Table 40: Germany All Purpose Joint Compound Volume (K) Forecast, by Application 2020 & 2033
- Table 41: France All Purpose Joint Compound Revenue (billion) Forecast, by Application 2020 & 2033
- Table 42: France All Purpose Joint Compound Volume (K) Forecast, by Application 2020 & 2033
- Table 43: Italy All Purpose Joint Compound Revenue (billion) Forecast, by Application 2020 & 2033
- Table 44: Italy All Purpose Joint Compound Volume (K) Forecast, by Application 2020 & 2033
- Table 45: Spain All Purpose Joint Compound Revenue (billion) Forecast, by Application 2020 & 2033
- Table 46: Spain All Purpose Joint Compound Volume (K) Forecast, by Application 2020 & 2033
- Table 47: Russia All Purpose Joint Compound Revenue (billion) Forecast, by Application 2020 & 2033
- Table 48: Russia All Purpose Joint Compound Volume (K) Forecast, by Application 2020 & 2033
- Table 49: Benelux All Purpose Joint Compound Revenue (billion) Forecast, by Application 2020 & 2033
- Table 50: Benelux All Purpose Joint Compound Volume (K) Forecast, by Application 2020 & 2033
- Table 51: Nordics All Purpose Joint Compound Revenue (billion) Forecast, by Application 2020 & 2033
- Table 52: Nordics All Purpose Joint Compound Volume (K) Forecast, by Application 2020 & 2033
- Table 53: Rest of Europe All Purpose Joint Compound Revenue (billion) Forecast, by Application 2020 & 2033
- Table 54: Rest of Europe All Purpose Joint Compound Volume (K) Forecast, by Application 2020 & 2033
- Table 55: Global All Purpose Joint Compound Revenue billion Forecast, by Application 2020 & 2033
- Table 56: Global All Purpose Joint Compound Volume K Forecast, by Application 2020 & 2033
- Table 57: Global All Purpose Joint Compound Revenue billion Forecast, by Types 2020 & 2033
- Table 58: Global All Purpose Joint Compound Volume K Forecast, by Types 2020 & 2033
- Table 59: Global All Purpose Joint Compound Revenue billion Forecast, by Country 2020 & 2033
- Table 60: Global All Purpose Joint Compound Volume K Forecast, by Country 2020 & 2033
- Table 61: Turkey All Purpose Joint Compound Revenue (billion) Forecast, by Application 2020 & 2033
- Table 62: Turkey All Purpose Joint Compound Volume (K) Forecast, by Application 2020 & 2033
- Table 63: Israel All Purpose Joint Compound Revenue (billion) Forecast, by Application 2020 & 2033
- Table 64: Israel All Purpose Joint Compound Volume (K) Forecast, by Application 2020 & 2033
- Table 65: GCC All Purpose Joint Compound Revenue (billion) Forecast, by Application 2020 & 2033
- Table 66: GCC All Purpose Joint Compound Volume (K) Forecast, by Application 2020 & 2033
- Table 67: North Africa All Purpose Joint Compound Revenue (billion) Forecast, by Application 2020 & 2033
- Table 68: North Africa All Purpose Joint Compound Volume (K) Forecast, by Application 2020 & 2033
- Table 69: South Africa All Purpose Joint Compound Revenue (billion) Forecast, by Application 2020 & 2033
- Table 70: South Africa All Purpose Joint Compound Volume (K) Forecast, by Application 2020 & 2033
- Table 71: Rest of Middle East & Africa All Purpose Joint Compound Revenue (billion) Forecast, by Application 2020 & 2033
- Table 72: Rest of Middle East & Africa All Purpose Joint Compound Volume (K) Forecast, by Application 2020 & 2033
- Table 73: Global All Purpose Joint Compound Revenue billion Forecast, by Application 2020 & 2033
- Table 74: Global All Purpose Joint Compound Volume K Forecast, by Application 2020 & 2033
- Table 75: Global All Purpose Joint Compound Revenue billion Forecast, by Types 2020 & 2033
- Table 76: Global All Purpose Joint Compound Volume K Forecast, by Types 2020 & 2033
- Table 77: Global All Purpose Joint Compound Revenue billion Forecast, by Country 2020 & 2033
- Table 78: Global All Purpose Joint Compound Volume K Forecast, by Country 2020 & 2033
- Table 79: China All Purpose Joint Compound Revenue (billion) Forecast, by Application 2020 & 2033
- Table 80: China All Purpose Joint Compound Volume (K) Forecast, by Application 2020 & 2033
- Table 81: India All Purpose Joint Compound Revenue (billion) Forecast, by Application 2020 & 2033
- Table 82: India All Purpose Joint Compound Volume (K) Forecast, by Application 2020 & 2033
- Table 83: Japan All Purpose Joint Compound Revenue (billion) Forecast, by Application 2020 & 2033
- Table 84: Japan All Purpose Joint Compound Volume (K) Forecast, by Application 2020 & 2033
- Table 85: South Korea All Purpose Joint Compound Revenue (billion) Forecast, by Application 2020 & 2033
- Table 86: South Korea All Purpose Joint Compound Volume (K) Forecast, by Application 2020 & 2033
- Table 87: ASEAN All Purpose Joint Compound Revenue (billion) Forecast, by Application 2020 & 2033
- Table 88: ASEAN All Purpose Joint Compound Volume (K) Forecast, by Application 2020 & 2033
- Table 89: Oceania All Purpose Joint Compound Revenue (billion) Forecast, by Application 2020 & 2033
- Table 90: Oceania All Purpose Joint Compound Volume (K) Forecast, by Application 2020 & 2033
- Table 91: Rest of Asia Pacific All Purpose Joint Compound Revenue (billion) Forecast, by Application 2020 & 2033
- Table 92: Rest of Asia Pacific All Purpose Joint Compound Volume (K) Forecast, by Application 2020 & 2033
Frequently Asked Questions
1. What is the projected Compound Annual Growth Rate (CAGR) of the All Purpose Joint Compound?
The projected CAGR is approximately 5.2%.
2. Which companies are prominent players in the All Purpose Joint Compound?
Key companies in the market include Knauf, National Gypsum (ProForm), Georgia-Pacific, Saint-Gobain, Dap, Hamilton, Murco, Freeman, CTS Cement, Solid Products, Southern Wall Products, ASG Asian Super Gypsum, Yoshino Gypsum, CSR Limited (Gyprock).
3. What are the main segments of the All Purpose Joint Compound?
The market segments include Application, Types.
4. Can you provide details about the market size?
The market size is estimated to be USD 5.5 billion as of 2022.
5. What are some drivers contributing to market growth?
N/A
6. What are the notable trends driving market growth?
N/A
7. Are there any restraints impacting market growth?
N/A
8. Can you provide examples of recent developments in the market?
N/A
9. What pricing options are available for accessing the report?
Pricing options include single-user, multi-user, and enterprise licenses priced at USD 3350.00, USD 5025.00, and USD 6700.00 respectively.
10. Is the market size provided in terms of value or volume?
The market size is provided in terms of value, measured in billion and volume, measured in K.
11. Are there any specific market keywords associated with the report?
Yes, the market keyword associated with the report is "All Purpose Joint Compound," which aids in identifying and referencing the specific market segment covered.
12. How do I determine which pricing option suits my needs best?
The pricing options vary based on user requirements and access needs. Individual users may opt for single-user licenses, while businesses requiring broader access may choose multi-user or enterprise licenses for cost-effective access to the report.
13. Are there any additional resources or data provided in the All Purpose Joint Compound report?
While the report offers comprehensive insights, it's advisable to review the specific contents or supplementary materials provided to ascertain if additional resources or data are available.
14. How can I stay updated on further developments or reports in the All Purpose Joint Compound?
To stay informed about further developments, trends, and reports in the All Purpose Joint Compound, consider subscribing to industry newsletters, following relevant companies and organizations, or regularly checking reputable industry news sources and publications.
Methodology
Step 1 - Identification of Relevant Samples Size from Population Database


Step 2 - Approaches for Defining Global Market Size (Value, Volume* & Price*)

Note*: In applicable scenarios
Step 3 - Data Sources
Primary Research
- Web Analytics
- Survey Reports
- Research Institute
- Latest Research Reports
- Opinion Leaders
Secondary Research
- Annual Reports
- White Paper
- Latest Press Release
- Industry Association
- Paid Database
- Investor Presentations

Step 4 - Data Triangulation
Involves using different sources of information in order to increase the validity of a study
These sources are likely to be stakeholders in a program - participants, other researchers, program staff, other community members, and so on.
Then we put all data in single framework & apply various statistical tools to find out the dynamic on the market.
During the analysis stage, feedback from the stakeholder groups would be compared to determine areas of agreement as well as areas of divergence