

Key Insights
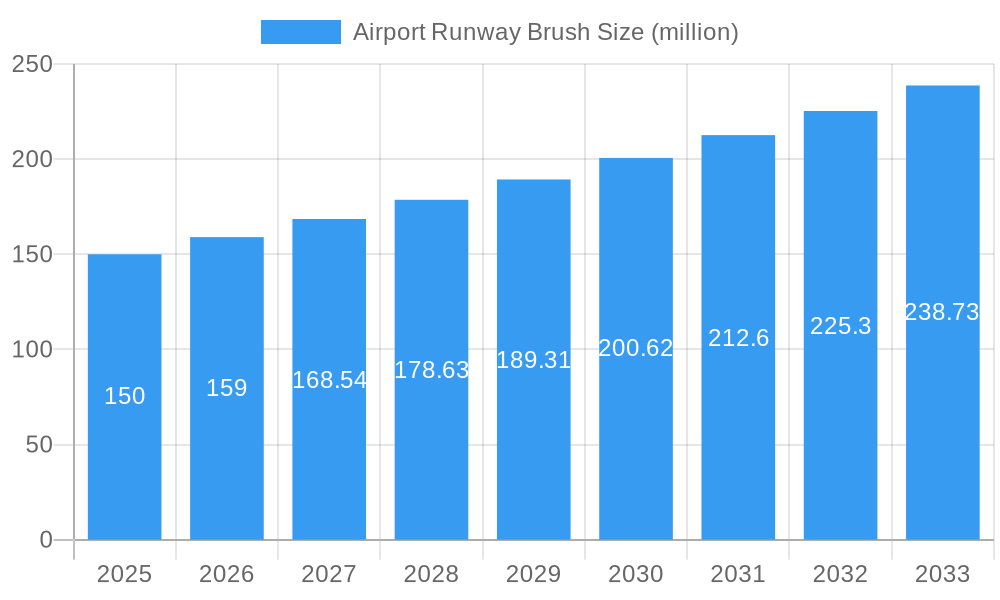
The global airport runway brush market is experiencing robust growth, driven by increasing air passenger traffic and stricter safety regulations demanding meticulously maintained runways. The market, currently valued at approximately $150 million in 2025, is projected to exhibit a Compound Annual Growth Rate (CAGR) of 6% from 2025 to 2033, reaching an estimated $250 million by 2033. This growth is fueled by several key factors. Firstly, the expansion of airport infrastructure globally, particularly in developing economies in Asia-Pacific and the Middle East, is creating significant demand for runway maintenance equipment. Secondly, advancements in brush technology, including the introduction of more durable and efficient materials like specialized synthetic fibers, are enhancing performance and extending the lifespan of runway brushes. Furthermore, a rising focus on sustainable practices within the aviation industry is promoting the adoption of brushes made from recycled materials, contributing to the overall market expansion. The market segmentation reveals a significant demand for ring-type brushes, attributed to their high cleaning efficiency and adaptability to various runway surfaces. Military airports are a key application segment, owing to stringent maintenance standards and the need to guarantee optimal runway conditions for aircraft operations.
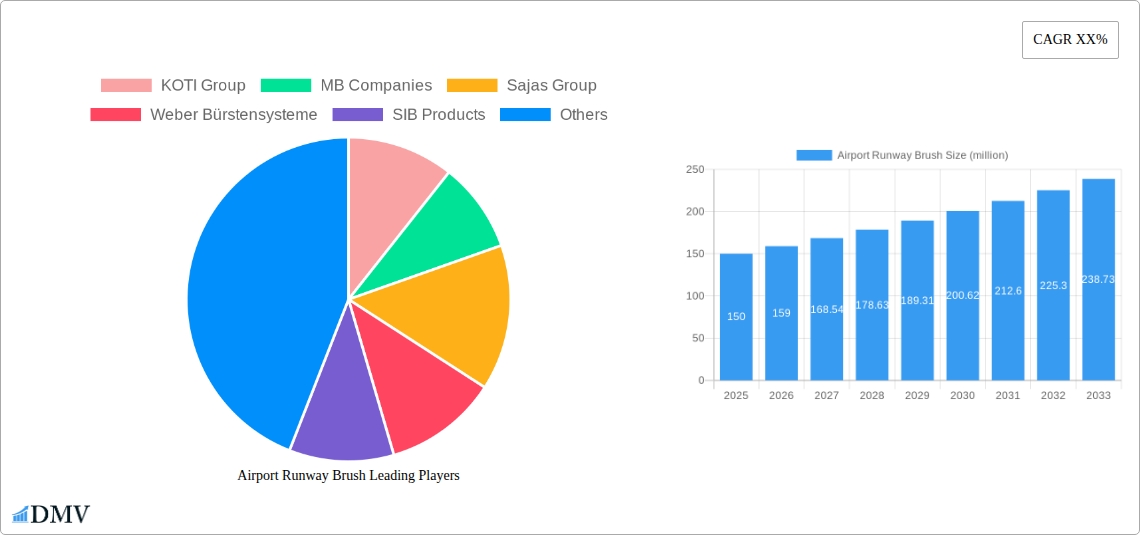
Airport Runway Brush Market Size (In Million)
Competition in the airport runway brush market is moderately concentrated, with key players including KOTI Group, MB Companies, and others focusing on innovation and strategic partnerships to expand their market reach. However, regional variations in market growth are apparent. North America and Europe currently hold a larger share, due to established aviation infrastructure and stringent safety protocols. Nevertheless, rapid infrastructural development in Asia-Pacific, especially China and India, is expected to drive substantial growth in these regions in the coming years. Restraints include fluctuating fuel prices impacting airport budgets and the high initial investment needed for advanced brush technologies. However, the long-term operational cost savings associated with these technologies, coupled with stringent safety regulations, are likely to offset this factor over the projected period. The continuous improvement in brush designs and materials, along with the growing need for efficient runway maintenance, is set to ensure sustained growth for the airport runway brush market in the forecast period.
Airport Runway Brush Company Market Share
Airport Runway Brush Market: A Comprehensive Report (2019-2033)
This insightful report provides a comprehensive analysis of the global Airport Runway Brush market, projecting a multi-million dollar valuation by 2033. It delves deep into market dynamics, technological advancements, and future growth opportunities, offering crucial insights for stakeholders, investors, and industry players. The report covers the period 2019-2033, with a base year of 2025 and a forecast period of 2025-2033. Key players profiled include KOTI Group, MB Companies, Sajas Group, Weber Bürstensysteme, SIB Products, TeCsolum Industrial Brushes, United Rotary Brush Corporation, Anhui Zhenda Brush Industry, and Anhui Union Brush Industry.
Airport Runway Brush Market Composition & Trends
This section evaluates the competitive landscape, analyzing market concentration, innovation drivers, regulatory frameworks, substitute products, and end-user profiles. The market is moderately fragmented, with no single entity commanding a dominant market share. However, several key players hold significant positions, capturing a combined xx million USD of revenue in 2025.
- Market Share Distribution (2025): KOTI Group (xx%), MB Companies (xx%), Sajas Group (xx%), Weber Bürstensysteme (xx%), Others (xx%).
- Innovation Catalysts: Increased demand for efficient runway maintenance, advancements in brush materials (e.g., high-strength polymers), and the integration of smart sensors for predictive maintenance are driving innovation.
- Regulatory Landscape: Stringent safety regulations regarding runway cleanliness and debris removal influence product design and material selection. Compliance costs represent a significant factor for market players.
- Substitute Products: While no direct substitutes exist, alternative cleaning methods like vacuum systems are gaining traction in niche applications.
- End-User Profiles: The report examines the detailed needs of both military and civilian airports, highlighting differing demands based on operational intensity and maintenance budgets.
- M&A Activity: The past five years have witnessed xx M&A deals in the airport runway brush market, with a total value of approximately xx million USD, primarily driven by strategic acquisitions to expand product portfolios and geographic reach.
Airport Runway Brush Industry Evolution
This section analyzes the historical and projected growth trajectory of the airport runway brush market. The market experienced a Compound Annual Growth Rate (CAGR) of xx% during the historical period (2019-2024), driven by factors including rising air passenger traffic, increasing runway maintenance needs at airports globally, and an ongoing shift towards more automated maintenance practices. The forecast period (2025-2033) is expected to witness a CAGR of xx%, fuelled by technological advancements in brush materials and designs, along with the growing adoption of sophisticated runway maintenance strategies that prioritize safety and operational efficiency. This growth will be particularly pronounced in the Asia-Pacific region, driven by increasing airport infrastructure development and modernization projects. The adoption of automated runway cleaning systems and the development of more robust and durable brushes are key technological advancements that are contributing to this growth. Consumer demand is increasingly focused on enhanced cleaning efficiency, reduced downtime, and extended product lifespan.
Leading Regions, Countries, or Segments in Airport Runway Brush
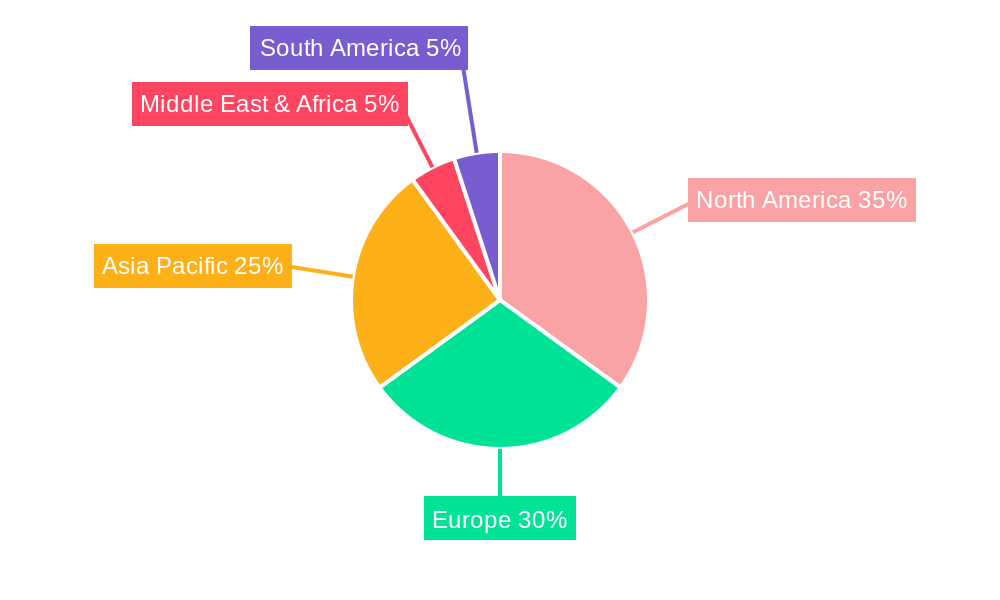
The North American region currently holds the largest market share in the airport runway brush market, followed by Europe.
Key Drivers:
- North America: High density of airports, stringent safety regulations, and significant investments in airport infrastructure are key factors driving market growth.
- Europe: Similar to North America, Europe benefits from a large number of airports and stringent safety regulations, alongside government initiatives focused on promoting sustainable aviation practices.
- Asia-Pacific: Rapid growth in air travel, significant airport construction projects, and increasing government investments in upgrading airport infrastructure are expected to drive substantial market growth in this region during the forecast period.
Segment Dominance:
- Application: Civilian airports currently dominate the market due to higher numbers and greater operational intensity compared to military airports. However, military airports present a niche segment with substantial potential.
- Type: Ring-type brushes hold the largest market share due to their widespread use and adaptability in various runway cleaning applications. Cassette-type brushes are gaining traction due to their modularity and ease of maintenance.
Airport Runway Brush Product Innovations
Recent innovations focus on enhancing brush durability, cleaning efficiency, and reducing environmental impact. New materials like high-performance polymers offer improved wear resistance and longer lifespan. Integrated sensor technologies allow for real-time monitoring of brush performance and predictive maintenance. Designs incorporating optimized bristle configurations improve debris removal and reduce surface damage. These advancements are directly contributing to cost savings and enhanced operational efficiency for airport operators.
Propelling Factors for Airport Runway Brush Growth
Several factors drive the growth of the airport runway brush market. Increased air passenger traffic necessitates more frequent runway cleaning. Stringent safety regulations mandate maintaining high standards of runway cleanliness. Advancements in brush technology lead to more efficient and cost-effective cleaning solutions. Government investments in airport infrastructure upgrades further fuel demand. Growing adoption of automated runway cleaning systems is also a contributing factor.
Obstacles in the Airport Runway Brush Market
The market faces challenges including supply chain disruptions impacting raw material availability and manufacturing costs. Fluctuations in global commodity prices can increase production costs. Intense competition among established players and emerging companies creates price pressures. Strict environmental regulations may impact material choices and manufacturing processes. These factors can potentially constrain market growth in the short term.
Future Opportunities in Airport Runway Brush
Emerging opportunities include expanding into new markets in developing countries, developing more sustainable and eco-friendly brush materials, and integrating advanced technologies like AI and machine learning for optimized cleaning. The increasing focus on reducing carbon emissions in the aviation industry is creating opportunities for the development of low-impact cleaning solutions.
Major Players in the Airport Runway Brush Ecosystem
- KOTI Group
- MB Companies
- Sajas Group
- Weber Bürstensysteme
- SIB Products
- TeCsolum Industrial Brushes
- United Rotary Brush Corporation
- Anhui Zhenda Brush Industry
- Anhui Union Brush Industry
Key Developments in Airport Runway Brush Industry
- 2022 Q4: KOTI Group launched a new line of environmentally friendly airport runway brushes.
- 2023 Q1: MB Companies acquired a smaller brush manufacturer, expanding its market reach.
- 2023 Q3: Weber Bürstensysteme introduced a new sensor-integrated brush system for predictive maintenance.
- (Further developments can be added as available)
Strategic Airport Runway Brush Market Forecast
The airport runway brush market is poised for substantial growth over the next decade, driven by increasing air travel, stringent safety regulations, technological advancements, and infrastructure development. Continued innovation in materials and technology, combined with expanding global demand, will create significant opportunities for market players. The market is anticipated to reach xx million USD by 2033, representing a significant expansion from its current size. Strategic partnerships and investments in research and development will be key success factors for businesses operating in this sector.
Airport Runway Brush Segmentation
-
1. Application
- 1.1. Military Airport
- 1.2. Civilian Airport
-
2. Types
- 2.1. Ring Type
- 2.2. Cassette Type
- 2.3. Others
Airport Runway Brush Segmentation By Geography
-
1. North America
- 1.1. United States
- 1.2. Canada
- 1.3. Mexico
-
2. South America
- 2.1. Brazil
- 2.2. Argentina
- 2.3. Rest of South America
-
3. Europe
- 3.1. United Kingdom
- 3.2. Germany
- 3.3. France
- 3.4. Italy
- 3.5. Spain
- 3.6. Russia
- 3.7. Benelux
- 3.8. Nordics
- 3.9. Rest of Europe
-
4. Middle East & Africa
- 4.1. Turkey
- 4.2. Israel
- 4.3. GCC
- 4.4. North Africa
- 4.5. South Africa
- 4.6. Rest of Middle East & Africa
-
5. Asia Pacific
- 5.1. China
- 5.2. India
- 5.3. Japan
- 5.4. South Korea
- 5.5. ASEAN
- 5.6. Oceania
- 5.7. Rest of Asia Pacific
Airport Runway Brush Regional Market Share
Geographic Coverage of Airport Runway Brush
Airport Runway Brush REPORT HIGHLIGHTS
| Aspects | Details |
|---|---|
| Study Period | 2020-2034 |
| Base Year | 2025 |
| Estimated Year | 2026 |
| Forecast Period | 2026-2034 |
| Historical Period | 2020-2025 |
| Growth Rate | CAGR of 5.33% from 2020-2034 |
| Segmentation |
|
Table of Contents
- 1. Introduction
- 1.1. Research Scope
- 1.2. Market Segmentation
- 1.3. Research Objective
- 1.4. Definitions and Assumptions
- 2. Executive Summary
- 2.1. Market Snapshot
- 3. Market Dynamics
- 3.1. Market Drivers
- 3.2. Market Restrains
- 3.3. Market Trends
- 3.4. Market Opportunities
- 4. Market Factor Analysis
- 4.1. Porters Five Forces
- 4.1.1. Bargaining Power of Suppliers
- 4.1.2. Bargaining Power of Buyers
- 4.1.3. Threat of New Entrants
- 4.1.4. Threat of Substitutes
- 4.1.5. Competitive Rivalry
- 4.2. PESTEL analysis
- 4.3. BCG Analysis
- 4.3.1. Stars (High Growth, High Market Share)
- 4.3.2. Cash Cows (Low Growth, High Market Share)
- 4.3.3. Question Mark (High Growth, Low Market Share)
- 4.3.4. Dogs (Low Growth, Low Market Share)
- 4.4. Ansoff Matrix Analysis
- 4.5. Supply Chain Analysis
- 4.6. Regulatory Landscape
- 4.7. Current Market Potential and Opportunity Assessment (TAM–SAM–SOM Framework)
- 4.8. DMV Analyst Note
- 4.1. Porters Five Forces
- 5. Market Analysis, Insights and Forecast 2021-2033
- 5.1. Market Analysis, Insights and Forecast - by Application
- 5.1.1. Military Airport
- 5.1.2. Civilian Airport
- 5.2. Market Analysis, Insights and Forecast - by Types
- 5.2.1. Ring Type
- 5.2.2. Cassette Type
- 5.2.3. Others
- 5.3. Market Analysis, Insights and Forecast - by Region
- 5.3.1. North America
- 5.3.2. South America
- 5.3.3. Europe
- 5.3.4. Middle East & Africa
- 5.3.5. Asia Pacific
- 5.1. Market Analysis, Insights and Forecast - by Application
- 6. Global Airport Runway Brush Analysis, Insights and Forecast, 2021-2033
- 6.1. Market Analysis, Insights and Forecast - by Application
- 6.1.1. Military Airport
- 6.1.2. Civilian Airport
- 6.2. Market Analysis, Insights and Forecast - by Types
- 6.2.1. Ring Type
- 6.2.2. Cassette Type
- 6.2.3. Others
- 6.1. Market Analysis, Insights and Forecast - by Application
- 7. North America Airport Runway Brush Analysis, Insights and Forecast, 2020-2032
- 7.1. Market Analysis, Insights and Forecast - by Application
- 7.1.1. Military Airport
- 7.1.2. Civilian Airport
- 7.2. Market Analysis, Insights and Forecast - by Types
- 7.2.1. Ring Type
- 7.2.2. Cassette Type
- 7.2.3. Others
- 7.1. Market Analysis, Insights and Forecast - by Application
- 8. South America Airport Runway Brush Analysis, Insights and Forecast, 2020-2032
- 8.1. Market Analysis, Insights and Forecast - by Application
- 8.1.1. Military Airport
- 8.1.2. Civilian Airport
- 8.2. Market Analysis, Insights and Forecast - by Types
- 8.2.1. Ring Type
- 8.2.2. Cassette Type
- 8.2.3. Others
- 8.1. Market Analysis, Insights and Forecast - by Application
- 9. Europe Airport Runway Brush Analysis, Insights and Forecast, 2020-2032
- 9.1. Market Analysis, Insights and Forecast - by Application
- 9.1.1. Military Airport
- 9.1.2. Civilian Airport
- 9.2. Market Analysis, Insights and Forecast - by Types
- 9.2.1. Ring Type
- 9.2.2. Cassette Type
- 9.2.3. Others
- 9.1. Market Analysis, Insights and Forecast - by Application
- 10. Middle East & Africa Airport Runway Brush Analysis, Insights and Forecast, 2020-2032
- 10.1. Market Analysis, Insights and Forecast - by Application
- 10.1.1. Military Airport
- 10.1.2. Civilian Airport
- 10.2. Market Analysis, Insights and Forecast - by Types
- 10.2.1. Ring Type
- 10.2.2. Cassette Type
- 10.2.3. Others
- 10.1. Market Analysis, Insights and Forecast - by Application
- 11. Asia Pacific Airport Runway Brush Analysis, Insights and Forecast, 2020-2032
- 11.1. Market Analysis, Insights and Forecast - by Application
- 11.1.1. Military Airport
- 11.1.2. Civilian Airport
- 11.2. Market Analysis, Insights and Forecast - by Types
- 11.2.1. Ring Type
- 11.2.2. Cassette Type
- 11.2.3. Others
- 11.1. Market Analysis, Insights and Forecast - by Application
- 12. Competitive Analysis
- 12.1. Company Profiles
- 12.1.1 KOTI Group
- 12.1.1.1. Company Overview
- 12.1.1.2. Products
- 12.1.1.3. Company Financials
- 12.1.1.4. SWOT Analysis
- 12.1.2 MB Companies
- 12.1.2.1. Company Overview
- 12.1.2.2. Products
- 12.1.2.3. Company Financials
- 12.1.2.4. SWOT Analysis
- 12.1.3 Sajas Group
- 12.1.3.1. Company Overview
- 12.1.3.2. Products
- 12.1.3.3. Company Financials
- 12.1.3.4. SWOT Analysis
- 12.1.4 Weber Bürstensysteme
- 12.1.4.1. Company Overview
- 12.1.4.2. Products
- 12.1.4.3. Company Financials
- 12.1.4.4. SWOT Analysis
- 12.1.5 SIB Products
- 12.1.5.1. Company Overview
- 12.1.5.2. Products
- 12.1.5.3. Company Financials
- 12.1.5.4. SWOT Analysis
- 12.1.6 TeCsolum Industrial Brushes
- 12.1.6.1. Company Overview
- 12.1.6.2. Products
- 12.1.6.3. Company Financials
- 12.1.6.4. SWOT Analysis
- 12.1.7 United Rotary Brush Corporation
- 12.1.7.1. Company Overview
- 12.1.7.2. Products
- 12.1.7.3. Company Financials
- 12.1.7.4. SWOT Analysis
- 12.1.8 Anhui Zhenda Brush Industry
- 12.1.8.1. Company Overview
- 12.1.8.2. Products
- 12.1.8.3. Company Financials
- 12.1.8.4. SWOT Analysis
- 12.1.9 Anhui Union Brush Industry
- 12.1.9.1. Company Overview
- 12.1.9.2. Products
- 12.1.9.3. Company Financials
- 12.1.9.4. SWOT Analysis
- 12.1.1 KOTI Group
- 12.2. Market Entropy
- 12.2.1 Company's Key Areas Served
- 12.2.2 Recent Developments
- 12.3. Company Market Share Analysis 2025
- 12.3.1 Top 5 Companies Market Share Analysis
- 12.3.2 Top 3 Companies Market Share Analysis
- 12.4. List of Potential Customers
- 13. Research Methodology
List of Figures
- Figure 1: Global Airport Runway Brush Revenue Breakdown (undefined, %) by Region 2025 & 2033
- Figure 2: Global Airport Runway Brush Volume Breakdown (K, %) by Region 2025 & 2033
- Figure 3: North America Airport Runway Brush Revenue (undefined), by Application 2025 & 2033
- Figure 4: North America Airport Runway Brush Volume (K), by Application 2025 & 2033
- Figure 5: North America Airport Runway Brush Revenue Share (%), by Application 2025 & 2033
- Figure 6: North America Airport Runway Brush Volume Share (%), by Application 2025 & 2033
- Figure 7: North America Airport Runway Brush Revenue (undefined), by Types 2025 & 2033
- Figure 8: North America Airport Runway Brush Volume (K), by Types 2025 & 2033
- Figure 9: North America Airport Runway Brush Revenue Share (%), by Types 2025 & 2033
- Figure 10: North America Airport Runway Brush Volume Share (%), by Types 2025 & 2033
- Figure 11: North America Airport Runway Brush Revenue (undefined), by Country 2025 & 2033
- Figure 12: North America Airport Runway Brush Volume (K), by Country 2025 & 2033
- Figure 13: North America Airport Runway Brush Revenue Share (%), by Country 2025 & 2033
- Figure 14: North America Airport Runway Brush Volume Share (%), by Country 2025 & 2033
- Figure 15: South America Airport Runway Brush Revenue (undefined), by Application 2025 & 2033
- Figure 16: South America Airport Runway Brush Volume (K), by Application 2025 & 2033
- Figure 17: South America Airport Runway Brush Revenue Share (%), by Application 2025 & 2033
- Figure 18: South America Airport Runway Brush Volume Share (%), by Application 2025 & 2033
- Figure 19: South America Airport Runway Brush Revenue (undefined), by Types 2025 & 2033
- Figure 20: South America Airport Runway Brush Volume (K), by Types 2025 & 2033
- Figure 21: South America Airport Runway Brush Revenue Share (%), by Types 2025 & 2033
- Figure 22: South America Airport Runway Brush Volume Share (%), by Types 2025 & 2033
- Figure 23: South America Airport Runway Brush Revenue (undefined), by Country 2025 & 2033
- Figure 24: South America Airport Runway Brush Volume (K), by Country 2025 & 2033
- Figure 25: South America Airport Runway Brush Revenue Share (%), by Country 2025 & 2033
- Figure 26: South America Airport Runway Brush Volume Share (%), by Country 2025 & 2033
- Figure 27: Europe Airport Runway Brush Revenue (undefined), by Application 2025 & 2033
- Figure 28: Europe Airport Runway Brush Volume (K), by Application 2025 & 2033
- Figure 29: Europe Airport Runway Brush Revenue Share (%), by Application 2025 & 2033
- Figure 30: Europe Airport Runway Brush Volume Share (%), by Application 2025 & 2033
- Figure 31: Europe Airport Runway Brush Revenue (undefined), by Types 2025 & 2033
- Figure 32: Europe Airport Runway Brush Volume (K), by Types 2025 & 2033
- Figure 33: Europe Airport Runway Brush Revenue Share (%), by Types 2025 & 2033
- Figure 34: Europe Airport Runway Brush Volume Share (%), by Types 2025 & 2033
- Figure 35: Europe Airport Runway Brush Revenue (undefined), by Country 2025 & 2033
- Figure 36: Europe Airport Runway Brush Volume (K), by Country 2025 & 2033
- Figure 37: Europe Airport Runway Brush Revenue Share (%), by Country 2025 & 2033
- Figure 38: Europe Airport Runway Brush Volume Share (%), by Country 2025 & 2033
- Figure 39: Middle East & Africa Airport Runway Brush Revenue (undefined), by Application 2025 & 2033
- Figure 40: Middle East & Africa Airport Runway Brush Volume (K), by Application 2025 & 2033
- Figure 41: Middle East & Africa Airport Runway Brush Revenue Share (%), by Application 2025 & 2033
- Figure 42: Middle East & Africa Airport Runway Brush Volume Share (%), by Application 2025 & 2033
- Figure 43: Middle East & Africa Airport Runway Brush Revenue (undefined), by Types 2025 & 2033
- Figure 44: Middle East & Africa Airport Runway Brush Volume (K), by Types 2025 & 2033
- Figure 45: Middle East & Africa Airport Runway Brush Revenue Share (%), by Types 2025 & 2033
- Figure 46: Middle East & Africa Airport Runway Brush Volume Share (%), by Types 2025 & 2033
- Figure 47: Middle East & Africa Airport Runway Brush Revenue (undefined), by Country 2025 & 2033
- Figure 48: Middle East & Africa Airport Runway Brush Volume (K), by Country 2025 & 2033
- Figure 49: Middle East & Africa Airport Runway Brush Revenue Share (%), by Country 2025 & 2033
- Figure 50: Middle East & Africa Airport Runway Brush Volume Share (%), by Country 2025 & 2033
- Figure 51: Asia Pacific Airport Runway Brush Revenue (undefined), by Application 2025 & 2033
- Figure 52: Asia Pacific Airport Runway Brush Volume (K), by Application 2025 & 2033
- Figure 53: Asia Pacific Airport Runway Brush Revenue Share (%), by Application 2025 & 2033
- Figure 54: Asia Pacific Airport Runway Brush Volume Share (%), by Application 2025 & 2033
- Figure 55: Asia Pacific Airport Runway Brush Revenue (undefined), by Types 2025 & 2033
- Figure 56: Asia Pacific Airport Runway Brush Volume (K), by Types 2025 & 2033
- Figure 57: Asia Pacific Airport Runway Brush Revenue Share (%), by Types 2025 & 2033
- Figure 58: Asia Pacific Airport Runway Brush Volume Share (%), by Types 2025 & 2033
- Figure 59: Asia Pacific Airport Runway Brush Revenue (undefined), by Country 2025 & 2033
- Figure 60: Asia Pacific Airport Runway Brush Volume (K), by Country 2025 & 2033
- Figure 61: Asia Pacific Airport Runway Brush Revenue Share (%), by Country 2025 & 2033
- Figure 62: Asia Pacific Airport Runway Brush Volume Share (%), by Country 2025 & 2033
List of Tables
- Table 1: Global Airport Runway Brush Revenue undefined Forecast, by Application 2020 & 2033
- Table 2: Global Airport Runway Brush Volume K Forecast, by Application 2020 & 2033
- Table 3: Global Airport Runway Brush Revenue undefined Forecast, by Types 2020 & 2033
- Table 4: Global Airport Runway Brush Volume K Forecast, by Types 2020 & 2033
- Table 5: Global Airport Runway Brush Revenue undefined Forecast, by Region 2020 & 2033
- Table 6: Global Airport Runway Brush Volume K Forecast, by Region 2020 & 2033
- Table 7: Global Airport Runway Brush Revenue undefined Forecast, by Application 2020 & 2033
- Table 8: Global Airport Runway Brush Volume K Forecast, by Application 2020 & 2033
- Table 9: Global Airport Runway Brush Revenue undefined Forecast, by Types 2020 & 2033
- Table 10: Global Airport Runway Brush Volume K Forecast, by Types 2020 & 2033
- Table 11: Global Airport Runway Brush Revenue undefined Forecast, by Country 2020 & 2033
- Table 12: Global Airport Runway Brush Volume K Forecast, by Country 2020 & 2033
- Table 13: United States Airport Runway Brush Revenue (undefined) Forecast, by Application 2020 & 2033
- Table 14: United States Airport Runway Brush Volume (K) Forecast, by Application 2020 & 2033
- Table 15: Canada Airport Runway Brush Revenue (undefined) Forecast, by Application 2020 & 2033
- Table 16: Canada Airport Runway Brush Volume (K) Forecast, by Application 2020 & 2033
- Table 17: Mexico Airport Runway Brush Revenue (undefined) Forecast, by Application 2020 & 2033
- Table 18: Mexico Airport Runway Brush Volume (K) Forecast, by Application 2020 & 2033
- Table 19: Global Airport Runway Brush Revenue undefined Forecast, by Application 2020 & 2033
- Table 20: Global Airport Runway Brush Volume K Forecast, by Application 2020 & 2033
- Table 21: Global Airport Runway Brush Revenue undefined Forecast, by Types 2020 & 2033
- Table 22: Global Airport Runway Brush Volume K Forecast, by Types 2020 & 2033
- Table 23: Global Airport Runway Brush Revenue undefined Forecast, by Country 2020 & 2033
- Table 24: Global Airport Runway Brush Volume K Forecast, by Country 2020 & 2033
- Table 25: Brazil Airport Runway Brush Revenue (undefined) Forecast, by Application 2020 & 2033
- Table 26: Brazil Airport Runway Brush Volume (K) Forecast, by Application 2020 & 2033
- Table 27: Argentina Airport Runway Brush Revenue (undefined) Forecast, by Application 2020 & 2033
- Table 28: Argentina Airport Runway Brush Volume (K) Forecast, by Application 2020 & 2033
- Table 29: Rest of South America Airport Runway Brush Revenue (undefined) Forecast, by Application 2020 & 2033
- Table 30: Rest of South America Airport Runway Brush Volume (K) Forecast, by Application 2020 & 2033
- Table 31: Global Airport Runway Brush Revenue undefined Forecast, by Application 2020 & 2033
- Table 32: Global Airport Runway Brush Volume K Forecast, by Application 2020 & 2033
- Table 33: Global Airport Runway Brush Revenue undefined Forecast, by Types 2020 & 2033
- Table 34: Global Airport Runway Brush Volume K Forecast, by Types 2020 & 2033
- Table 35: Global Airport Runway Brush Revenue undefined Forecast, by Country 2020 & 2033
- Table 36: Global Airport Runway Brush Volume K Forecast, by Country 2020 & 2033
- Table 37: United Kingdom Airport Runway Brush Revenue (undefined) Forecast, by Application 2020 & 2033
- Table 38: United Kingdom Airport Runway Brush Volume (K) Forecast, by Application 2020 & 2033
- Table 39: Germany Airport Runway Brush Revenue (undefined) Forecast, by Application 2020 & 2033
- Table 40: Germany Airport Runway Brush Volume (K) Forecast, by Application 2020 & 2033
- Table 41: France Airport Runway Brush Revenue (undefined) Forecast, by Application 2020 & 2033
- Table 42: France Airport Runway Brush Volume (K) Forecast, by Application 2020 & 2033
- Table 43: Italy Airport Runway Brush Revenue (undefined) Forecast, by Application 2020 & 2033
- Table 44: Italy Airport Runway Brush Volume (K) Forecast, by Application 2020 & 2033
- Table 45: Spain Airport Runway Brush Revenue (undefined) Forecast, by Application 2020 & 2033
- Table 46: Spain Airport Runway Brush Volume (K) Forecast, by Application 2020 & 2033
- Table 47: Russia Airport Runway Brush Revenue (undefined) Forecast, by Application 2020 & 2033
- Table 48: Russia Airport Runway Brush Volume (K) Forecast, by Application 2020 & 2033
- Table 49: Benelux Airport Runway Brush Revenue (undefined) Forecast, by Application 2020 & 2033
- Table 50: Benelux Airport Runway Brush Volume (K) Forecast, by Application 2020 & 2033
- Table 51: Nordics Airport Runway Brush Revenue (undefined) Forecast, by Application 2020 & 2033
- Table 52: Nordics Airport Runway Brush Volume (K) Forecast, by Application 2020 & 2033
- Table 53: Rest of Europe Airport Runway Brush Revenue (undefined) Forecast, by Application 2020 & 2033
- Table 54: Rest of Europe Airport Runway Brush Volume (K) Forecast, by Application 2020 & 2033
- Table 55: Global Airport Runway Brush Revenue undefined Forecast, by Application 2020 & 2033
- Table 56: Global Airport Runway Brush Volume K Forecast, by Application 2020 & 2033
- Table 57: Global Airport Runway Brush Revenue undefined Forecast, by Types 2020 & 2033
- Table 58: Global Airport Runway Brush Volume K Forecast, by Types 2020 & 2033
- Table 59: Global Airport Runway Brush Revenue undefined Forecast, by Country 2020 & 2033
- Table 60: Global Airport Runway Brush Volume K Forecast, by Country 2020 & 2033
- Table 61: Turkey Airport Runway Brush Revenue (undefined) Forecast, by Application 2020 & 2033
- Table 62: Turkey Airport Runway Brush Volume (K) Forecast, by Application 2020 & 2033
- Table 63: Israel Airport Runway Brush Revenue (undefined) Forecast, by Application 2020 & 2033
- Table 64: Israel Airport Runway Brush Volume (K) Forecast, by Application 2020 & 2033
- Table 65: GCC Airport Runway Brush Revenue (undefined) Forecast, by Application 2020 & 2033
- Table 66: GCC Airport Runway Brush Volume (K) Forecast, by Application 2020 & 2033
- Table 67: North Africa Airport Runway Brush Revenue (undefined) Forecast, by Application 2020 & 2033
- Table 68: North Africa Airport Runway Brush Volume (K) Forecast, by Application 2020 & 2033
- Table 69: South Africa Airport Runway Brush Revenue (undefined) Forecast, by Application 2020 & 2033
- Table 70: South Africa Airport Runway Brush Volume (K) Forecast, by Application 2020 & 2033
- Table 71: Rest of Middle East & Africa Airport Runway Brush Revenue (undefined) Forecast, by Application 2020 & 2033
- Table 72: Rest of Middle East & Africa Airport Runway Brush Volume (K) Forecast, by Application 2020 & 2033
- Table 73: Global Airport Runway Brush Revenue undefined Forecast, by Application 2020 & 2033
- Table 74: Global Airport Runway Brush Volume K Forecast, by Application 2020 & 2033
- Table 75: Global Airport Runway Brush Revenue undefined Forecast, by Types 2020 & 2033
- Table 76: Global Airport Runway Brush Volume K Forecast, by Types 2020 & 2033
- Table 77: Global Airport Runway Brush Revenue undefined Forecast, by Country 2020 & 2033
- Table 78: Global Airport Runway Brush Volume K Forecast, by Country 2020 & 2033
- Table 79: China Airport Runway Brush Revenue (undefined) Forecast, by Application 2020 & 2033
- Table 80: China Airport Runway Brush Volume (K) Forecast, by Application 2020 & 2033
- Table 81: India Airport Runway Brush Revenue (undefined) Forecast, by Application 2020 & 2033
- Table 82: India Airport Runway Brush Volume (K) Forecast, by Application 2020 & 2033
- Table 83: Japan Airport Runway Brush Revenue (undefined) Forecast, by Application 2020 & 2033
- Table 84: Japan Airport Runway Brush Volume (K) Forecast, by Application 2020 & 2033
- Table 85: South Korea Airport Runway Brush Revenue (undefined) Forecast, by Application 2020 & 2033
- Table 86: South Korea Airport Runway Brush Volume (K) Forecast, by Application 2020 & 2033
- Table 87: ASEAN Airport Runway Brush Revenue (undefined) Forecast, by Application 2020 & 2033
- Table 88: ASEAN Airport Runway Brush Volume (K) Forecast, by Application 2020 & 2033
- Table 89: Oceania Airport Runway Brush Revenue (undefined) Forecast, by Application 2020 & 2033
- Table 90: Oceania Airport Runway Brush Volume (K) Forecast, by Application 2020 & 2033
- Table 91: Rest of Asia Pacific Airport Runway Brush Revenue (undefined) Forecast, by Application 2020 & 2033
- Table 92: Rest of Asia Pacific Airport Runway Brush Volume (K) Forecast, by Application 2020 & 2033
Frequently Asked Questions
1. What is the projected Compound Annual Growth Rate (CAGR) of the Airport Runway Brush?
The projected CAGR is approximately 5.33%.
2. Which companies are prominent players in the Airport Runway Brush?
Key companies in the market include KOTI Group, MB Companies, Sajas Group, Weber Bürstensysteme, SIB Products, TeCsolum Industrial Brushes, United Rotary Brush Corporation, Anhui Zhenda Brush Industry, Anhui Union Brush Industry.
3. What are the main segments of the Airport Runway Brush?
The market segments include Application, Types.
4. Can you provide details about the market size?
The market size is estimated to be USD XXX N/A as of 2022.
5. What are some drivers contributing to market growth?
N/A
6. What are the notable trends driving market growth?
N/A
7. Are there any restraints impacting market growth?
N/A
8. Can you provide examples of recent developments in the market?
N/A
9. What pricing options are available for accessing the report?
Pricing options include single-user, multi-user, and enterprise licenses priced at USD 3950.00, USD 5925.00, and USD 7900.00 respectively.
10. Is the market size provided in terms of value or volume?
The market size is provided in terms of value, measured in N/A and volume, measured in K.
11. Are there any specific market keywords associated with the report?
Yes, the market keyword associated with the report is "Airport Runway Brush," which aids in identifying and referencing the specific market segment covered.
12. How do I determine which pricing option suits my needs best?
The pricing options vary based on user requirements and access needs. Individual users may opt for single-user licenses, while businesses requiring broader access may choose multi-user or enterprise licenses for cost-effective access to the report.
13. Are there any additional resources or data provided in the Airport Runway Brush report?
While the report offers comprehensive insights, it's advisable to review the specific contents or supplementary materials provided to ascertain if additional resources or data are available.
14. How can I stay updated on further developments or reports in the Airport Runway Brush?
To stay informed about further developments, trends, and reports in the Airport Runway Brush, consider subscribing to industry newsletters, following relevant companies and organizations, or regularly checking reputable industry news sources and publications.
Methodology
Step 1 - Identification of Relevant Samples Size from Population Database


Step 2 - Approaches for Defining Global Market Size (Value, Volume* & Price*)

Note*: In applicable scenarios
Step 3 - Data Sources
Primary Research
- Web Analytics
- Survey Reports
- Research Institute
- Latest Research Reports
- Opinion Leaders
Secondary Research
- Annual Reports
- White Paper
- Latest Press Release
- Industry Association
- Paid Database
- Investor Presentations

Step 4 - Data Triangulation
Involves using different sources of information in order to increase the validity of a study
These sources are likely to be stakeholders in a program - participants, other researchers, program staff, other community members, and so on.
Then we put all data in single framework & apply various statistical tools to find out the dynamic on the market.
During the analysis stage, feedback from the stakeholder groups would be compared to determine areas of agreement as well as areas of divergence