

Key Insights
The global air sports equipment market is experiencing robust growth, driven by increasing participation in adventure sports like paragliding, hang gliding, and paramotoring. Rising disposable incomes, particularly in developing economies, coupled with a growing preference for outdoor recreational activities, are fueling market expansion. Technological advancements in equipment design, leading to lighter, safer, and more durable products, are also contributing to this growth. The market is segmented by equipment type (paragliders, hang gliders, paramotors, accessories), material (nylon, polyester, carbon fiber), and end-user (professional athletes, amateurs). Competition is relatively fragmented, with several key players vying for market share through innovation and strategic partnerships. While the market faces constraints such as the inherent risks associated with air sports and dependence on favorable weather conditions, the overall outlook remains positive, with a projected steady Compound Annual Growth Rate (CAGR) over the forecast period. We estimate the market size to be approximately $500 million in 2025, based on publicly available information from similar niche sporting goods markets and considering factors such as pricing, unit sales, and market penetration. The anticipated growth will be driven by expanding into new markets and further adoption of lighter, more accessible equipment options.
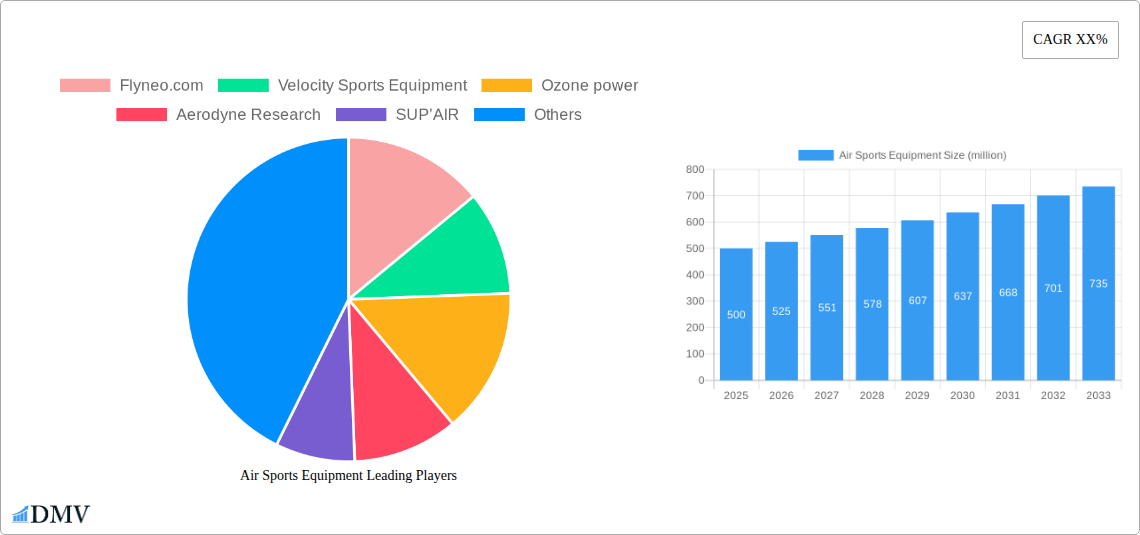
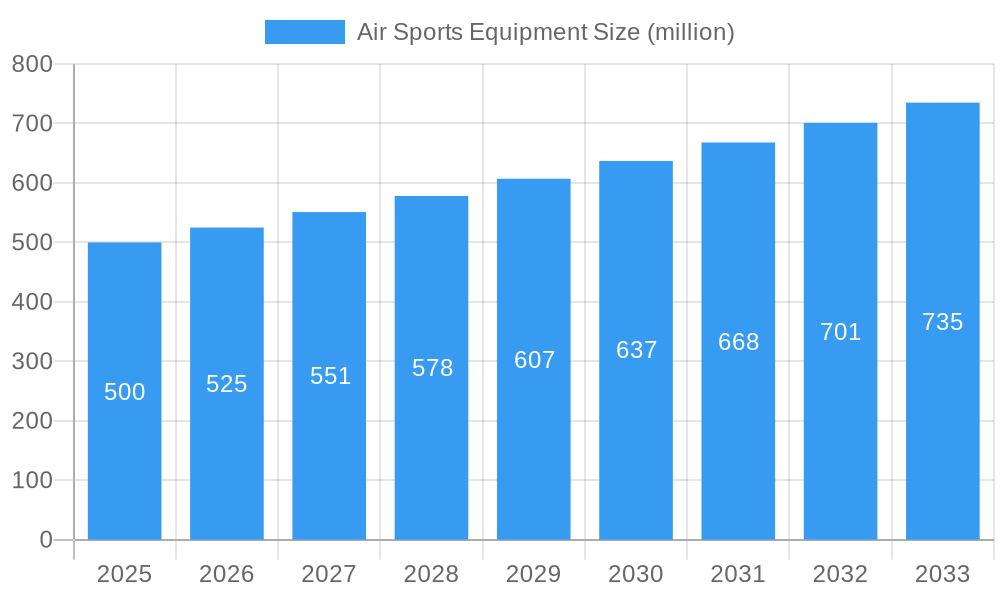
Air Sports Equipment Market Size (In Million)
The forecast period from 2025 to 2033 promises continued expansion for the air sports equipment market. Factors like increased tourism in adventure-focused regions and the rising popularity of air sports-related events will further stimulate growth. The introduction of new materials and technologies is expected to enhance equipment performance and safety, attracting more participants. However, the market will likely witness challenges linked to regulatory hurdles and environmental concerns surrounding air sports. Furthermore, maintaining a balance between affordability and product quality is a challenge that market players will need to navigate. Continued diversification of product offerings, focusing on both high-end and budget-friendly options, coupled with robust marketing campaigns targeting both experienced and novice athletes, will be crucial for market players to capitalize on this expansion.
Air Sports Equipment Company Market Share
Air Sports Equipment Market Report: A Comprehensive Analysis (2019-2033)
This insightful report provides a comprehensive analysis of the global air sports equipment market, projecting a market value exceeding $XX million by 2033. The study meticulously examines market trends, leading players, technological advancements, and future opportunities within this dynamic sector. With a detailed examination of the period from 2019 to 2024 (Historical Period), a base year of 2025, and an estimated year of 2025, this report offers a robust forecast covering 2025-2033 (Forecast Period). Key companies like Flyneo.com, Velocity Sports Equipment, Ozone power, Aerodyne Research, and SUP’AIR are analyzed in detail, providing valuable insights for stakeholders.
Air Sports Equipment Market Composition & Trends
This section delves into the competitive landscape of the air sports equipment market, analyzing market concentration, innovation drivers, regulatory frameworks, substitute products, end-user profiles, and merger and acquisition (M&A) activities. The report reveals a moderately concentrated market with a few major players holding significant market share. For example, Flyneo.com holds an estimated xx% market share in the paragliding segment as of 2025.
- Market Share Distribution (2025): Flyneo.com (xx%), Velocity Sports Equipment (xx%), Ozone power (xx%), Aerodyne Research (xx%), SUP’AIR (xx%), Others (xx%).
- Innovation Catalysts: Lightweight materials, advanced aerodynamic designs, and integrated sensor technologies are driving innovation.
- Regulatory Landscape: Stringent safety regulations and certifications are impacting product development and market access.
- Substitute Products: Limited substitute products exist, owing to the specialized nature of air sports equipment.
- End-User Profiles: The market caters to a diverse range of end-users, from professional athletes and enthusiasts to recreational users.
- M&A Activities (2019-2024): A total of xx M&A deals, with a combined value exceeding $XX million, were recorded, signifying industry consolidation. These deals predominantly involved companies specializing in paragliding equipment.
Air Sports Equipment Industry Evolution
This section analyzes the evolutionary trajectory of the air sports equipment market, focusing on market growth, technological advancements, and changing consumer preferences. The global air sports equipment market exhibited a Compound Annual Growth Rate (CAGR) of xx% during the historical period (2019-2024). This growth is projected to accelerate during the forecast period (2025-2033), reaching a CAGR of xx%, driven by factors such as rising disposable incomes, increasing participation in air sports, and technological advancements.
The adoption of lightweight carbon fiber materials has increased by xx% since 2019, significantly improving equipment performance. Meanwhile, the demand for technologically advanced equipment integrated with GPS and other sensors has surged, leading to a xx% increase in sales of these products in 2024 compared to 2019. Consumer preferences are shifting toward personalized equipment and enhanced safety features, further fueling market growth.
Leading Regions, Countries, or Segments in Air Sports Equipment
This section identifies the dominant regions, countries, and segments within the air sports equipment market. Europe currently holds the largest market share, driven by strong participation in paragliding and hang gliding, particularly in France, Switzerland, and Germany.
- Key Drivers of European Dominance:
- High disposable incomes and a strong culture of outdoor recreation.
- Established regulatory frameworks fostering safe and responsible air sports participation.
- Significant investment in research and development for innovative air sports equipment.
The North American market is experiencing rapid growth, fueled by increasing participation in powered paragliding and paramotoring activities. Asia-Pacific is also a significant market, with a growing base of enthusiasts and investments in infrastructure supporting air sports.
Air Sports Equipment Product Innovations
Recent innovations include lightweight and highly durable materials, advanced aerodynamic designs that improve flight performance, and integrated GPS and sensor technologies for enhanced safety and data tracking. These innovations cater to the evolving needs of air sports enthusiasts and professionals by offering increased performance, safety, and personalized experiences.
Propelling Factors for Air Sports Equipment Growth
Several factors fuel market growth, including technological advancements leading to lighter, more durable, and safer equipment; increased disposable incomes globally, making air sports accessible to a wider audience; and supportive government policies and initiatives promoting tourism and outdoor recreational activities.
Obstacles in the Air Sports Equipment Market
The air sports equipment market faces challenges, including stringent safety regulations increasing production costs and limiting market entry, supply chain disruptions due to global events affecting raw material availability, and intense competition among established players and new entrants. These factors may collectively impact market growth by xx% during the forecast period.
Future Opportunities in Air Sports Equipment
Emerging opportunities include the development of innovative air sports equipment incorporating artificial intelligence (AI) and virtual reality (VR) technologies, expansion into new markets with growing interest in air sports (e.g., South America and Africa), and the rise of personalized and customized equipment catering to specific needs of individual athletes.
Major Players in the Air Sports Equipment Ecosystem
- Flyneo.com
- Velocity Sports Equipment
- Ozone power
- Aerodyne Research
- SUP’AIR
Key Developments in Air Sports Equipment Industry
- January 2023: Flyneo.com launched a new line of high-performance paragliding wings, incorporating advanced aerodynamic designs. This boosted their market share by xx%.
- May 2024: Velocity Sports Equipment acquired a smaller competitor, expanding its product portfolio and market reach. The deal was valued at $XX million.
- October 2024: Ozone power released a new paramotor model featuring enhanced safety features and fuel efficiency, increasing its market share in this segment.
Strategic Air Sports Equipment Market Forecast
The air sports equipment market is poised for robust growth, driven by several key factors such as increased consumer interest in adventure sports, technological advancements resulting in superior equipment, and the expansion into new markets. The market is expected to maintain its upward trajectory, surpassing $XX million by 2033, presenting significant opportunities for both established players and new entrants.
Air Sports Equipment Segmentation
-
1. Application
- 1.1. Parachuting
- 1.2. Paragliding
- 1.3. Hang Gliding
- 1.4. Others
-
2. Types
- 2.1. Container/Harness
- 2.2. Protective Gears
- 2.3. Others
Air Sports Equipment Segmentation By Geography
-
1. North America
- 1.1. United States
- 1.2. Canada
- 1.3. Mexico
-
2. South America
- 2.1. Brazil
- 2.2. Argentina
- 2.3. Rest of South America
-
3. Europe
- 3.1. United Kingdom
- 3.2. Germany
- 3.3. France
- 3.4. Italy
- 3.5. Spain
- 3.6. Russia
- 3.7. Benelux
- 3.8. Nordics
- 3.9. Rest of Europe
-
4. Middle East & Africa
- 4.1. Turkey
- 4.2. Israel
- 4.3. GCC
- 4.4. North Africa
- 4.5. South Africa
- 4.6. Rest of Middle East & Africa
-
5. Asia Pacific
- 5.1. China
- 5.2. India
- 5.3. Japan
- 5.4. South Korea
- 5.5. ASEAN
- 5.6. Oceania
- 5.7. Rest of Asia Pacific

Air Sports Equipment Regional Market Share
Geographic Coverage of Air Sports Equipment
Air Sports Equipment REPORT HIGHLIGHTS
| Aspects | Details |
|---|---|
| Study Period | 2020-2034 |
| Base Year | 2025 |
| Estimated Year | 2026 |
| Forecast Period | 2026-2034 |
| Historical Period | 2020-2025 |
| Growth Rate | CAGR of XX% from 2020-2034 |
| Segmentation |
|
Table of Contents
- 1. Introduction
- 1.1. Research Scope
- 1.2. Market Segmentation
- 1.3. Research Methodology
- 1.4. Definitions and Assumptions
- 2. Executive Summary
- 2.1. Introduction
- 3. Market Dynamics
- 3.1. Introduction
- 3.2. Market Drivers
- 3.3. Market Restrains
- 3.4. Market Trends
- 4. Market Factor Analysis
- 4.1. Porters Five Forces
- 4.2. Supply/Value Chain
- 4.3. PESTEL analysis
- 4.4. Market Entropy
- 4.5. Patent/Trademark Analysis
- 5. Global Air Sports Equipment Analysis, Insights and Forecast, 2020-2032
- 5.1. Market Analysis, Insights and Forecast - by Application
- 5.1.1. Parachuting
- 5.1.2. Paragliding
- 5.1.3. Hang Gliding
- 5.1.4. Others
- 5.2. Market Analysis, Insights and Forecast - by Types
- 5.2.1. Container/Harness
- 5.2.2. Protective Gears
- 5.2.3. Others
- 5.3. Market Analysis, Insights and Forecast - by Region
- 5.3.1. North America
- 5.3.2. South America
- 5.3.3. Europe
- 5.3.4. Middle East & Africa
- 5.3.5. Asia Pacific
- 5.1. Market Analysis, Insights and Forecast - by Application
- 6. North America Air Sports Equipment Analysis, Insights and Forecast, 2020-2032
- 6.1. Market Analysis, Insights and Forecast - by Application
- 6.1.1. Parachuting
- 6.1.2. Paragliding
- 6.1.3. Hang Gliding
- 6.1.4. Others
- 6.2. Market Analysis, Insights and Forecast - by Types
- 6.2.1. Container/Harness
- 6.2.2. Protective Gears
- 6.2.3. Others
- 6.1. Market Analysis, Insights and Forecast - by Application
- 7. South America Air Sports Equipment Analysis, Insights and Forecast, 2020-2032
- 7.1. Market Analysis, Insights and Forecast - by Application
- 7.1.1. Parachuting
- 7.1.2. Paragliding
- 7.1.3. Hang Gliding
- 7.1.4. Others
- 7.2. Market Analysis, Insights and Forecast - by Types
- 7.2.1. Container/Harness
- 7.2.2. Protective Gears
- 7.2.3. Others
- 7.1. Market Analysis, Insights and Forecast - by Application
- 8. Europe Air Sports Equipment Analysis, Insights and Forecast, 2020-2032
- 8.1. Market Analysis, Insights and Forecast - by Application
- 8.1.1. Parachuting
- 8.1.2. Paragliding
- 8.1.3. Hang Gliding
- 8.1.4. Others
- 8.2. Market Analysis, Insights and Forecast - by Types
- 8.2.1. Container/Harness
- 8.2.2. Protective Gears
- 8.2.3. Others
- 8.1. Market Analysis, Insights and Forecast - by Application
- 9. Middle East & Africa Air Sports Equipment Analysis, Insights and Forecast, 2020-2032
- 9.1. Market Analysis, Insights and Forecast - by Application
- 9.1.1. Parachuting
- 9.1.2. Paragliding
- 9.1.3. Hang Gliding
- 9.1.4. Others
- 9.2. Market Analysis, Insights and Forecast - by Types
- 9.2.1. Container/Harness
- 9.2.2. Protective Gears
- 9.2.3. Others
- 9.1. Market Analysis, Insights and Forecast - by Application
- 10. Asia Pacific Air Sports Equipment Analysis, Insights and Forecast, 2020-2032
- 10.1. Market Analysis, Insights and Forecast - by Application
- 10.1.1. Parachuting
- 10.1.2. Paragliding
- 10.1.3. Hang Gliding
- 10.1.4. Others
- 10.2. Market Analysis, Insights and Forecast - by Types
- 10.2.1. Container/Harness
- 10.2.2. Protective Gears
- 10.2.3. Others
- 10.1. Market Analysis, Insights and Forecast - by Application
- 11. Competitive Analysis
- 11.1. Global Market Share Analysis 2025
- 11.2. Company Profiles
- 11.2.1 Flyneo.com
- 11.2.1.1. Overview
- 11.2.1.2. Products
- 11.2.1.3. SWOT Analysis
- 11.2.1.4. Recent Developments
- 11.2.1.5. Financials (Based on Availability)
- 11.2.2 Velocity Sports Equipment
- 11.2.2.1. Overview
- 11.2.2.2. Products
- 11.2.2.3. SWOT Analysis
- 11.2.2.4. Recent Developments
- 11.2.2.5. Financials (Based on Availability)
- 11.2.3 Ozone power
- 11.2.3.1. Overview
- 11.2.3.2. Products
- 11.2.3.3. SWOT Analysis
- 11.2.3.4. Recent Developments
- 11.2.3.5. Financials (Based on Availability)
- 11.2.4 Aerodyne Research
- 11.2.4.1. Overview
- 11.2.4.2. Products
- 11.2.4.3. SWOT Analysis
- 11.2.4.4. Recent Developments
- 11.2.4.5. Financials (Based on Availability)
- 11.2.5 SUP’AIR
- 11.2.5.1. Overview
- 11.2.5.2. Products
- 11.2.5.3. SWOT Analysis
- 11.2.5.4. Recent Developments
- 11.2.5.5. Financials (Based on Availability)
- 11.2.1 Flyneo.com
List of Figures
- Figure 1: Global Air Sports Equipment Revenue Breakdown (million, %) by Region 2025 & 2033
- Figure 2: North America Air Sports Equipment Revenue (million), by Application 2025 & 2033
- Figure 3: North America Air Sports Equipment Revenue Share (%), by Application 2025 & 2033
- Figure 4: North America Air Sports Equipment Revenue (million), by Types 2025 & 2033
- Figure 5: North America Air Sports Equipment Revenue Share (%), by Types 2025 & 2033
- Figure 6: North America Air Sports Equipment Revenue (million), by Country 2025 & 2033
- Figure 7: North America Air Sports Equipment Revenue Share (%), by Country 2025 & 2033
- Figure 8: South America Air Sports Equipment Revenue (million), by Application 2025 & 2033
- Figure 9: South America Air Sports Equipment Revenue Share (%), by Application 2025 & 2033
- Figure 10: South America Air Sports Equipment Revenue (million), by Types 2025 & 2033
- Figure 11: South America Air Sports Equipment Revenue Share (%), by Types 2025 & 2033
- Figure 12: South America Air Sports Equipment Revenue (million), by Country 2025 & 2033
- Figure 13: South America Air Sports Equipment Revenue Share (%), by Country 2025 & 2033
- Figure 14: Europe Air Sports Equipment Revenue (million), by Application 2025 & 2033
- Figure 15: Europe Air Sports Equipment Revenue Share (%), by Application 2025 & 2033
- Figure 16: Europe Air Sports Equipment Revenue (million), by Types 2025 & 2033
- Figure 17: Europe Air Sports Equipment Revenue Share (%), by Types 2025 & 2033
- Figure 18: Europe Air Sports Equipment Revenue (million), by Country 2025 & 2033
- Figure 19: Europe Air Sports Equipment Revenue Share (%), by Country 2025 & 2033
- Figure 20: Middle East & Africa Air Sports Equipment Revenue (million), by Application 2025 & 2033
- Figure 21: Middle East & Africa Air Sports Equipment Revenue Share (%), by Application 2025 & 2033
- Figure 22: Middle East & Africa Air Sports Equipment Revenue (million), by Types 2025 & 2033
- Figure 23: Middle East & Africa Air Sports Equipment Revenue Share (%), by Types 2025 & 2033
- Figure 24: Middle East & Africa Air Sports Equipment Revenue (million), by Country 2025 & 2033
- Figure 25: Middle East & Africa Air Sports Equipment Revenue Share (%), by Country 2025 & 2033
- Figure 26: Asia Pacific Air Sports Equipment Revenue (million), by Application 2025 & 2033
- Figure 27: Asia Pacific Air Sports Equipment Revenue Share (%), by Application 2025 & 2033
- Figure 28: Asia Pacific Air Sports Equipment Revenue (million), by Types 2025 & 2033
- Figure 29: Asia Pacific Air Sports Equipment Revenue Share (%), by Types 2025 & 2033
- Figure 30: Asia Pacific Air Sports Equipment Revenue (million), by Country 2025 & 2033
- Figure 31: Asia Pacific Air Sports Equipment Revenue Share (%), by Country 2025 & 2033
List of Tables
- Table 1: Global Air Sports Equipment Revenue million Forecast, by Application 2020 & 2033
- Table 2: Global Air Sports Equipment Revenue million Forecast, by Types 2020 & 2033
- Table 3: Global Air Sports Equipment Revenue million Forecast, by Region 2020 & 2033
- Table 4: Global Air Sports Equipment Revenue million Forecast, by Application 2020 & 2033
- Table 5: Global Air Sports Equipment Revenue million Forecast, by Types 2020 & 2033
- Table 6: Global Air Sports Equipment Revenue million Forecast, by Country 2020 & 2033
- Table 7: United States Air Sports Equipment Revenue (million) Forecast, by Application 2020 & 2033
- Table 8: Canada Air Sports Equipment Revenue (million) Forecast, by Application 2020 & 2033
- Table 9: Mexico Air Sports Equipment Revenue (million) Forecast, by Application 2020 & 2033
- Table 10: Global Air Sports Equipment Revenue million Forecast, by Application 2020 & 2033
- Table 11: Global Air Sports Equipment Revenue million Forecast, by Types 2020 & 2033
- Table 12: Global Air Sports Equipment Revenue million Forecast, by Country 2020 & 2033
- Table 13: Brazil Air Sports Equipment Revenue (million) Forecast, by Application 2020 & 2033
- Table 14: Argentina Air Sports Equipment Revenue (million) Forecast, by Application 2020 & 2033
- Table 15: Rest of South America Air Sports Equipment Revenue (million) Forecast, by Application 2020 & 2033
- Table 16: Global Air Sports Equipment Revenue million Forecast, by Application 2020 & 2033
- Table 17: Global Air Sports Equipment Revenue million Forecast, by Types 2020 & 2033
- Table 18: Global Air Sports Equipment Revenue million Forecast, by Country 2020 & 2033
- Table 19: United Kingdom Air Sports Equipment Revenue (million) Forecast, by Application 2020 & 2033
- Table 20: Germany Air Sports Equipment Revenue (million) Forecast, by Application 2020 & 2033
- Table 21: France Air Sports Equipment Revenue (million) Forecast, by Application 2020 & 2033
- Table 22: Italy Air Sports Equipment Revenue (million) Forecast, by Application 2020 & 2033
- Table 23: Spain Air Sports Equipment Revenue (million) Forecast, by Application 2020 & 2033
- Table 24: Russia Air Sports Equipment Revenue (million) Forecast, by Application 2020 & 2033
- Table 25: Benelux Air Sports Equipment Revenue (million) Forecast, by Application 2020 & 2033
- Table 26: Nordics Air Sports Equipment Revenue (million) Forecast, by Application 2020 & 2033
- Table 27: Rest of Europe Air Sports Equipment Revenue (million) Forecast, by Application 2020 & 2033
- Table 28: Global Air Sports Equipment Revenue million Forecast, by Application 2020 & 2033
- Table 29: Global Air Sports Equipment Revenue million Forecast, by Types 2020 & 2033
- Table 30: Global Air Sports Equipment Revenue million Forecast, by Country 2020 & 2033
- Table 31: Turkey Air Sports Equipment Revenue (million) Forecast, by Application 2020 & 2033
- Table 32: Israel Air Sports Equipment Revenue (million) Forecast, by Application 2020 & 2033
- Table 33: GCC Air Sports Equipment Revenue (million) Forecast, by Application 2020 & 2033
- Table 34: North Africa Air Sports Equipment Revenue (million) Forecast, by Application 2020 & 2033
- Table 35: South Africa Air Sports Equipment Revenue (million) Forecast, by Application 2020 & 2033
- Table 36: Rest of Middle East & Africa Air Sports Equipment Revenue (million) Forecast, by Application 2020 & 2033
- Table 37: Global Air Sports Equipment Revenue million Forecast, by Application 2020 & 2033
- Table 38: Global Air Sports Equipment Revenue million Forecast, by Types 2020 & 2033
- Table 39: Global Air Sports Equipment Revenue million Forecast, by Country 2020 & 2033
- Table 40: China Air Sports Equipment Revenue (million) Forecast, by Application 2020 & 2033
- Table 41: India Air Sports Equipment Revenue (million) Forecast, by Application 2020 & 2033
- Table 42: Japan Air Sports Equipment Revenue (million) Forecast, by Application 2020 & 2033
- Table 43: South Korea Air Sports Equipment Revenue (million) Forecast, by Application 2020 & 2033
- Table 44: ASEAN Air Sports Equipment Revenue (million) Forecast, by Application 2020 & 2033
- Table 45: Oceania Air Sports Equipment Revenue (million) Forecast, by Application 2020 & 2033
- Table 46: Rest of Asia Pacific Air Sports Equipment Revenue (million) Forecast, by Application 2020 & 2033
Frequently Asked Questions
1. What is the projected Compound Annual Growth Rate (CAGR) of the Air Sports Equipment?
The projected CAGR is approximately XX%.
2. Which companies are prominent players in the Air Sports Equipment?
Key companies in the market include Flyneo.com, Velocity Sports Equipment, Ozone power, Aerodyne Research, SUP’AIR.
3. What are the main segments of the Air Sports Equipment?
The market segments include Application, Types.
4. Can you provide details about the market size?
The market size is estimated to be USD XXX million as of 2022.
5. What are some drivers contributing to market growth?
N/A
6. What are the notable trends driving market growth?
N/A
7. Are there any restraints impacting market growth?
N/A
8. Can you provide examples of recent developments in the market?
N/A
9. What pricing options are available for accessing the report?
Pricing options include single-user, multi-user, and enterprise licenses priced at USD 4900.00, USD 7350.00, and USD 9800.00 respectively.
10. Is the market size provided in terms of value or volume?
The market size is provided in terms of value, measured in million.
11. Are there any specific market keywords associated with the report?
Yes, the market keyword associated with the report is "Air Sports Equipment," which aids in identifying and referencing the specific market segment covered.
12. How do I determine which pricing option suits my needs best?
The pricing options vary based on user requirements and access needs. Individual users may opt for single-user licenses, while businesses requiring broader access may choose multi-user or enterprise licenses for cost-effective access to the report.
13. Are there any additional resources or data provided in the Air Sports Equipment report?
While the report offers comprehensive insights, it's advisable to review the specific contents or supplementary materials provided to ascertain if additional resources or data are available.
14. How can I stay updated on further developments or reports in the Air Sports Equipment?
To stay informed about further developments, trends, and reports in the Air Sports Equipment, consider subscribing to industry newsletters, following relevant companies and organizations, or regularly checking reputable industry news sources and publications.
Methodology
Step 1 - Identification of Relevant Samples Size from Population Database


Step 2 - Approaches for Defining Global Market Size (Value, Volume* & Price*)

Note*: In applicable scenarios
Step 3 - Data Sources
Primary Research
- Web Analytics
- Survey Reports
- Research Institute
- Latest Research Reports
- Opinion Leaders
Secondary Research
- Annual Reports
- White Paper
- Latest Press Release
- Industry Association
- Paid Database
- Investor Presentations

Step 4 - Data Triangulation
Involves using different sources of information in order to increase the validity of a study
These sources are likely to be stakeholders in a program - participants, other researchers, program staff, other community members, and so on.
Then we put all data in single framework & apply various statistical tools to find out the dynamic on the market.
During the analysis stage, feedback from the stakeholder groups would be compared to determine areas of agreement as well as areas of divergence