

Key Insights
The African biofertilizers market, valued at approximately $XX million in 2025, is projected to experience robust growth, exhibiting a compound annual growth rate (CAGR) of 15% from 2025 to 2033. This expansion is fueled by several key factors. Firstly, the increasing demand for sustainable agricultural practices and the growing awareness of the environmental impact of chemical fertilizers are driving adoption of biofertilizers. Secondly, favorable government policies and initiatives promoting sustainable agriculture across several African nations are further stimulating market growth. The rising prevalence of soil degradation and nutrient depletion, particularly in regions reliant on intensive farming, are also significantly increasing the need for biofertilizer solutions. The market is segmented by form (Azospirillum, Azotobacter, Mycorrhiza, Phosphate Solubilizing Bacteria, Rhizobium, and Others), crop type (cash crops, horticultural crops, and row crops), and key countries including South Africa, Egypt, Nigeria, and others. Specific growth rates will vary by segment, with biofertilizers for cash crops and horticultural crops likely demonstrating higher adoption rates. South Africa, due to its more developed agricultural sector, is expected to maintain a dominant market share, while Nigeria and Egypt will also experience substantial growth, driven by expanding agricultural production and government support.
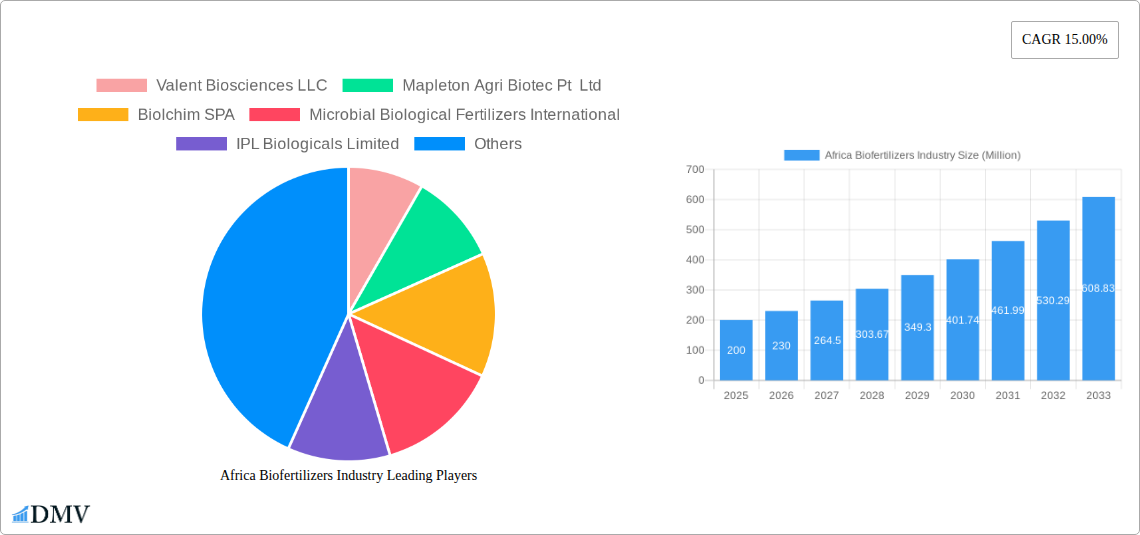
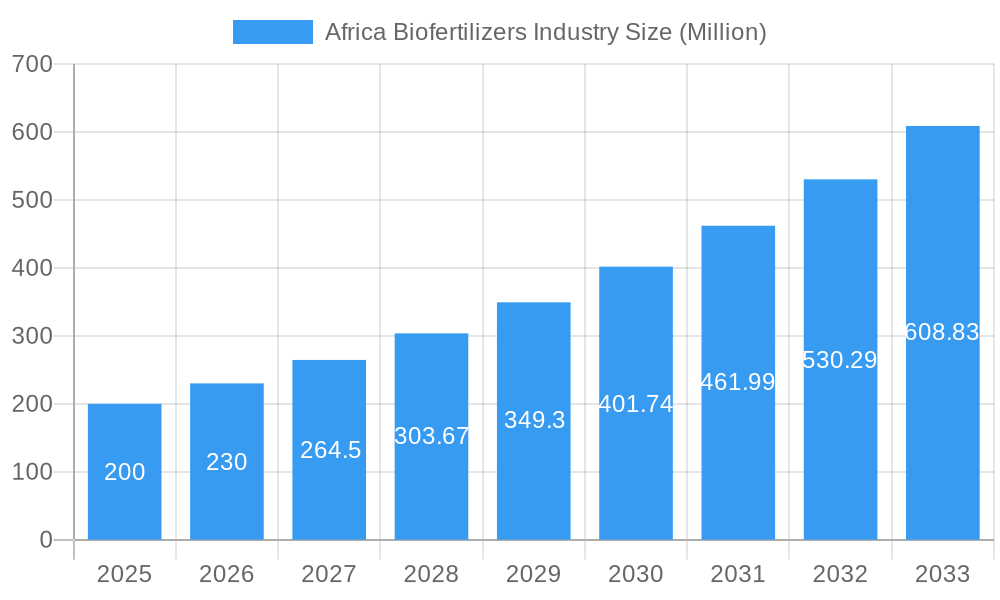
Africa Biofertilizers Industry Market Size (In Million)
The competitive landscape is characterized by a mix of multinational and regional players. While multinational companies bring advanced technologies and extensive distribution networks, regional companies possess a strong understanding of local market needs and conditions. Future growth will be shaped by several factors, including the development of innovative biofertilizer products, expanding research and development activities, improved access to financing for farmers, and continued governmental support for sustainable agriculture. Challenges include the need to increase farmer awareness about the benefits of biofertilizers and to address logistical hurdles associated with distribution and access in remote areas. Despite these challenges, the market outlook remains positive, driven by strong underlying growth factors and increasing governmental support for sustainable agriculture.
Africa Biofertilizers Industry Company Market Share
Africa Biofertilizers Industry: Market Analysis & Forecast 2019-2033
This comprehensive report provides an in-depth analysis of the burgeoning Africa biofertilizers industry, offering invaluable insights for stakeholders seeking to capitalize on its immense growth potential. The report covers the period 2019-2033, with a base year of 2025 and a forecast period of 2025-2033. We meticulously examine market trends, competitive dynamics, technological advancements, and regulatory landscapes to provide a clear picture of this dynamic sector, projected to reach xx Million by 2033.
Africa Biofertilizers Industry Market Composition & Trends
The Africa biofertilizers market exhibits a moderately fragmented landscape, with key players like Valent Biosciences LLC, Mapleton Agri Biotec Pt Ltd, Biolchim SPA, Microbial Biological Fertilizers International, IPL Biologicals Limited, Atlántica Agrícola, T Stanes and Company Limited, Vegalab S, and Rizobacter vying for market share. Market concentration is expected to shift slightly towards consolidation through mergers and acquisitions (M&A) as larger companies seek to expand their product portfolios and geographic reach. The total value of M&A deals within the industry during the historical period (2019-2024) was estimated at xx Million.
- Market Share Distribution (2024): Valent Biosciences LLC (xx%), Biolchim SPA (xx%), Rizobacter (xx%), Others (xx%).
- Innovation Catalysts: Growing demand for sustainable agriculture, stringent regulations on chemical fertilizers, and rising awareness of environmental concerns are driving innovation in biofertilizer technology.
- Regulatory Landscape: Government initiatives promoting sustainable agriculture and supporting the adoption of biofertilizers are creating a favorable regulatory environment. Variations exist across countries, however, impacting market access.
- Substitute Products: Chemical fertilizers remain the primary substitute, but their environmental impact is pushing a shift towards biofertilizers.
- End-User Profiles: The primary end-users are large-scale commercial farms, smallholder farmers, and horticultural businesses.
- M&A Activities: Strategic acquisitions are expected to accelerate as companies aim to expand their product lines, gain access to new markets, and enhance their technological capabilities.
Africa Biofertilizers Industry Industry Evolution
The Africa biofertilizers market has witnessed significant growth during the historical period (2019-2024), driven by increasing agricultural output demands and a growing preference for sustainable farming practices. The market exhibited a Compound Annual Growth Rate (CAGR) of xx% during this period. Technological advancements, such as the development of more efficient biofertilizer formulations and precision application techniques, have played a key role in this growth. Further advancements in understanding microbial interactions and their impact on crop yield are expected to drive future growth. Shifting consumer preferences toward organic and sustainably produced food products are also boosting market demand. The forecast period (2025-2033) projects a CAGR of xx%, indicating continued robust growth driven by factors outlined in subsequent sections. Adoption metrics show a significant increase in biofertilizer usage among smallholder farmers in key regions, particularly driven by government initiatives and awareness programs. The market is also witnessing an increasing adoption of innovative delivery systems, such as bio-priming and coated seeds, enhancing the efficiency of biofertilizers.
Leading Regions, Countries, or Segments in Africa Biofertilizers Industry
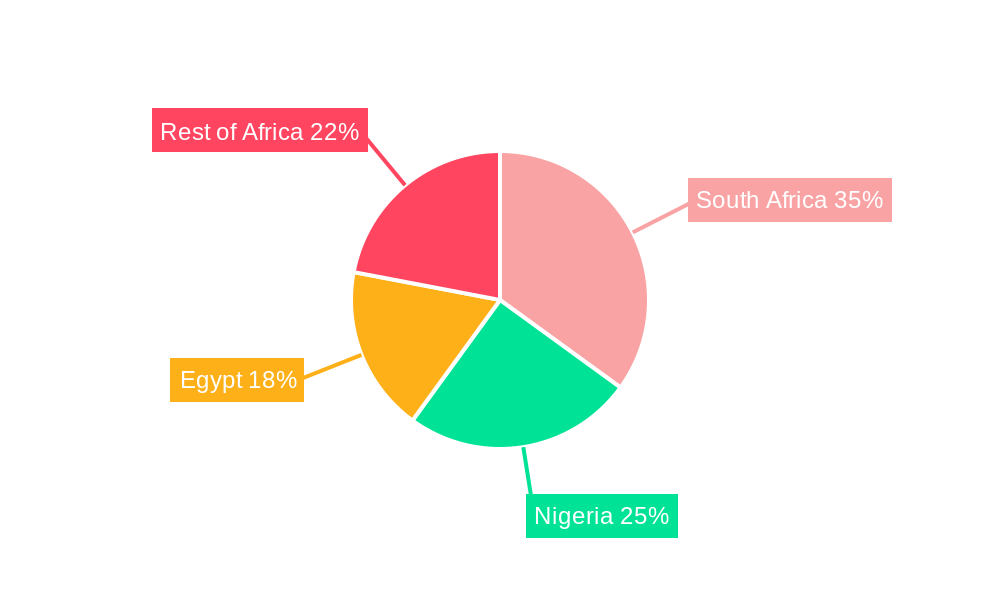
The South Africa biofertilizers market currently holds the largest market share, followed by Nigeria and Egypt. However, the "Rest of Africa" segment shows the highest growth potential.
Key Drivers:
- Egypt: Government support for sustainable agriculture and increasing investment in agricultural research and development.
- Nigeria: Large agricultural sector, growing demand for food, and rising awareness among farmers regarding the benefits of biofertilizers.
- South Africa: Established agricultural infrastructure, access to technology, and relatively higher farmer awareness of biofertilizer benefits.
- Rest of Africa: Untapped market potential, increasing government initiatives to support agricultural development, and rising demand from the expanding population.
Dominance Factors:
South Africa's dominance is attributed to its comparatively developed agricultural sector, robust regulatory framework, and higher farmer awareness and adoption rates. Nigeria benefits from its vast agricultural land and a growing population, creating significant demand. Egypt's government support for agricultural modernization is a key driver. The "Rest of Africa" segment's high growth potential stems from increasing agricultural investments and expansion of sustainable farming practices.
Segment-wise, the Phosphate Solubilizing Bacteria (PSB) segment holds the largest market share due to its effectiveness in improving phosphorus uptake by plants, which is a major limiting nutrient across many African soils. However, the Mycorrhiza segment is expected to exhibit the fastest growth due to its versatility and positive effects on various soil properties and plant health.
Africa Biofertilizers Industry Product Innovations
Recent innovations include the development of enhanced biofertilizer formulations with improved shelf life and efficacy, along with novel delivery systems, such as bio-priming and seed coating technologies. These advancements significantly improve the uptake and effectiveness of biofertilizers, resulting in enhanced crop yields and improved plant health. Companies are also focusing on developing specialized biofertilizers tailored to specific crops and soil conditions, further boosting their market appeal. Unique selling propositions include enhanced nutrient delivery, improved crop resilience to stress (water/salt), and reduced environmental impact compared to chemical fertilizers.
Propelling Factors for Africa Biofertilizers Industry Growth
Several factors are driving the growth of the Africa biofertilizers market. Technological advancements in biofertilizer production are leading to more effective and efficient formulations. Government initiatives promoting sustainable agriculture and providing financial incentives for biofertilizer adoption are fostering market expansion. The rising awareness among farmers regarding the benefits of biofertilizers, coupled with increasing consumer demand for sustainably produced food, are further contributing to this growth. Economic factors, such as the increasing cost of chemical fertilizers, are also making biofertilizers more attractive.
Obstacles in the Africa Biofertilizers Industry Market
The Africa biofertilizers market faces challenges, including limited awareness among smallholder farmers, inconsistent supply chains leading to price volatility and access issues, and high initial investment costs for biofertilizer adoption. Regulatory frameworks and support mechanisms vary considerably across countries, hindering uniform market development. Competition from established chemical fertilizer manufacturers also presents an obstacle. These factors, if not addressed, could impede market growth by an estimated xx Million by 2033.
Future Opportunities in Africa Biofertilizers Industry
Future opportunities lie in expanding market reach to previously underserved regions, further developing biofertilizers tailored to specific crop and soil types, and investing in innovative delivery systems to enhance efficiency and accessibility. The growing demand for organic and sustainable agriculture presents a significant growth opportunity, as does the potential to integrate biofertilizers with other precision agriculture technologies. Developing stronger partnerships between researchers, manufacturers, and farmers will play a key role in unlocking the industry's full potential.
Major Players in the Africa Biofertilizers Industry Ecosystem
- Valent Biosciences LLC
- Mapleton Agri Biotec Pt Ltd
- Biolchim SPA
- Microbial Biological Fertilizers International
- IPL Biologicals Limited
- Atlántica Agrícola
- T Stanes and Company Limited
- Vegalab S
- Rizobacter
Key Developments in Africa Biofertilizers Industry Industry
- January 2021: Heliae Agriculture and Rizobacter collaborated to develop innovative soil and crop nutrition technologies, enhancing product portfolios and efficiency.
- January 2021: Atlántica Agrícola launched Micomix, a biostimulant improving water and nutrient absorption and stress tolerance in plants.
Strategic Africa Biofertilizers Industry Market Forecast
The Africa biofertilizers market is poised for significant growth over the forecast period (2025-2033), driven by increasing demand for sustainable agriculture, technological advancements, and supportive government policies. The market's expansion will be fueled by increased farmer awareness, improved product efficacy, and broader accessibility. Further investment in research and development, coupled with strategic partnerships across the value chain, will be essential in realizing the full potential of this dynamic market, ultimately contributing to improved food security and sustainable agricultural practices across the continent.
Africa Biofertilizers Industry Segmentation
- 1. Production Analysis
- 2. Consumption Analysis
- 3. Import Market Analysis (Value & Volume)
- 4. Export Market Analysis (Value & Volume)
- 5. Price Trend Analysis
Africa Biofertilizers Industry Segmentation By Geography
-
1. Africa
- 1.1. Nigeria
- 1.2. South Africa
- 1.3. Egypt
- 1.4. Kenya
- 1.5. Ethiopia
- 1.6. Morocco
- 1.7. Ghana
- 1.8. Algeria
- 1.9. Tanzania
- 1.10. Ivory Coast
Africa Biofertilizers Industry Regional Market Share
Geographic Coverage of Africa Biofertilizers Industry
Africa Biofertilizers Industry REPORT HIGHLIGHTS
| Aspects | Details |
|---|---|
| Study Period | 2020-2034 |
| Base Year | 2025 |
| Estimated Year | 2026 |
| Forecast Period | 2026-2034 |
| Historical Period | 2020-2025 |
| Growth Rate | CAGR of 9.44% from 2020-2034 |
| Segmentation |
|
Table of Contents
- 1. Introduction
- 1.1. Research Scope
- 1.2. Market Segmentation
- 1.3. Research Objective
- 1.4. Definitions and Assumptions
- 2. Executive Summary
- 2.1. Market Snapshot
- 3. Market Dynamics
- 3.1. Market Drivers
- 3.2. Market Restrains
- 3.3. Market Trends
- 3.4. Market Opportunities
- 4. Market Factor Analysis
- 4.1. Porters Five Forces
- 4.1.1. Bargaining Power of Suppliers
- 4.1.2. Bargaining Power of Buyers
- 4.1.3. Threat of New Entrants
- 4.1.4. Threat of Substitutes
- 4.1.5. Competitive Rivalry
- 4.2. PESTEL analysis
- 4.3. BCG Analysis
- 4.3.1. Stars (High Growth, High Market Share)
- 4.3.2. Cash Cows (Low Growth, High Market Share)
- 4.3.3. Question Mark (High Growth, Low Market Share)
- 4.3.4. Dogs (Low Growth, Low Market Share)
- 4.4. Ansoff Matrix Analysis
- 4.5. Supply Chain Analysis
- 4.6. Regulatory Landscape
- 4.7. Current Market Potential and Opportunity Assessment (TAM–SAM–SOM Framework)
- 4.8. DMV Analyst Note
- 4.1. Porters Five Forces
- 5. Market Analysis, Insights and Forecast 2021-2033
- 5.1. Market Analysis, Insights and Forecast - by Production Analysis
- 5.2. Market Analysis, Insights and Forecast - by Consumption Analysis
- 5.3. Market Analysis, Insights and Forecast - by Import Market Analysis (Value & Volume)
- 5.4. Market Analysis, Insights and Forecast - by Export Market Analysis (Value & Volume)
- 5.5. Market Analysis, Insights and Forecast - by Price Trend Analysis
- 5.6. Market Analysis, Insights and Forecast - by Region
- 5.6.1. Africa
- 6. Africa Biofertilizers Industry Analysis, Insights and Forecast, 2021-2033
- 6.1. Market Analysis, Insights and Forecast - by Production Analysis
- 6.2. Market Analysis, Insights and Forecast - by Consumption Analysis
- 6.3. Market Analysis, Insights and Forecast - by Import Market Analysis (Value & Volume)
- 6.4. Market Analysis, Insights and Forecast - by Export Market Analysis (Value & Volume)
- 6.5. Market Analysis, Insights and Forecast - by Price Trend Analysis
- 7. Competitive Analysis
- 7.1. Company Profiles
- 7.1.1 Valent Biosciences LLC
- 7.1.1.1. Company Overview
- 7.1.1.2. Products
- 7.1.1.3. Company Financials
- 7.1.1.4. SWOT Analysis
- 7.1.2 Mapleton Agri Biotec Pt Ltd
- 7.1.2.1. Company Overview
- 7.1.2.2. Products
- 7.1.2.3. Company Financials
- 7.1.2.4. SWOT Analysis
- 7.1.3 Biolchim SPA
- 7.1.3.1. Company Overview
- 7.1.3.2. Products
- 7.1.3.3. Company Financials
- 7.1.3.4. SWOT Analysis
- 7.1.4 Microbial Biological Fertilizers International
- 7.1.4.1. Company Overview
- 7.1.4.2. Products
- 7.1.4.3. Company Financials
- 7.1.4.4. SWOT Analysis
- 7.1.5 IPL Biologicals Limited
- 7.1.5.1. Company Overview
- 7.1.5.2. Products
- 7.1.5.3. Company Financials
- 7.1.5.4. SWOT Analysis
- 7.1.6 Atlántica Agrícola
- 7.1.6.1. Company Overview
- 7.1.6.2. Products
- 7.1.6.3. Company Financials
- 7.1.6.4. SWOT Analysis
- 7.1.7 T Stanes and Company Limited
- 7.1.7.1. Company Overview
- 7.1.7.2. Products
- 7.1.7.3. Company Financials
- 7.1.7.4. SWOT Analysis
- 7.1.8 Vegalab S
- 7.1.8.1. Company Overview
- 7.1.8.2. Products
- 7.1.8.3. Company Financials
- 7.1.8.4. SWOT Analysis
- 7.1.9 Rizobacter
- 7.1.9.1. Company Overview
- 7.1.9.2. Products
- 7.1.9.3. Company Financials
- 7.1.9.4. SWOT Analysis
- 7.1.1 Valent Biosciences LLC
- 7.2. Market Entropy
- 7.2.1 Company's Key Areas Served
- 7.2.2 Recent Developments
- 7.3. Company Market Share Analysis 2025
- 7.3.1 Top 5 Companies Market Share Analysis
- 7.3.2 Top 3 Companies Market Share Analysis
- 7.4. List of Potential Customers
- 8. Research Methodology
List of Figures
- Figure 1: Africa Biofertilizers Industry Revenue Breakdown (million, %) by Product 2025 & 2033
- Figure 2: Africa Biofertilizers Industry Share (%) by Company 2025
List of Tables
- Table 1: Africa Biofertilizers Industry Revenue million Forecast, by Production Analysis 2020 & 2033
- Table 2: Africa Biofertilizers Industry Revenue million Forecast, by Consumption Analysis 2020 & 2033
- Table 3: Africa Biofertilizers Industry Revenue million Forecast, by Import Market Analysis (Value & Volume) 2020 & 2033
- Table 4: Africa Biofertilizers Industry Revenue million Forecast, by Export Market Analysis (Value & Volume) 2020 & 2033
- Table 5: Africa Biofertilizers Industry Revenue million Forecast, by Price Trend Analysis 2020 & 2033
- Table 6: Africa Biofertilizers Industry Revenue million Forecast, by Region 2020 & 2033
- Table 7: Africa Biofertilizers Industry Revenue million Forecast, by Production Analysis 2020 & 2033
- Table 8: Africa Biofertilizers Industry Revenue million Forecast, by Consumption Analysis 2020 & 2033
- Table 9: Africa Biofertilizers Industry Revenue million Forecast, by Import Market Analysis (Value & Volume) 2020 & 2033
- Table 10: Africa Biofertilizers Industry Revenue million Forecast, by Export Market Analysis (Value & Volume) 2020 & 2033
- Table 11: Africa Biofertilizers Industry Revenue million Forecast, by Price Trend Analysis 2020 & 2033
- Table 12: Africa Biofertilizers Industry Revenue million Forecast, by Country 2020 & 2033
- Table 13: Nigeria Africa Biofertilizers Industry Revenue (million) Forecast, by Application 2020 & 2033
- Table 14: South Africa Africa Biofertilizers Industry Revenue (million) Forecast, by Application 2020 & 2033
- Table 15: Egypt Africa Biofertilizers Industry Revenue (million) Forecast, by Application 2020 & 2033
- Table 16: Kenya Africa Biofertilizers Industry Revenue (million) Forecast, by Application 2020 & 2033
- Table 17: Ethiopia Africa Biofertilizers Industry Revenue (million) Forecast, by Application 2020 & 2033
- Table 18: Morocco Africa Biofertilizers Industry Revenue (million) Forecast, by Application 2020 & 2033
- Table 19: Ghana Africa Biofertilizers Industry Revenue (million) Forecast, by Application 2020 & 2033
- Table 20: Algeria Africa Biofertilizers Industry Revenue (million) Forecast, by Application 2020 & 2033
- Table 21: Tanzania Africa Biofertilizers Industry Revenue (million) Forecast, by Application 2020 & 2033
- Table 22: Ivory Coast Africa Biofertilizers Industry Revenue (million) Forecast, by Application 2020 & 2033
Frequently Asked Questions
1. What is the projected Compound Annual Growth Rate (CAGR) of the Africa Biofertilizers Industry?
The projected CAGR is approximately 9.44%.
2. Which companies are prominent players in the Africa Biofertilizers Industry?
Key companies in the market include Valent Biosciences LLC, Mapleton Agri Biotec Pt Ltd, Biolchim SPA, Microbial Biological Fertilizers International, IPL Biologicals Limited, Atlántica Agrícola, T Stanes and Company Limited, Vegalab S, Rizobacter.
3. What are the main segments of the Africa Biofertilizers Industry?
The market segments include Production Analysis, Consumption Analysis, Import Market Analysis (Value & Volume), Export Market Analysis (Value & Volume), Price Trend Analysis.
4. Can you provide details about the market size?
The market size is estimated to be USD 246.8 million as of 2022.
5. What are some drivers contributing to market growth?
Demand For Landscaping Maintenance; Adoption of Green Spaces and Green Roofs.
6. What are the notable trends driving market growth?
Row Crops is the largest Crop Type.
7. Are there any restraints impacting market growth?
Shortage of Labor In Landscaping; High Maintenance Cost of Lawn Mowers.
8. Can you provide examples of recent developments in the market?
January 2021: Heliae Agriculture and Rizobacter collaborate to develop Innovative Soil and Crop Nutrition Technologies that will help the company manufacture better and more efficient solutions, enhancing its product portfolio.January 2021: Atlántica Agrícola’s developed Micomix, a biostimulant composed primarily of mycorrhizal fungi, rhizobacteria, and chelated micronutrients. The presence and development of these microorganisms in the rhizosphere create a symbiotic relationship with the plant that favors the absorption of water and mineral nutrients and increases its tolerance to water and salt stress.
9. What pricing options are available for accessing the report?
Pricing options include single-user, multi-user, and enterprise licenses priced at USD 3800, USD 4500, and USD 5800 respectively.
10. Is the market size provided in terms of value or volume?
The market size is provided in terms of value, measured in million.
11. Are there any specific market keywords associated with the report?
Yes, the market keyword associated with the report is "Africa Biofertilizers Industry," which aids in identifying and referencing the specific market segment covered.
12. How do I determine which pricing option suits my needs best?
The pricing options vary based on user requirements and access needs. Individual users may opt for single-user licenses, while businesses requiring broader access may choose multi-user or enterprise licenses for cost-effective access to the report.
13. Are there any additional resources or data provided in the Africa Biofertilizers Industry report?
While the report offers comprehensive insights, it's advisable to review the specific contents or supplementary materials provided to ascertain if additional resources or data are available.
14. How can I stay updated on further developments or reports in the Africa Biofertilizers Industry?
To stay informed about further developments, trends, and reports in the Africa Biofertilizers Industry, consider subscribing to industry newsletters, following relevant companies and organizations, or regularly checking reputable industry news sources and publications.
Methodology
Step 1 - Identification of Relevant Samples Size from Population Database


Step 2 - Approaches for Defining Global Market Size (Value, Volume* & Price*)

Note*: In applicable scenarios
Step 3 - Data Sources
Primary Research
- Web Analytics
- Survey Reports
- Research Institute
- Latest Research Reports
- Opinion Leaders
Secondary Research
- Annual Reports
- White Paper
- Latest Press Release
- Industry Association
- Paid Database
- Investor Presentations

Step 4 - Data Triangulation
Involves using different sources of information in order to increase the validity of a study
These sources are likely to be stakeholders in a program - participants, other researchers, program staff, other community members, and so on.
Then we put all data in single framework & apply various statistical tools to find out the dynamic on the market.
During the analysis stage, feedback from the stakeholder groups would be compared to determine areas of agreement as well as areas of divergence