

Key Insights
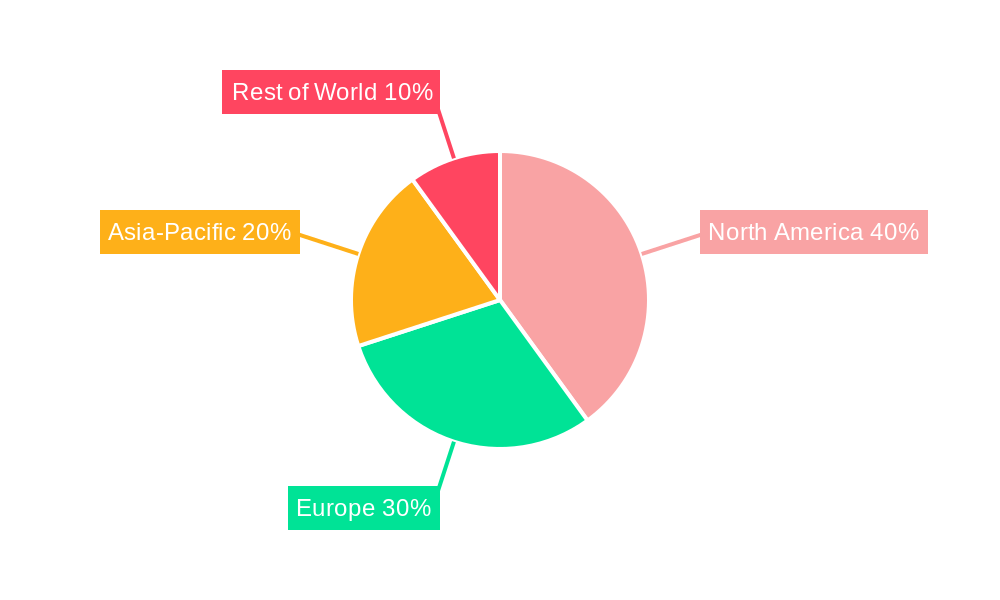
The 3D mouse market, while niche, exhibits promising growth potential driven by increasing adoption in specialized industries. The market size in 2025 is estimated at $150 million, projecting a Compound Annual Growth Rate (CAGR) of 8% from 2025 to 2033. This growth is fueled by several key drivers: the rising demand for enhanced precision and ergonomics in CAD/CAM software applications, the expansion of the gaming industry incorporating 3D control mechanisms, and the increasing adoption of virtual and augmented reality (VR/AR) technologies. Leading players like 3Dconnexion, Logitech, ELECOM, Razer, and Kensington are actively contributing to market expansion through product innovation and strategic partnerships. However, the high initial cost of 3D mice compared to standard mice remains a significant restraint, limiting wider consumer adoption. Furthermore, the market is segmented by device type (wired/wireless), application (professional design, gaming, etc.), and region. Market penetration in regions like North America and Europe is currently higher due to greater awareness and technological adoption; however, we anticipate growth in Asia-Pacific and other emerging markets fueled by industrial expansion and rising disposable income.
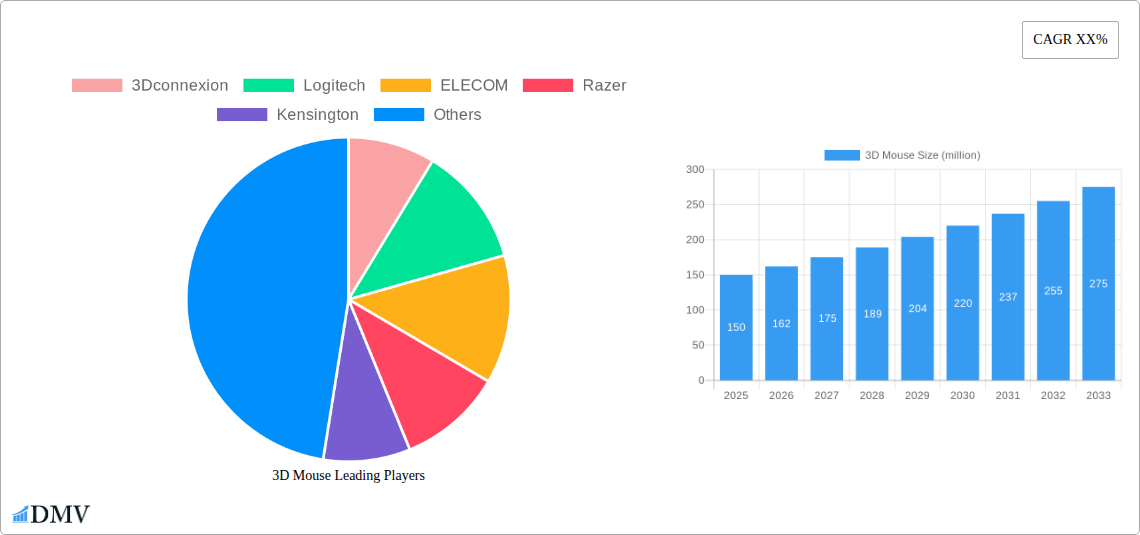
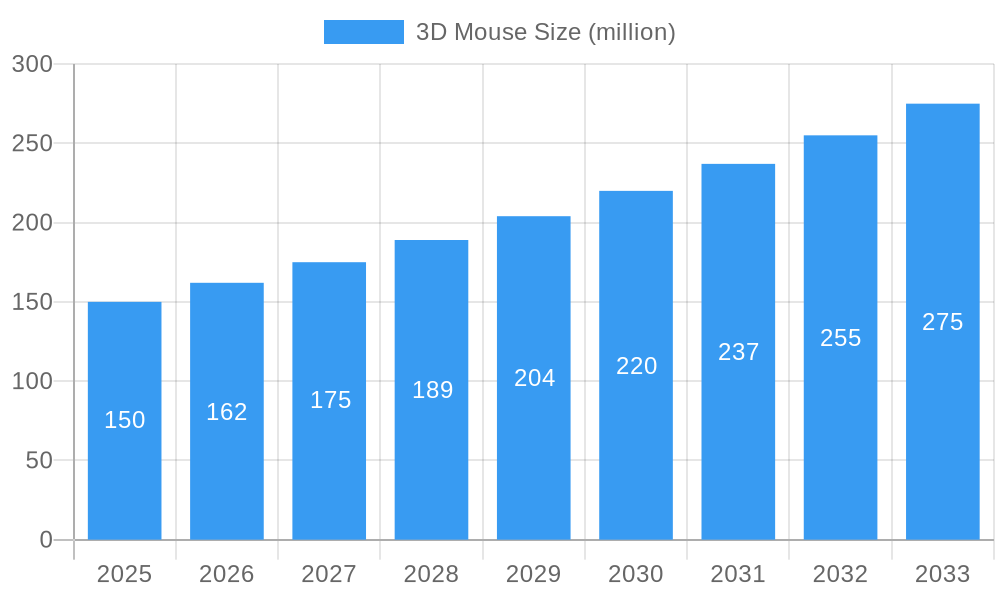
3D Mouse Market Size (In Million)
The forecast period (2025-2033) anticipates a steady increase in market value, reaching an estimated $275 million by 2033. This growth trajectory will be influenced by ongoing technological advancements leading to improved accuracy, user-friendliness, and integration with new software platforms. The gaming segment shows particular promise for expansion as the demand for more immersive and precise control in games grows. Further analysis reveals that the professional design segment will continue to be a dominant force, propelled by the need for precision in architecture, engineering, and medical imaging applications. Strategic collaborations between hardware manufacturers and software developers will be instrumental in driving future growth by ensuring seamless integration and enhanced user experience. Competitors are likely to focus on differentiation through features like improved haptic feedback, ergonomic designs, and software integration to cater to the diverse needs of professional and consumer segments.
3D Mouse Company Market Share
3D Mouse Market Report: 2019-2033 - A Comprehensive Analysis of a Multi-Million Dollar Industry
This insightful report provides a comprehensive analysis of the global 3D mouse market, projecting a multi-million-dollar valuation by 2033. The study covers the period 2019-2033, with 2025 serving as the base and estimated year. This deep dive into market dynamics, competitive landscapes, and future trends is crucial for stakeholders seeking to navigate this evolving technological sector. We project a market value exceeding xx million by 2033, driven by innovation and increasing adoption across various industries.
3D Mouse Market Composition & Trends
This section dissects the intricate composition of the 3D mouse market, unveiling key trends that shape its trajectory. We analyze market concentration, revealing the dominance of key players like 3Dconnexion, Logitech, and others. The report meticulously examines innovation catalysts, including advancements in sensor technology and ergonomic design, and analyzes their impact on market growth. We assess the regulatory landscape, identifying potential hurdles and opportunities, and evaluate the presence of substitute products and their influence on market share. End-user profiles across diverse sectors, such as CAD design, gaming, and medical imaging, are profiled, highlighting their unique demands and preferences. Finally, a comprehensive review of M&A activities within the industry is presented, including a breakdown of deal values (estimated at xx million in total during the historical period) and their influence on market consolidation.
- Market Share Distribution (2024): 3Dconnexion (xx%), Logitech (xx%), ELECOM (xx%), Razer (xx%), Kensington (xx%), Corsair (xx%), Others (xx%).
- M&A Deal Values (2019-2024): Total value estimated at xx million. Significant deals include [List specific M&A examples if available, otherwise state "Data unavailable"].
3D Mouse Industry Evolution
This section charts the evolutionary journey of the 3D mouse industry, from its nascent stages to its current state. We delve into the historical growth trajectory (2019-2024), analyzing factors influencing market expansion and contraction. We examine technological advancements, focusing on improvements in precision, responsiveness, and software integration, and their impact on adoption rates. Shifting consumer demands, particularly in terms of ergonomics, functionality, and price points, are analyzed, providing insights into evolving market preferences. Growth rates are projected to average xx% annually during the forecast period (2025-2033), driven by increasing demand in key sectors such as gaming and professional design. Adoption rates are expected to surge by xx% within the next five years.
Leading Regions, Countries, or Segments in 3D Mouse
This section pinpoints the dominant regions, countries, and segments within the 3D mouse market. Our analysis reveals that [Insert dominant region/country/segment, e.g., North America] holds the leading position, accounting for xx% of the global market share in 2024.
- Key Drivers for Dominance in [Dominant Region/Country/Segment]:
- Strong investment in R&D within the region.
- High adoption rates within specific industries, such as [Specific industries].
- Favorable regulatory environment.
- Robust infrastructure supporting technological advancements.
The dominance of this region is largely attributed to [Detailed explanation of factors contributing to the region's dominance, including market size, consumer preferences, technological advancements, and economic factors].
3D Mouse Product Innovations
Recent years have witnessed a wave of innovations in 3D mouse technology. Manufacturers are focusing on enhanced ergonomics, improved precision, and seamless software integration to cater to diverse user needs. New features such as programmable buttons, haptic feedback, and advanced sensor technologies are enhancing user experience and expanding the applications of 3D mice. These innovations are driving market growth and attracting new users from various professional and consumer segments. Key advancements include [mention specific examples of new features or technologies].
Propelling Factors for 3D Mouse Growth
The 3D mouse market's growth is propelled by several key factors. Technological advancements, such as the development of more precise and responsive sensors and improved software integration, are significantly enhancing user experience. Economic factors, including the rising disposable incomes in emerging economies and increased investment in R&D, are driving market expansion. Furthermore, supportive regulatory frameworks in several countries are fostering the growth of the 3D mouse industry.
Obstacles in the 3D Mouse Market
Despite the significant growth potential, several obstacles hinder the 3D mouse market's expansion. Regulatory challenges in certain regions can impede market penetration. Supply chain disruptions, particularly those related to semiconductor shortages, can affect production and distribution. Intense competition among established players and new entrants can lead to price wars and reduced profit margins. These factors collectively impact the overall market growth trajectory and need careful consideration. The estimated impact of these obstacles on market growth is approximately xx% annually.
Future Opportunities in 3D Mouse
The 3D mouse market presents several promising future opportunities. Emerging markets in developing economies offer substantial untapped potential. The integration of advanced technologies, such as AI and VR, could lead to innovative applications in various sectors, driving market expansion. New consumer trends, such as the growing demand for personalized and ergonomic devices, present avenues for product differentiation and increased market share.
Major Players in the 3D Mouse Ecosystem
Key Developments in 3D Mouse Industry
- [Month, Year]: [Company Name] launches a new 3D mouse with enhanced precision and ergonomics.
- [Month, Year]: [Company Name] acquires [another company] expanding its market presence.
- [Month, Year]: A significant patent related to 3D mouse technology is filed.
- [Month, Year]: New industry standards for 3D mouse performance are introduced.
[Add more bullet points as necessary with specific dates and events]
Strategic 3D Mouse Market Forecast
The future of the 3D mouse market appears bright, propelled by continuous technological innovation and increasing demand across diverse sectors. The forecast period (2025-2033) anticipates robust growth, driven by factors such as the integration of 3D mice into various applications, increased adoption in emerging economies, and the development of new user-friendly features. The market is poised to witness a significant expansion, with projected revenue exceeding xx million by 2033, presenting substantial opportunities for industry players.
3D Mouse Segmentation
-
1. Application
- 1.1. Design
- 1.2. Game
- 1.3. Others
-
2. Types
- 2.1. Wired
- 2.2. Wireless
3D Mouse Segmentation By Geography
-
1. North America
- 1.1. United States
- 1.2. Canada
- 1.3. Mexico
-
2. South America
- 2.1. Brazil
- 2.2. Argentina
- 2.3. Rest of South America
-
3. Europe
- 3.1. United Kingdom
- 3.2. Germany
- 3.3. France
- 3.4. Italy
- 3.5. Spain
- 3.6. Russia
- 3.7. Benelux
- 3.8. Nordics
- 3.9. Rest of Europe
-
4. Middle East & Africa
- 4.1. Turkey
- 4.2. Israel
- 4.3. GCC
- 4.4. North Africa
- 4.5. South Africa
- 4.6. Rest of Middle East & Africa
-
5. Asia Pacific
- 5.1. China
- 5.2. India
- 5.3. Japan
- 5.4. South Korea
- 5.5. ASEAN
- 5.6. Oceania
- 5.7. Rest of Asia Pacific
3D Mouse Regional Market Share
Geographic Coverage of 3D Mouse
3D Mouse REPORT HIGHLIGHTS
| Aspects | Details |
|---|---|
| Study Period | 2020-2034 |
| Base Year | 2025 |
| Estimated Year | 2026 |
| Forecast Period | 2026-2034 |
| Historical Period | 2020-2025 |
| Growth Rate | CAGR of 5.3% from 2020-2034 |
| Segmentation |
|
Table of Contents
- 1. Introduction
- 1.1. Research Scope
- 1.2. Market Segmentation
- 1.3. Research Methodology
- 1.4. Definitions and Assumptions
- 2. Executive Summary
- 2.1. Introduction
- 3. Market Dynamics
- 3.1. Introduction
- 3.2. Market Drivers
- 3.3. Market Restrains
- 3.4. Market Trends
- 4. Market Factor Analysis
- 4.1. Porters Five Forces
- 4.2. Supply/Value Chain
- 4.3. PESTEL analysis
- 4.4. Market Entropy
- 4.5. Patent/Trademark Analysis
- 5. Global 3D Mouse Analysis, Insights and Forecast, 2020-2032
- 5.1. Market Analysis, Insights and Forecast - by Application
- 5.1.1. Design
- 5.1.2. Game
- 5.1.3. Others
- 5.2. Market Analysis, Insights and Forecast - by Types
- 5.2.1. Wired
- 5.2.2. Wireless
- 5.3. Market Analysis, Insights and Forecast - by Region
- 5.3.1. North America
- 5.3.2. South America
- 5.3.3. Europe
- 5.3.4. Middle East & Africa
- 5.3.5. Asia Pacific
- 5.1. Market Analysis, Insights and Forecast - by Application
- 6. North America 3D Mouse Analysis, Insights and Forecast, 2020-2032
- 6.1. Market Analysis, Insights and Forecast - by Application
- 6.1.1. Design
- 6.1.2. Game
- 6.1.3. Others
- 6.2. Market Analysis, Insights and Forecast - by Types
- 6.2.1. Wired
- 6.2.2. Wireless
- 6.1. Market Analysis, Insights and Forecast - by Application
- 7. South America 3D Mouse Analysis, Insights and Forecast, 2020-2032
- 7.1. Market Analysis, Insights and Forecast - by Application
- 7.1.1. Design
- 7.1.2. Game
- 7.1.3. Others
- 7.2. Market Analysis, Insights and Forecast - by Types
- 7.2.1. Wired
- 7.2.2. Wireless
- 7.1. Market Analysis, Insights and Forecast - by Application
- 8. Europe 3D Mouse Analysis, Insights and Forecast, 2020-2032
- 8.1. Market Analysis, Insights and Forecast - by Application
- 8.1.1. Design
- 8.1.2. Game
- 8.1.3. Others
- 8.2. Market Analysis, Insights and Forecast - by Types
- 8.2.1. Wired
- 8.2.2. Wireless
- 8.1. Market Analysis, Insights and Forecast - by Application
- 9. Middle East & Africa 3D Mouse Analysis, Insights and Forecast, 2020-2032
- 9.1. Market Analysis, Insights and Forecast - by Application
- 9.1.1. Design
- 9.1.2. Game
- 9.1.3. Others
- 9.2. Market Analysis, Insights and Forecast - by Types
- 9.2.1. Wired
- 9.2.2. Wireless
- 9.1. Market Analysis, Insights and Forecast - by Application
- 10. Asia Pacific 3D Mouse Analysis, Insights and Forecast, 2020-2032
- 10.1. Market Analysis, Insights and Forecast - by Application
- 10.1.1. Design
- 10.1.2. Game
- 10.1.3. Others
- 10.2. Market Analysis, Insights and Forecast - by Types
- 10.2.1. Wired
- 10.2.2. Wireless
- 10.1. Market Analysis, Insights and Forecast - by Application
- 11. Competitive Analysis
- 11.1. Global Market Share Analysis 2025
- 11.2. Company Profiles
- 11.2.1 3Dconnexion
- 11.2.1.1. Overview
- 11.2.1.2. Products
- 11.2.1.3. SWOT Analysis
- 11.2.1.4. Recent Developments
- 11.2.1.5. Financials (Based on Availability)
- 11.2.2 Logitech
- 11.2.2.1. Overview
- 11.2.2.2. Products
- 11.2.2.3. SWOT Analysis
- 11.2.2.4. Recent Developments
- 11.2.2.5. Financials (Based on Availability)
- 11.2.3 ELECOM
- 11.2.3.1. Overview
- 11.2.3.2. Products
- 11.2.3.3. SWOT Analysis
- 11.2.3.4. Recent Developments
- 11.2.3.5. Financials (Based on Availability)
- 11.2.4 Razer
- 11.2.4.1. Overview
- 11.2.4.2. Products
- 11.2.4.3. SWOT Analysis
- 11.2.4.4. Recent Developments
- 11.2.4.5. Financials (Based on Availability)
- 11.2.5 Kensington
- 11.2.5.1. Overview
- 11.2.5.2. Products
- 11.2.5.3. SWOT Analysis
- 11.2.5.4. Recent Developments
- 11.2.5.5. Financials (Based on Availability)
- 11.2.6 Corsair
- 11.2.6.1. Overview
- 11.2.6.2. Products
- 11.2.6.3. SWOT Analysis
- 11.2.6.4. Recent Developments
- 11.2.6.5. Financials (Based on Availability)
- 11.2.1 3Dconnexion
List of Figures
- Figure 1: Global 3D Mouse Revenue Breakdown (undefined, %) by Region 2025 & 2033
- Figure 2: North America 3D Mouse Revenue (undefined), by Application 2025 & 2033
- Figure 3: North America 3D Mouse Revenue Share (%), by Application 2025 & 2033
- Figure 4: North America 3D Mouse Revenue (undefined), by Types 2025 & 2033
- Figure 5: North America 3D Mouse Revenue Share (%), by Types 2025 & 2033
- Figure 6: North America 3D Mouse Revenue (undefined), by Country 2025 & 2033
- Figure 7: North America 3D Mouse Revenue Share (%), by Country 2025 & 2033
- Figure 8: South America 3D Mouse Revenue (undefined), by Application 2025 & 2033
- Figure 9: South America 3D Mouse Revenue Share (%), by Application 2025 & 2033
- Figure 10: South America 3D Mouse Revenue (undefined), by Types 2025 & 2033
- Figure 11: South America 3D Mouse Revenue Share (%), by Types 2025 & 2033
- Figure 12: South America 3D Mouse Revenue (undefined), by Country 2025 & 2033
- Figure 13: South America 3D Mouse Revenue Share (%), by Country 2025 & 2033
- Figure 14: Europe 3D Mouse Revenue (undefined), by Application 2025 & 2033
- Figure 15: Europe 3D Mouse Revenue Share (%), by Application 2025 & 2033
- Figure 16: Europe 3D Mouse Revenue (undefined), by Types 2025 & 2033
- Figure 17: Europe 3D Mouse Revenue Share (%), by Types 2025 & 2033
- Figure 18: Europe 3D Mouse Revenue (undefined), by Country 2025 & 2033
- Figure 19: Europe 3D Mouse Revenue Share (%), by Country 2025 & 2033
- Figure 20: Middle East & Africa 3D Mouse Revenue (undefined), by Application 2025 & 2033
- Figure 21: Middle East & Africa 3D Mouse Revenue Share (%), by Application 2025 & 2033
- Figure 22: Middle East & Africa 3D Mouse Revenue (undefined), by Types 2025 & 2033
- Figure 23: Middle East & Africa 3D Mouse Revenue Share (%), by Types 2025 & 2033
- Figure 24: Middle East & Africa 3D Mouse Revenue (undefined), by Country 2025 & 2033
- Figure 25: Middle East & Africa 3D Mouse Revenue Share (%), by Country 2025 & 2033
- Figure 26: Asia Pacific 3D Mouse Revenue (undefined), by Application 2025 & 2033
- Figure 27: Asia Pacific 3D Mouse Revenue Share (%), by Application 2025 & 2033
- Figure 28: Asia Pacific 3D Mouse Revenue (undefined), by Types 2025 & 2033
- Figure 29: Asia Pacific 3D Mouse Revenue Share (%), by Types 2025 & 2033
- Figure 30: Asia Pacific 3D Mouse Revenue (undefined), by Country 2025 & 2033
- Figure 31: Asia Pacific 3D Mouse Revenue Share (%), by Country 2025 & 2033
List of Tables
- Table 1: Global 3D Mouse Revenue undefined Forecast, by Application 2020 & 2033
- Table 2: Global 3D Mouse Revenue undefined Forecast, by Types 2020 & 2033
- Table 3: Global 3D Mouse Revenue undefined Forecast, by Region 2020 & 2033
- Table 4: Global 3D Mouse Revenue undefined Forecast, by Application 2020 & 2033
- Table 5: Global 3D Mouse Revenue undefined Forecast, by Types 2020 & 2033
- Table 6: Global 3D Mouse Revenue undefined Forecast, by Country 2020 & 2033
- Table 7: United States 3D Mouse Revenue (undefined) Forecast, by Application 2020 & 2033
- Table 8: Canada 3D Mouse Revenue (undefined) Forecast, by Application 2020 & 2033
- Table 9: Mexico 3D Mouse Revenue (undefined) Forecast, by Application 2020 & 2033
- Table 10: Global 3D Mouse Revenue undefined Forecast, by Application 2020 & 2033
- Table 11: Global 3D Mouse Revenue undefined Forecast, by Types 2020 & 2033
- Table 12: Global 3D Mouse Revenue undefined Forecast, by Country 2020 & 2033
- Table 13: Brazil 3D Mouse Revenue (undefined) Forecast, by Application 2020 & 2033
- Table 14: Argentina 3D Mouse Revenue (undefined) Forecast, by Application 2020 & 2033
- Table 15: Rest of South America 3D Mouse Revenue (undefined) Forecast, by Application 2020 & 2033
- Table 16: Global 3D Mouse Revenue undefined Forecast, by Application 2020 & 2033
- Table 17: Global 3D Mouse Revenue undefined Forecast, by Types 2020 & 2033
- Table 18: Global 3D Mouse Revenue undefined Forecast, by Country 2020 & 2033
- Table 19: United Kingdom 3D Mouse Revenue (undefined) Forecast, by Application 2020 & 2033
- Table 20: Germany 3D Mouse Revenue (undefined) Forecast, by Application 2020 & 2033
- Table 21: France 3D Mouse Revenue (undefined) Forecast, by Application 2020 & 2033
- Table 22: Italy 3D Mouse Revenue (undefined) Forecast, by Application 2020 & 2033
- Table 23: Spain 3D Mouse Revenue (undefined) Forecast, by Application 2020 & 2033
- Table 24: Russia 3D Mouse Revenue (undefined) Forecast, by Application 2020 & 2033
- Table 25: Benelux 3D Mouse Revenue (undefined) Forecast, by Application 2020 & 2033
- Table 26: Nordics 3D Mouse Revenue (undefined) Forecast, by Application 2020 & 2033
- Table 27: Rest of Europe 3D Mouse Revenue (undefined) Forecast, by Application 2020 & 2033
- Table 28: Global 3D Mouse Revenue undefined Forecast, by Application 2020 & 2033
- Table 29: Global 3D Mouse Revenue undefined Forecast, by Types 2020 & 2033
- Table 30: Global 3D Mouse Revenue undefined Forecast, by Country 2020 & 2033
- Table 31: Turkey 3D Mouse Revenue (undefined) Forecast, by Application 2020 & 2033
- Table 32: Israel 3D Mouse Revenue (undefined) Forecast, by Application 2020 & 2033
- Table 33: GCC 3D Mouse Revenue (undefined) Forecast, by Application 2020 & 2033
- Table 34: North Africa 3D Mouse Revenue (undefined) Forecast, by Application 2020 & 2033
- Table 35: South Africa 3D Mouse Revenue (undefined) Forecast, by Application 2020 & 2033
- Table 36: Rest of Middle East & Africa 3D Mouse Revenue (undefined) Forecast, by Application 2020 & 2033
- Table 37: Global 3D Mouse Revenue undefined Forecast, by Application 2020 & 2033
- Table 38: Global 3D Mouse Revenue undefined Forecast, by Types 2020 & 2033
- Table 39: Global 3D Mouse Revenue undefined Forecast, by Country 2020 & 2033
- Table 40: China 3D Mouse Revenue (undefined) Forecast, by Application 2020 & 2033
- Table 41: India 3D Mouse Revenue (undefined) Forecast, by Application 2020 & 2033
- Table 42: Japan 3D Mouse Revenue (undefined) Forecast, by Application 2020 & 2033
- Table 43: South Korea 3D Mouse Revenue (undefined) Forecast, by Application 2020 & 2033
- Table 44: ASEAN 3D Mouse Revenue (undefined) Forecast, by Application 2020 & 2033
- Table 45: Oceania 3D Mouse Revenue (undefined) Forecast, by Application 2020 & 2033
- Table 46: Rest of Asia Pacific 3D Mouse Revenue (undefined) Forecast, by Application 2020 & 2033
Frequently Asked Questions
1. What is the projected Compound Annual Growth Rate (CAGR) of the 3D Mouse?
The projected CAGR is approximately 5.3%.
2. Which companies are prominent players in the 3D Mouse?
Key companies in the market include 3Dconnexion, Logitech, ELECOM, Razer, Kensington, Corsair.
3. What are the main segments of the 3D Mouse?
The market segments include Application, Types.
4. Can you provide details about the market size?
The market size is estimated to be USD XXX N/A as of 2022.
5. What are some drivers contributing to market growth?
N/A
6. What are the notable trends driving market growth?
N/A
7. Are there any restraints impacting market growth?
N/A
8. Can you provide examples of recent developments in the market?
N/A
9. What pricing options are available for accessing the report?
Pricing options include single-user, multi-user, and enterprise licenses priced at USD 4900.00, USD 7350.00, and USD 9800.00 respectively.
10. Is the market size provided in terms of value or volume?
The market size is provided in terms of value, measured in N/A.
11. Are there any specific market keywords associated with the report?
Yes, the market keyword associated with the report is "3D Mouse," which aids in identifying and referencing the specific market segment covered.
12. How do I determine which pricing option suits my needs best?
The pricing options vary based on user requirements and access needs. Individual users may opt for single-user licenses, while businesses requiring broader access may choose multi-user or enterprise licenses for cost-effective access to the report.
13. Are there any additional resources or data provided in the 3D Mouse report?
While the report offers comprehensive insights, it's advisable to review the specific contents or supplementary materials provided to ascertain if additional resources or data are available.
14. How can I stay updated on further developments or reports in the 3D Mouse?
To stay informed about further developments, trends, and reports in the 3D Mouse, consider subscribing to industry newsletters, following relevant companies and organizations, or regularly checking reputable industry news sources and publications.
Methodology
Step 1 - Identification of Relevant Samples Size from Population Database


Step 2 - Approaches for Defining Global Market Size (Value, Volume* & Price*)

Note*: In applicable scenarios
Step 3 - Data Sources
Primary Research
- Web Analytics
- Survey Reports
- Research Institute
- Latest Research Reports
- Opinion Leaders
Secondary Research
- Annual Reports
- White Paper
- Latest Press Release
- Industry Association
- Paid Database
- Investor Presentations

Step 4 - Data Triangulation
Involves using different sources of information in order to increase the validity of a study
These sources are likely to be stakeholders in a program - participants, other researchers, program staff, other community members, and so on.
Then we put all data in single framework & apply various statistical tools to find out the dynamic on the market.
During the analysis stage, feedback from the stakeholder groups would be compared to determine areas of agreement as well as areas of divergence