

Key Insights
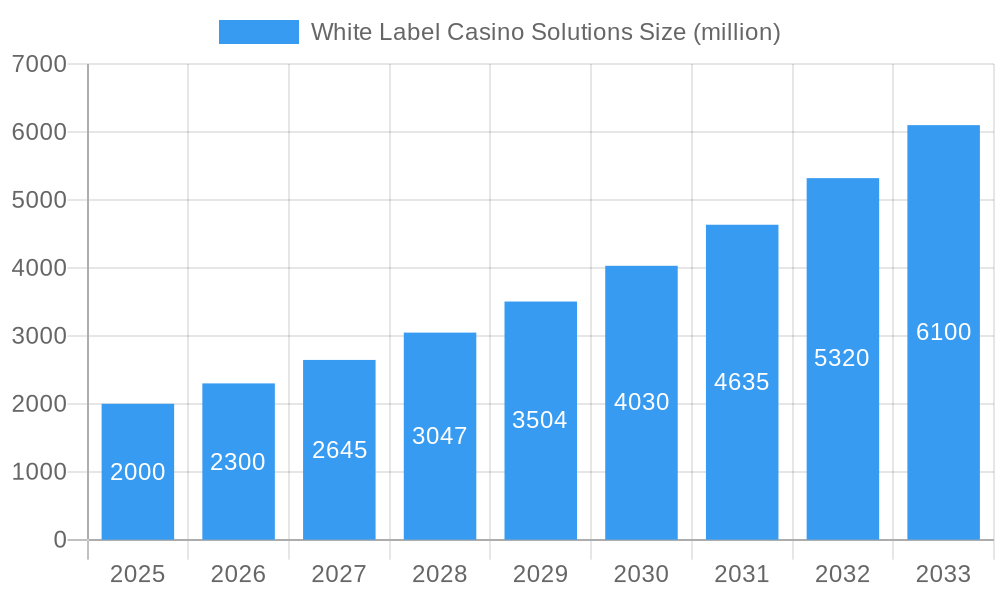
The white label casino solutions market is experiencing robust growth, driven by increasing demand for online gambling and the ease of launching online casinos using pre-built platforms. The market, estimated at $2 billion in 2025, is projected to exhibit a Compound Annual Growth Rate (CAGR) of 15% from 2025 to 2033, reaching an estimated market value of $6 billion by 2033. This growth is fueled by several key factors. Firstly, the rising popularity of online gambling globally, particularly in emerging markets, is creating significant opportunities for both established and new players in the industry. Secondly, white label solutions offer a cost-effective and time-efficient alternative to developing a casino platform from scratch, making it attractive to entrepreneurs and smaller operators. Thirdly, technological advancements, including improved mobile compatibility and enhanced security features, are further bolstering market expansion. However, regulatory hurdles and concerns regarding responsible gambling remain significant restraints, impacting market penetration in certain jurisdictions. The market is segmented by platform type (web-based, mobile), game types (slots, table games, live dealer), and geographical region, with North America and Europe currently holding the largest market shares.
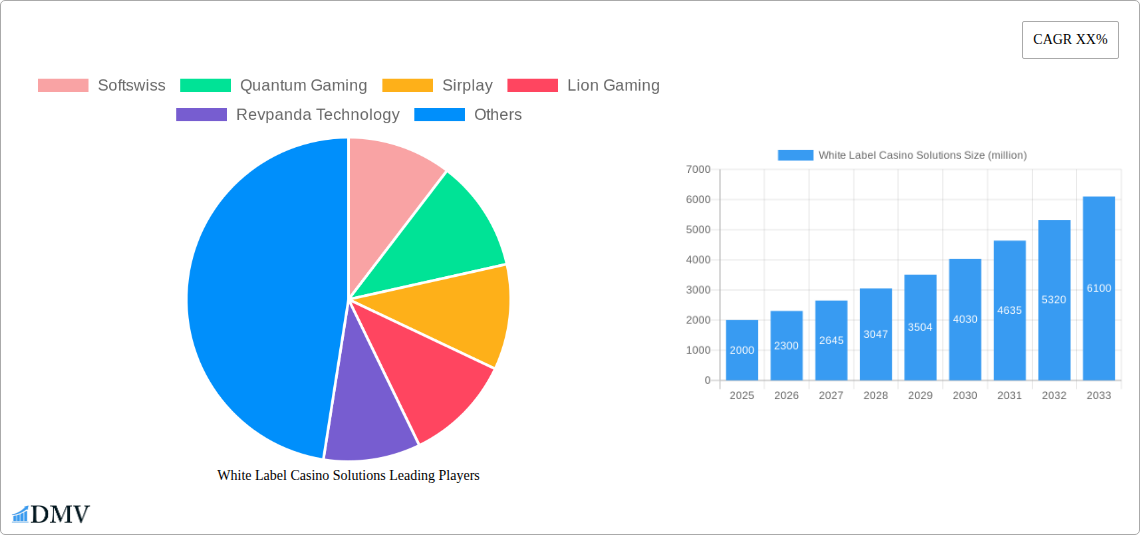
White Label Casino Solutions Market Size (In Billion)
The competitive landscape is characterized by a mix of established players like SoftSwiss, BetConstruct, and Quantum Gaming and emerging companies such as Revpanda Technology and Campeón Gaming. These companies are constantly innovating to offer a wider range of features, improved customization options, and enhanced player experiences to maintain their competitive edge. The increasing adoption of blockchain technology and cryptocurrencies for online transactions is also expected to contribute to future market growth. Companies are actively adapting their offerings to leverage these emerging trends, strengthening their market position and attracting a wider customer base. Successful players will prioritize strong customer support, seamless integration with payment gateways, and adherence to stringent regulatory compliance to ensure sustained success in this rapidly evolving market.
White Label Casino Solutions Company Market Share
White Label Casino Solutions Market Report: 2019-2033
This comprehensive report provides a detailed analysis of the global White Label Casino Solutions market, projecting a market value exceeding $XX million by 2033. The study covers the period from 2019 to 2033, with 2025 serving as the base and estimated year. This in-depth analysis will equip stakeholders with actionable insights to navigate this dynamic and lucrative market. The report features key players like SoftSwiss, Quantum Gaming, Sirplay, Lion Gaming, Revpanda Technology, Campeón Gaming, SoftGamings, Gammastack, Gamingtec, GR8 Tech, Maticz Technologies Private Limited, BetConstruct, and Upgaming, offering a comprehensive view of the competitive landscape.
White Label Casino Solutions Market Composition & Trends
The white label casino solutions market is experiencing substantial growth, fueled by increasing online gambling adoption and technological advancements. The market is moderately concentrated, with a few major players holding significant market share, while numerous smaller providers cater to niche segments. SoftSwiss and SoftGamings currently hold an estimated combined market share of xx%, indicating a high level of competition. However, constant innovation in game technology and platform features continues to create opportunities for new entrants. Regulatory landscapes vary significantly across jurisdictions, impacting market access and operational compliance. The increasing demand for personalized gaming experiences is driving innovation, with providers focusing on customized solutions and integrations. Substitute products, like self-built platforms, exist but often lack the scalability and support offered by white-label solutions. End-users are diverse, ranging from established operators to smaller startups entering the market. M&A activity has been notable, with several significant deals exceeding $XX million in value during the historical period (2019-2024), primarily driven by larger players seeking to expand their market reach and product portfolios.
- Market Share Distribution (2025 Estimate):
- SoftSwiss: xx%
- SoftGamings: xx%
- Other Major Players: xx%
- Smaller Players: xx%
- M&A Deal Value (2019-2024): Over $XX million across several transactions.
- Key Innovation Catalysts: Advanced game mechanics, personalized experiences, improved security features, blockchain integration, and AI-driven personalization.
- Regulatory Landscape: Highly fragmented, with significant variations in licensing and compliance requirements across different jurisdictions.
White Label Casino Solutions Industry Evolution
The white label casino solutions market has witnessed exponential growth since 2019. The market experienced a Compound Annual Growth Rate (CAGR) of xx% during the historical period (2019-2024) and is projected to maintain a robust CAGR of xx% during the forecast period (2025-2033). This growth is driven primarily by the rising popularity of online gambling, the increasing accessibility of mobile devices, and the ongoing expansion of regulated online gambling markets. Technological advancements, such as the integration of virtual reality (VR) and augmented reality (AR), have enhanced user experience, attracting new players. The shifting consumer demands for a seamless, personalized, and secure gambling environment are driving the adoption of innovative white-label solutions. The rise of mobile gaming and the proliferation of sophisticated game mechanics continue to shape the market's evolutionary path. The market's projected growth is also influenced by the increasing integration of payment gateways and advanced security protocols.
Leading Regions, Countries, or Segments in White Label Casino Solutions
The North American and European markets continue to be dominant regions for white label casino solutions. This dominance is due to factors such as:
- Key Drivers (North America & Europe):
- Established regulatory frameworks
- High internet penetration and mobile device usage
- Significant investments in gaming technology
- Strong consumer spending on online entertainment.
The dominance of these regions is driven by several factors, including:
- Mature Regulatory Frameworks: Well-defined licensing and compliance procedures make these regions attractive for operators.
- High Internet and Mobile Penetration: Widespread internet access and mobile device usage fuel the adoption of online gambling platforms.
- Strong Consumer Spending: Significant disposable income contributes to higher spending on entertainment and online gambling.
- Technological Advancements: Significant investments in R&D have led to advanced gaming technologies and platforms.
However, Asia-Pacific is emerging as a high-growth region, driven by increasing internet penetration and a growing number of online gambling enthusiasts.
White Label Casino Solutions Product Innovations
Recent product innovations include the introduction of advanced game engines, personalized user interfaces, robust security features, and seamless payment gateway integrations. These innovations focus on enhancing the user experience, improving security, and streamlining operations for operators. The incorporation of AI-driven personalization features and advanced analytics capabilities enables operators to better understand player preferences and customize their offerings accordingly. Unique selling propositions (USPs) include tailored solutions that meet specific operator needs, flexible payment options, and comprehensive marketing support.
Propelling Factors for White Label Casino Solutions Growth
Several factors are propelling the growth of the white label casino solutions market: the increasing legalization and regulation of online gambling in various jurisdictions, the growing popularity of mobile gaming and the convenience it provides, and technological innovations that offer advanced security features and personalized player experiences. Furthermore, the rising disposable incomes in several countries and a greater acceptance of online gambling contribute significantly to market growth. The expanding availability of high-speed internet across the globe also facilitates broader access to online gaming platforms.
Obstacles in the White Label Casino Solutions Market
The white label casino solutions market faces challenges such as stringent regulatory requirements in many jurisdictions, which can increase compliance costs and hinder market entry. Supply chain disruptions and geopolitical instability can affect the availability of certain technologies and components. Intense competition amongst providers necessitates ongoing investments in innovation and differentiation to maintain a competitive edge. The increasing cost of acquiring and retaining players also poses a significant challenge for operators. Estimated annual revenue loss due to regulatory challenges and compliance costs is approximately $XX million across the industry.
Future Opportunities in White Label Casino Solutions
Future opportunities lie in expanding into emerging markets with less stringent regulatory environments, incorporating cutting-edge technologies like blockchain and virtual reality (VR), and focusing on providing personalized gaming experiences through AI-powered solutions. Further opportunities include expanding into new gaming verticals and focusing on responsible gambling initiatives.
Major Players in the White Label Casino Solutions Ecosystem
- SoftSwiss
- Quantum Gaming (Note: This link may need verification as several companies use this name. A more precise link may be needed)
- Sirplay
- Lion Gaming
- Revpanda Technology
- Campeón Gaming
- SoftGamings
- Gammastack
- Gamingtec
- GR8 Tech
- Maticz Technologies Private Limited
- BetConstruct
- Upgaming
Key Developments in White Label Casino Solutions Industry
- 2022 Q3: SoftSwiss launched a new platform featuring enhanced security measures.
- 2023 Q1: A merger between two smaller white label providers resulted in a combined market share of xx%.
- 2023 Q4: Several companies integrated AI-powered personalization features in their platforms.
- 2024 Q2: Increased regulatory scrutiny led to tighter compliance requirements in several jurisdictions.
Strategic White Label Casino Solutions Market Forecast
The white label casino solutions market is poised for continued growth, driven by technological advancements, regulatory changes, and increasing consumer demand for online gambling experiences. Opportunities lie in exploring new markets, developing innovative products, and focusing on personalized user experiences. The market is expected to surpass $XX million by 2033, presenting substantial potential for investors and industry participants alike. The ongoing development of innovative game mechanics and expanding regulatory acceptance will continue to shape the market's trajectory.
White Label Casino Solutions Segmentation
-
1. Application
- 1.1. Online Casino
- 1.2. Sportsbook
- 1.3. Others
-
2. Types
- 2.1. Cloud Based
- 2.2. Local Deployment
White Label Casino Solutions Segmentation By Geography
-
1. North America
- 1.1. United States
- 1.2. Canada
- 1.3. Mexico
-
2. South America
- 2.1. Brazil
- 2.2. Argentina
- 2.3. Rest of South America
-
3. Europe
- 3.1. United Kingdom
- 3.2. Germany
- 3.3. France
- 3.4. Italy
- 3.5. Spain
- 3.6. Russia
- 3.7. Benelux
- 3.8. Nordics
- 3.9. Rest of Europe
-
4. Middle East & Africa
- 4.1. Turkey
- 4.2. Israel
- 4.3. GCC
- 4.4. North Africa
- 4.5. South Africa
- 4.6. Rest of Middle East & Africa
-
5. Asia Pacific
- 5.1. China
- 5.2. India
- 5.3. Japan
- 5.4. South Korea
- 5.5. ASEAN
- 5.6. Oceania
- 5.7. Rest of Asia Pacific

White Label Casino Solutions Regional Market Share
Geographic Coverage of White Label Casino Solutions
White Label Casino Solutions REPORT HIGHLIGHTS
| Aspects | Details |
|---|---|
| Study Period | 2020-2034 |
| Base Year | 2025 |
| Estimated Year | 2026 |
| Forecast Period | 2026-2034 |
| Historical Period | 2020-2025 |
| Growth Rate | CAGR of XX% from 2020-2034 |
| Segmentation |
|
Table of Contents
- 1. Introduction
- 1.1. Research Scope
- 1.2. Market Segmentation
- 1.3. Research Methodology
- 1.4. Definitions and Assumptions
- 2. Executive Summary
- 2.1. Introduction
- 3. Market Dynamics
- 3.1. Introduction
- 3.2. Market Drivers
- 3.3. Market Restrains
- 3.4. Market Trends
- 4. Market Factor Analysis
- 4.1. Porters Five Forces
- 4.2. Supply/Value Chain
- 4.3. PESTEL analysis
- 4.4. Market Entropy
- 4.5. Patent/Trademark Analysis
- 5. Global White Label Casino Solutions Analysis, Insights and Forecast, 2020-2032
- 5.1. Market Analysis, Insights and Forecast - by Application
- 5.1.1. Online Casino
- 5.1.2. Sportsbook
- 5.1.3. Others
- 5.2. Market Analysis, Insights and Forecast - by Types
- 5.2.1. Cloud Based
- 5.2.2. Local Deployment
- 5.3. Market Analysis, Insights and Forecast - by Region
- 5.3.1. North America
- 5.3.2. South America
- 5.3.3. Europe
- 5.3.4. Middle East & Africa
- 5.3.5. Asia Pacific
- 5.1. Market Analysis, Insights and Forecast - by Application
- 6. North America White Label Casino Solutions Analysis, Insights and Forecast, 2020-2032
- 6.1. Market Analysis, Insights and Forecast - by Application
- 6.1.1. Online Casino
- 6.1.2. Sportsbook
- 6.1.3. Others
- 6.2. Market Analysis, Insights and Forecast - by Types
- 6.2.1. Cloud Based
- 6.2.2. Local Deployment
- 6.1. Market Analysis, Insights and Forecast - by Application
- 7. South America White Label Casino Solutions Analysis, Insights and Forecast, 2020-2032
- 7.1. Market Analysis, Insights and Forecast - by Application
- 7.1.1. Online Casino
- 7.1.2. Sportsbook
- 7.1.3. Others
- 7.2. Market Analysis, Insights and Forecast - by Types
- 7.2.1. Cloud Based
- 7.2.2. Local Deployment
- 7.1. Market Analysis, Insights and Forecast - by Application
- 8. Europe White Label Casino Solutions Analysis, Insights and Forecast, 2020-2032
- 8.1. Market Analysis, Insights and Forecast - by Application
- 8.1.1. Online Casino
- 8.1.2. Sportsbook
- 8.1.3. Others
- 8.2. Market Analysis, Insights and Forecast - by Types
- 8.2.1. Cloud Based
- 8.2.2. Local Deployment
- 8.1. Market Analysis, Insights and Forecast - by Application
- 9. Middle East & Africa White Label Casino Solutions Analysis, Insights and Forecast, 2020-2032
- 9.1. Market Analysis, Insights and Forecast - by Application
- 9.1.1. Online Casino
- 9.1.2. Sportsbook
- 9.1.3. Others
- 9.2. Market Analysis, Insights and Forecast - by Types
- 9.2.1. Cloud Based
- 9.2.2. Local Deployment
- 9.1. Market Analysis, Insights and Forecast - by Application
- 10. Asia Pacific White Label Casino Solutions Analysis, Insights and Forecast, 2020-2032
- 10.1. Market Analysis, Insights and Forecast - by Application
- 10.1.1. Online Casino
- 10.1.2. Sportsbook
- 10.1.3. Others
- 10.2. Market Analysis, Insights and Forecast - by Types
- 10.2.1. Cloud Based
- 10.2.2. Local Deployment
- 10.1. Market Analysis, Insights and Forecast - by Application
- 11. Competitive Analysis
- 11.1. Global Market Share Analysis 2025
- 11.2. Company Profiles
- 11.2.1 Softswiss
- 11.2.1.1. Overview
- 11.2.1.2. Products
- 11.2.1.3. SWOT Analysis
- 11.2.1.4. Recent Developments
- 11.2.1.5. Financials (Based on Availability)
- 11.2.2 Quantum Gaming
- 11.2.2.1. Overview
- 11.2.2.2. Products
- 11.2.2.3. SWOT Analysis
- 11.2.2.4. Recent Developments
- 11.2.2.5. Financials (Based on Availability)
- 11.2.3 Sirplay
- 11.2.3.1. Overview
- 11.2.3.2. Products
- 11.2.3.3. SWOT Analysis
- 11.2.3.4. Recent Developments
- 11.2.3.5. Financials (Based on Availability)
- 11.2.4 Lion Gaming
- 11.2.4.1. Overview
- 11.2.4.2. Products
- 11.2.4.3. SWOT Analysis
- 11.2.4.4. Recent Developments
- 11.2.4.5. Financials (Based on Availability)
- 11.2.5 Revpanda Technology
- 11.2.5.1. Overview
- 11.2.5.2. Products
- 11.2.5.3. SWOT Analysis
- 11.2.5.4. Recent Developments
- 11.2.5.5. Financials (Based on Availability)
- 11.2.6 Campeón Gaming
- 11.2.6.1. Overview
- 11.2.6.2. Products
- 11.2.6.3. SWOT Analysis
- 11.2.6.4. Recent Developments
- 11.2.6.5. Financials (Based on Availability)
- 11.2.7 SoftGamings
- 11.2.7.1. Overview
- 11.2.7.2. Products
- 11.2.7.3. SWOT Analysis
- 11.2.7.4. Recent Developments
- 11.2.7.5. Financials (Based on Availability)
- 11.2.8 Gammastack
- 11.2.8.1. Overview
- 11.2.8.2. Products
- 11.2.8.3. SWOT Analysis
- 11.2.8.4. Recent Developments
- 11.2.8.5. Financials (Based on Availability)
- 11.2.9 Gamingtec
- 11.2.9.1. Overview
- 11.2.9.2. Products
- 11.2.9.3. SWOT Analysis
- 11.2.9.4. Recent Developments
- 11.2.9.5. Financials (Based on Availability)
- 11.2.10 GR8 Tech
- 11.2.10.1. Overview
- 11.2.10.2. Products
- 11.2.10.3. SWOT Analysis
- 11.2.10.4. Recent Developments
- 11.2.10.5. Financials (Based on Availability)
- 11.2.11 Maticz Technologies Private Limited
- 11.2.11.1. Overview
- 11.2.11.2. Products
- 11.2.11.3. SWOT Analysis
- 11.2.11.4. Recent Developments
- 11.2.11.5. Financials (Based on Availability)
- 11.2.12 BetConstruct
- 11.2.12.1. Overview
- 11.2.12.2. Products
- 11.2.12.3. SWOT Analysis
- 11.2.12.4. Recent Developments
- 11.2.12.5. Financials (Based on Availability)
- 11.2.13 Upgaming
- 11.2.13.1. Overview
- 11.2.13.2. Products
- 11.2.13.3. SWOT Analysis
- 11.2.13.4. Recent Developments
- 11.2.13.5. Financials (Based on Availability)
- 11.2.1 Softswiss
List of Figures
- Figure 1: Global White Label Casino Solutions Revenue Breakdown (million, %) by Region 2025 & 2033
- Figure 2: North America White Label Casino Solutions Revenue (million), by Application 2025 & 2033
- Figure 3: North America White Label Casino Solutions Revenue Share (%), by Application 2025 & 2033
- Figure 4: North America White Label Casino Solutions Revenue (million), by Types 2025 & 2033
- Figure 5: North America White Label Casino Solutions Revenue Share (%), by Types 2025 & 2033
- Figure 6: North America White Label Casino Solutions Revenue (million), by Country 2025 & 2033
- Figure 7: North America White Label Casino Solutions Revenue Share (%), by Country 2025 & 2033
- Figure 8: South America White Label Casino Solutions Revenue (million), by Application 2025 & 2033
- Figure 9: South America White Label Casino Solutions Revenue Share (%), by Application 2025 & 2033
- Figure 10: South America White Label Casino Solutions Revenue (million), by Types 2025 & 2033
- Figure 11: South America White Label Casino Solutions Revenue Share (%), by Types 2025 & 2033
- Figure 12: South America White Label Casino Solutions Revenue (million), by Country 2025 & 2033
- Figure 13: South America White Label Casino Solutions Revenue Share (%), by Country 2025 & 2033
- Figure 14: Europe White Label Casino Solutions Revenue (million), by Application 2025 & 2033
- Figure 15: Europe White Label Casino Solutions Revenue Share (%), by Application 2025 & 2033
- Figure 16: Europe White Label Casino Solutions Revenue (million), by Types 2025 & 2033
- Figure 17: Europe White Label Casino Solutions Revenue Share (%), by Types 2025 & 2033
- Figure 18: Europe White Label Casino Solutions Revenue (million), by Country 2025 & 2033
- Figure 19: Europe White Label Casino Solutions Revenue Share (%), by Country 2025 & 2033
- Figure 20: Middle East & Africa White Label Casino Solutions Revenue (million), by Application 2025 & 2033
- Figure 21: Middle East & Africa White Label Casino Solutions Revenue Share (%), by Application 2025 & 2033
- Figure 22: Middle East & Africa White Label Casino Solutions Revenue (million), by Types 2025 & 2033
- Figure 23: Middle East & Africa White Label Casino Solutions Revenue Share (%), by Types 2025 & 2033
- Figure 24: Middle East & Africa White Label Casino Solutions Revenue (million), by Country 2025 & 2033
- Figure 25: Middle East & Africa White Label Casino Solutions Revenue Share (%), by Country 2025 & 2033
- Figure 26: Asia Pacific White Label Casino Solutions Revenue (million), by Application 2025 & 2033
- Figure 27: Asia Pacific White Label Casino Solutions Revenue Share (%), by Application 2025 & 2033
- Figure 28: Asia Pacific White Label Casino Solutions Revenue (million), by Types 2025 & 2033
- Figure 29: Asia Pacific White Label Casino Solutions Revenue Share (%), by Types 2025 & 2033
- Figure 30: Asia Pacific White Label Casino Solutions Revenue (million), by Country 2025 & 2033
- Figure 31: Asia Pacific White Label Casino Solutions Revenue Share (%), by Country 2025 & 2033
List of Tables
- Table 1: Global White Label Casino Solutions Revenue million Forecast, by Application 2020 & 2033
- Table 2: Global White Label Casino Solutions Revenue million Forecast, by Types 2020 & 2033
- Table 3: Global White Label Casino Solutions Revenue million Forecast, by Region 2020 & 2033
- Table 4: Global White Label Casino Solutions Revenue million Forecast, by Application 2020 & 2033
- Table 5: Global White Label Casino Solutions Revenue million Forecast, by Types 2020 & 2033
- Table 6: Global White Label Casino Solutions Revenue million Forecast, by Country 2020 & 2033
- Table 7: United States White Label Casino Solutions Revenue (million) Forecast, by Application 2020 & 2033
- Table 8: Canada White Label Casino Solutions Revenue (million) Forecast, by Application 2020 & 2033
- Table 9: Mexico White Label Casino Solutions Revenue (million) Forecast, by Application 2020 & 2033
- Table 10: Global White Label Casino Solutions Revenue million Forecast, by Application 2020 & 2033
- Table 11: Global White Label Casino Solutions Revenue million Forecast, by Types 2020 & 2033
- Table 12: Global White Label Casino Solutions Revenue million Forecast, by Country 2020 & 2033
- Table 13: Brazil White Label Casino Solutions Revenue (million) Forecast, by Application 2020 & 2033
- Table 14: Argentina White Label Casino Solutions Revenue (million) Forecast, by Application 2020 & 2033
- Table 15: Rest of South America White Label Casino Solutions Revenue (million) Forecast, by Application 2020 & 2033
- Table 16: Global White Label Casino Solutions Revenue million Forecast, by Application 2020 & 2033
- Table 17: Global White Label Casino Solutions Revenue million Forecast, by Types 2020 & 2033
- Table 18: Global White Label Casino Solutions Revenue million Forecast, by Country 2020 & 2033
- Table 19: United Kingdom White Label Casino Solutions Revenue (million) Forecast, by Application 2020 & 2033
- Table 20: Germany White Label Casino Solutions Revenue (million) Forecast, by Application 2020 & 2033
- Table 21: France White Label Casino Solutions Revenue (million) Forecast, by Application 2020 & 2033
- Table 22: Italy White Label Casino Solutions Revenue (million) Forecast, by Application 2020 & 2033
- Table 23: Spain White Label Casino Solutions Revenue (million) Forecast, by Application 2020 & 2033
- Table 24: Russia White Label Casino Solutions Revenue (million) Forecast, by Application 2020 & 2033
- Table 25: Benelux White Label Casino Solutions Revenue (million) Forecast, by Application 2020 & 2033
- Table 26: Nordics White Label Casino Solutions Revenue (million) Forecast, by Application 2020 & 2033
- Table 27: Rest of Europe White Label Casino Solutions Revenue (million) Forecast, by Application 2020 & 2033
- Table 28: Global White Label Casino Solutions Revenue million Forecast, by Application 2020 & 2033
- Table 29: Global White Label Casino Solutions Revenue million Forecast, by Types 2020 & 2033
- Table 30: Global White Label Casino Solutions Revenue million Forecast, by Country 2020 & 2033
- Table 31: Turkey White Label Casino Solutions Revenue (million) Forecast, by Application 2020 & 2033
- Table 32: Israel White Label Casino Solutions Revenue (million) Forecast, by Application 2020 & 2033
- Table 33: GCC White Label Casino Solutions Revenue (million) Forecast, by Application 2020 & 2033
- Table 34: North Africa White Label Casino Solutions Revenue (million) Forecast, by Application 2020 & 2033
- Table 35: South Africa White Label Casino Solutions Revenue (million) Forecast, by Application 2020 & 2033
- Table 36: Rest of Middle East & Africa White Label Casino Solutions Revenue (million) Forecast, by Application 2020 & 2033
- Table 37: Global White Label Casino Solutions Revenue million Forecast, by Application 2020 & 2033
- Table 38: Global White Label Casino Solutions Revenue million Forecast, by Types 2020 & 2033
- Table 39: Global White Label Casino Solutions Revenue million Forecast, by Country 2020 & 2033
- Table 40: China White Label Casino Solutions Revenue (million) Forecast, by Application 2020 & 2033
- Table 41: India White Label Casino Solutions Revenue (million) Forecast, by Application 2020 & 2033
- Table 42: Japan White Label Casino Solutions Revenue (million) Forecast, by Application 2020 & 2033
- Table 43: South Korea White Label Casino Solutions Revenue (million) Forecast, by Application 2020 & 2033
- Table 44: ASEAN White Label Casino Solutions Revenue (million) Forecast, by Application 2020 & 2033
- Table 45: Oceania White Label Casino Solutions Revenue (million) Forecast, by Application 2020 & 2033
- Table 46: Rest of Asia Pacific White Label Casino Solutions Revenue (million) Forecast, by Application 2020 & 2033
Frequently Asked Questions
1. What is the projected Compound Annual Growth Rate (CAGR) of the White Label Casino Solutions?
The projected CAGR is approximately XX%.
2. Which companies are prominent players in the White Label Casino Solutions?
Key companies in the market include Softswiss, Quantum Gaming, Sirplay, Lion Gaming, Revpanda Technology, Campeón Gaming, SoftGamings, Gammastack, Gamingtec, GR8 Tech, Maticz Technologies Private Limited, BetConstruct, Upgaming.
3. What are the main segments of the White Label Casino Solutions?
The market segments include Application, Types.
4. Can you provide details about the market size?
The market size is estimated to be USD XXX million as of 2022.
5. What are some drivers contributing to market growth?
N/A
6. What are the notable trends driving market growth?
N/A
7. Are there any restraints impacting market growth?
N/A
8. Can you provide examples of recent developments in the market?
N/A
9. What pricing options are available for accessing the report?
Pricing options include single-user, multi-user, and enterprise licenses priced at USD 4350.00, USD 6525.00, and USD 8700.00 respectively.
10. Is the market size provided in terms of value or volume?
The market size is provided in terms of value, measured in million.
11. Are there any specific market keywords associated with the report?
Yes, the market keyword associated with the report is "White Label Casino Solutions," which aids in identifying and referencing the specific market segment covered.
12. How do I determine which pricing option suits my needs best?
The pricing options vary based on user requirements and access needs. Individual users may opt for single-user licenses, while businesses requiring broader access may choose multi-user or enterprise licenses for cost-effective access to the report.
13. Are there any additional resources or data provided in the White Label Casino Solutions report?
While the report offers comprehensive insights, it's advisable to review the specific contents or supplementary materials provided to ascertain if additional resources or data are available.
14. How can I stay updated on further developments or reports in the White Label Casino Solutions?
To stay informed about further developments, trends, and reports in the White Label Casino Solutions, consider subscribing to industry newsletters, following relevant companies and organizations, or regularly checking reputable industry news sources and publications.
Methodology
Step 1 - Identification of Relevant Samples Size from Population Database


Step 2 - Approaches for Defining Global Market Size (Value, Volume* & Price*)

Note*: In applicable scenarios
Step 3 - Data Sources
Primary Research
- Web Analytics
- Survey Reports
- Research Institute
- Latest Research Reports
- Opinion Leaders
Secondary Research
- Annual Reports
- White Paper
- Latest Press Release
- Industry Association
- Paid Database
- Investor Presentations

Step 4 - Data Triangulation
Involves using different sources of information in order to increase the validity of a study
These sources are likely to be stakeholders in a program - participants, other researchers, program staff, other community members, and so on.
Then we put all data in single framework & apply various statistical tools to find out the dynamic on the market.
During the analysis stage, feedback from the stakeholder groups would be compared to determine areas of agreement as well as areas of divergence