

Key Insights
The surge protection components market is experiencing robust growth, driven by the increasing adoption of smart grids, renewable energy sources, and the expanding use of electronic devices across various sectors. The market's expansion is fueled by the rising need to safeguard sensitive equipment from voltage surges and power fluctuations, preventing costly damages and downtime. A significant factor contributing to this growth is the increasing awareness among businesses and consumers about the risks associated with power surges and the importance of preventive measures. Furthermore, stringent regulations regarding electrical safety in various regions are pushing the adoption of surge protection devices. The market is segmented based on component type (e.g., surge arresters, gas discharge tubes, metal oxide varistors), application (e.g., industrial, residential, commercial), and geography. Major players in the market are continuously investing in research and development to enhance product performance and introduce innovative solutions that meet evolving industry demands. This includes developing compact and cost-effective solutions, integrating surge protection into existing infrastructure more seamlessly, and creating devices that are more resilient to harsh environmental conditions.
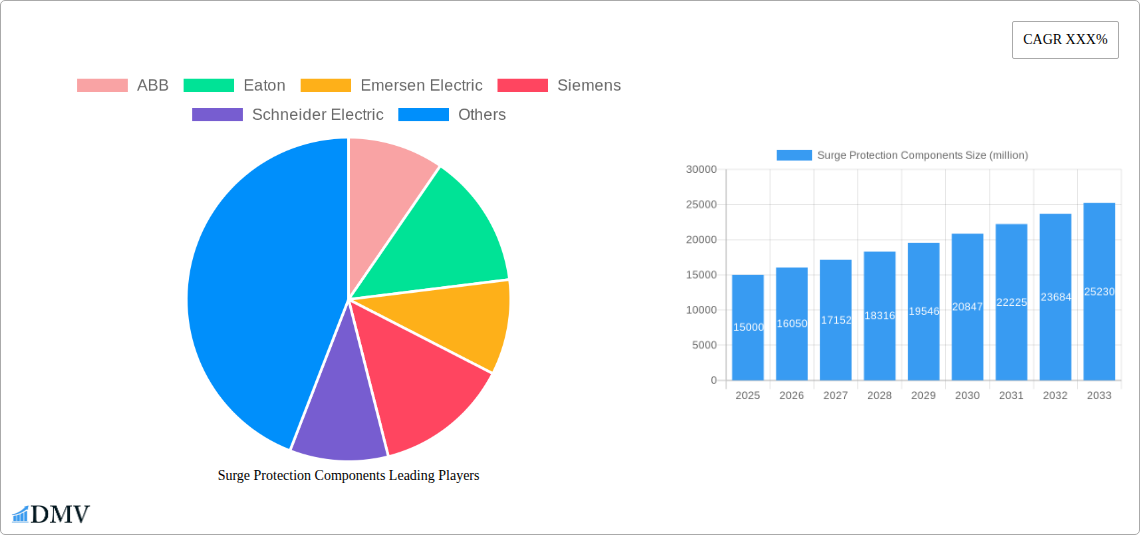
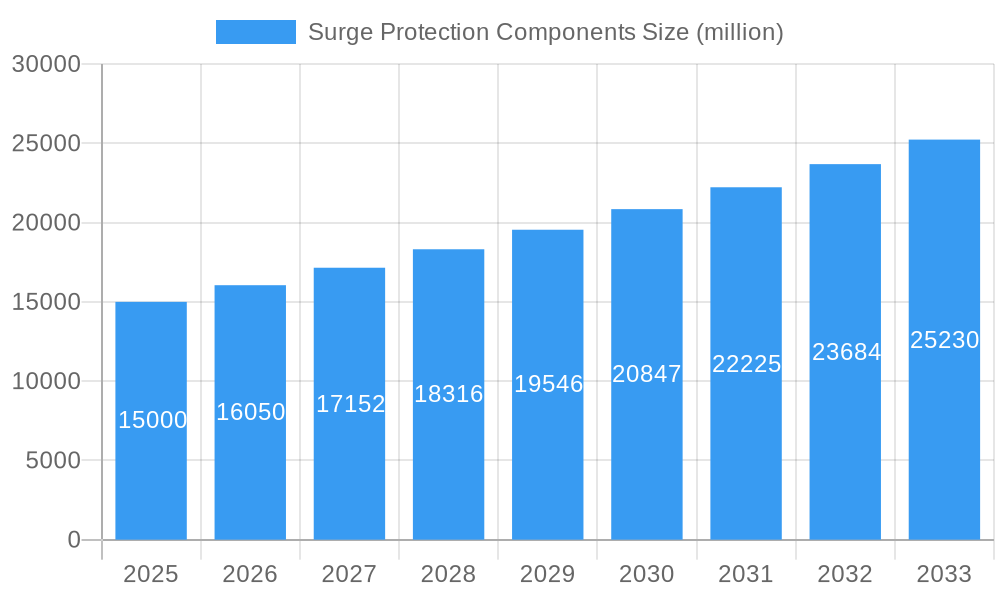
Surge Protection Components Market Size (In Billion)
The competitive landscape is marked by the presence of both established multinational corporations and specialized manufacturers. Companies are focusing on strategic partnerships, mergers, and acquisitions to expand their market reach and product portfolio. While the market enjoys healthy growth, challenges remain. These include the high initial investment cost of surge protection systems, which can be a barrier for adoption, particularly in developing economies. Additionally, maintaining and replacing surge protection components can incur ongoing expenses, requiring consideration in the overall cost-benefit analysis. Despite these challenges, the long-term growth prospects for the surge protection components market remain highly positive, driven by the ongoing electrification of various industries and the increasing reliance on sensitive electronic equipment. We estimate a market size of $15 billion in 2025, growing at a Compound Annual Growth Rate (CAGR) of 7% over the forecast period of 2025-2033, reflecting the positive market trends and consistent demand for robust surge protection solutions.
Surge Protection Components Company Market Share
Surge Protection Components Market: A Comprehensive Report (2019-2033)
This insightful report provides a comprehensive analysis of the global surge protection components market, projecting a market value exceeding $XX million by 2033. Spanning the historical period (2019-2024), base year (2025), and forecast period (2025-2033), this study offers a detailed understanding of market dynamics, growth drivers, and future opportunities. Key players like ABB, Eaton, and Siemens are profiled, alongside emerging competitors, providing a complete picture for stakeholders seeking strategic insights into this rapidly evolving market.
Surge Protection Components Market Composition & Trends
This section delves into the competitive landscape of the surge protection components market, evaluating market concentration, innovation drivers, regulatory influences, and substitution dynamics. The analysis covers mergers and acquisitions (M&A) activities, providing insights into deal values and their impact on market share. We explore end-user profiles across various sectors to understand application-specific trends.
Market Concentration & Share Distribution: The global surge protection components market exhibits a moderately concentrated structure, with the top five players—ABB, Eaton, Siemens, Schneider Electric, and Emerson Electric—holding an estimated XX% market share in 2025. Smaller players like Littelfuse and Belkin International collectively contribute a significant portion, indicating a dynamic competitive environment. The market share distribution is expected to evolve due to ongoing M&A activities and product innovations.
Innovation Catalysts & Regulatory Landscape: The market is driven by advancements in semiconductor technology, leading to more compact and efficient surge protection devices (SPDs). Stringent safety regulations concerning electrical equipment and infrastructure in various regions, such as Europe and North America, are crucial in driving demand. The increasing adoption of renewable energy sources also contributes significantly to market growth as these sources require robust surge protection mechanisms.
Substitute Products & End-User Profiles: While there are few direct substitutes for surge protection components, alternative designs and materials are continually being explored to reduce costs and improve performance. Key end-users include the power generation and distribution sectors, industrial automation, telecommunications, and residential/commercial buildings. The analysis details the specific needs and buying behaviors of each end-user segment.
M&A Activities: The past five years have witnessed numerous M&A activities within the surge protection components sector, with deal values totaling over $XX million. These transactions have aimed to enhance product portfolios, expand geographic reach, and consolidate market share. Notable transactions include [Insert details of specific M&A deals, if available].
Surge Protection Components Industry Evolution
This section analyzes the evolution of the surge protection components market over the study period (2019-2033), focusing on market growth trajectories, technological advancements, and shifting consumer demands. Data points illustrating growth rates, adoption metrics for specific technologies, and emerging trends are provided.
The surge protection components market experienced a Compound Annual Growth Rate (CAGR) of XX% during the historical period (2019-2024), driven by increasing urbanization, industrialization, and the rising adoption of smart grids. Technological advancements, such as the integration of miniaturized SPDs in various electronic devices, have also contributed significantly to market growth. The forecast period (2025-2033) projects a CAGR of XX%, fueled by [mention specific factors, e.g., growth of renewable energy sector, increasing demand for data centers]. The market is evolving from traditional surge protection devices to more sophisticated and integrated solutions incorporating advanced monitoring and diagnostics capabilities. The consumer demand is shifting towards compact and energy-efficient solutions with increased reliability and extended lifespan.
Leading Regions, Countries, or Segments in Surge Protection Components
This section identifies the dominant regions, countries, or segments within the surge protection components market. We analyze the key factors driving their dominance, providing both quantitative and qualitative insights.
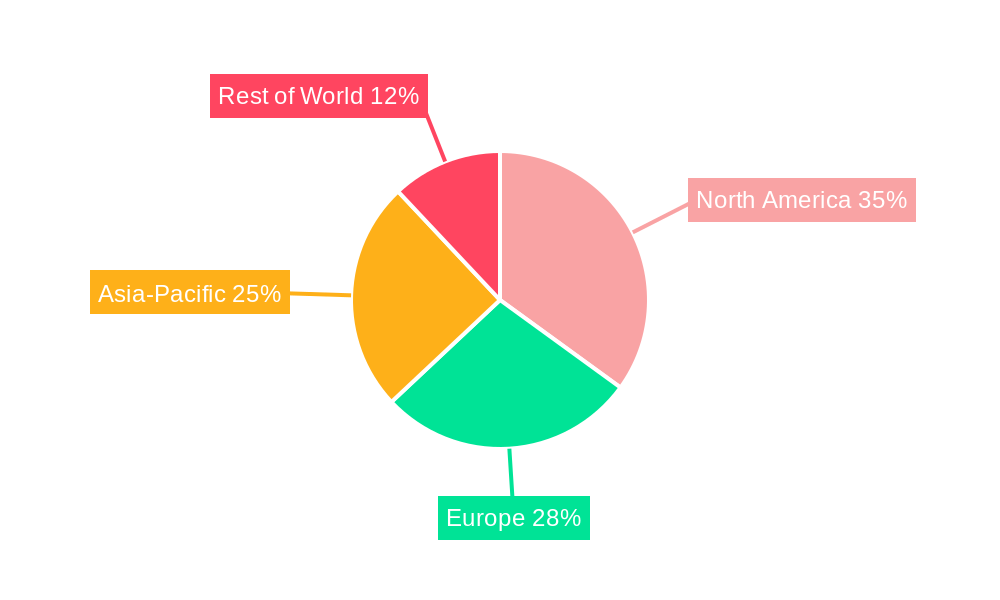
- North America: The region holds a significant market share due to high investments in infrastructure development, stringent safety regulations, and a robust industrial base. High adoption of smart homes and buildings is a key factor contributing to the region's market leadership.
- Europe: Stricter environmental regulations and the expansion of renewable energy sources are accelerating the adoption of advanced surge protection technologies in this region.
- Asia-Pacific: Rapid industrialization and urbanization, particularly in China and India, are driving substantial demand for surge protection components. Government support for renewable energy projects further boosts market growth.
Dominance Factors: The dominance of certain regions and segments is driven by a combination of economic factors (infrastructure spending, industrial activity), technological advancements (adoption of smart grids and renewable energy), and regulatory landscapes (stringent safety and environmental standards). [Further expand on the unique factors for each region/segment].
Surge Protection Components Product Innovations
Recent product innovations in the surge protection components market include the development of miniaturized SPDs incorporating advanced semiconductor technologies, enabling greater integration into electronic devices. These innovations offer enhanced performance characteristics such as faster response times, increased energy absorption capabilities, and improved surge current handling. Unique selling propositions (USPs) focus on improved reliability, efficiency, and cost-effectiveness. The introduction of smart surge protection devices with remote monitoring and diagnostic capabilities represents a significant step towards proactive maintenance and improved system uptime.
Propelling Factors for Surge Protection Components Growth
Several factors propel the growth of the surge protection components market. The rising adoption of renewable energy sources necessitates robust surge protection systems. Increased industrial automation and the expanding telecommunications sector also fuel demand. Stringent government regulations regarding electrical safety standards further drive market expansion. Moreover, the growing adoption of IoT devices and smart homes is accelerating market growth.
Obstacles in the Surge Protection Components Market
Despite promising growth prospects, the surge protection components market faces challenges. Supply chain disruptions and increasing raw material prices impact production costs and profitability. Intense competition among established players and emerging entrants exerts downward pressure on pricing. Furthermore, the complexity of integrating advanced surge protection solutions into existing infrastructure presents a hurdle for widespread adoption. These factors potentially constrain market expansion.
Future Opportunities in Surge Protection Components
Emerging opportunities exist in integrating surge protection components with IoT devices for real-time monitoring and predictive maintenance. Expansion into new markets, such as electric vehicles and aerospace, offers significant growth potential. Advancements in materials science and semiconductor technology are paving the way for more efficient and reliable surge protection solutions. These opportunities contribute to the positive outlook for market growth.
Major Players in the Surge Protection Components Ecosystem
- ABB
- Eaton
- Emerson Electric
- Siemens
- Schneider Electric
- General Electric
- Koninklijke Philips
- Littelfuse
- Advanced Protection Technologies
- Belkin International
- Leviton Manufacturing
- Tripp Lite
- Panamax
- REV Ritter
- Raycap Corporation
- Phoenix Contact GmbH
- Hubbell Incorporated
- Legrand SA
- Mersen Electrical Power
- Citel
- MVC-Maxivolt
- MCG Surge Protection
- JMV
- ISG Global
Key Developments in Surge Protection Components Industry
- 2022-Q4: ABB launched a new range of miniaturized surge protection devices.
- 2023-Q1: Eaton and Siemens announced a joint venture focused on developing advanced surge protection technologies for renewable energy applications.
- 2023-Q2: Littelfuse acquired a smaller surge protection component manufacturer, expanding its product portfolio.
- [Add further developments with specific dates and impacts]
Strategic Surge Protection Components Market Forecast
The surge protection components market is poised for robust growth driven by increasing demand from various sectors, including renewable energy, industrial automation, and telecommunications. Technological advancements, particularly in semiconductor technology, will continue to drive innovation and product improvements. Government regulations and environmental concerns will further fuel demand for reliable and efficient surge protection solutions, creating significant opportunities for market expansion in the coming years. The market's future is bright, promising sustained growth and increased market value well into the forecast period.
Surge Protection Components Segmentation
-
1. Application
- 1.1. Industrial
- 1.2. Commercial
- 1.3. Residential
-
2. Type
- 2.1. Below 10 kA
- 2.2. 10 kA-25 kA
- 2.3. Above 25 kA
Surge Protection Components Segmentation By Geography
-
1. North America
- 1.1. United States
- 1.2. Canada
- 1.3. Mexico
-
2. South America
- 2.1. Brazil
- 2.2. Argentina
- 2.3. Rest of South America
-
3. Europe
- 3.1. United Kingdom
- 3.2. Germany
- 3.3. France
- 3.4. Italy
- 3.5. Spain
- 3.6. Russia
- 3.7. Benelux
- 3.8. Nordics
- 3.9. Rest of Europe
-
4. Middle East & Africa
- 4.1. Turkey
- 4.2. Israel
- 4.3. GCC
- 4.4. North Africa
- 4.5. South Africa
- 4.6. Rest of Middle East & Africa
-
5. Asia Pacific
- 5.1. China
- 5.2. India
- 5.3. Japan
- 5.4. South Korea
- 5.5. ASEAN
- 5.6. Oceania
- 5.7. Rest of Asia Pacific
Surge Protection Components Regional Market Share
Geographic Coverage of Surge Protection Components
Surge Protection Components REPORT HIGHLIGHTS
| Aspects | Details |
|---|---|
| Study Period | 2020-2034 |
| Base Year | 2025 |
| Estimated Year | 2026 |
| Forecast Period | 2026-2034 |
| Historical Period | 2020-2025 |
| Growth Rate | CAGR of XXX% from 2020-2034 |
| Segmentation |
|
Table of Contents
- 1. Introduction
- 1.1. Research Scope
- 1.2. Market Segmentation
- 1.3. Research Methodology
- 1.4. Definitions and Assumptions
- 2. Executive Summary
- 2.1. Introduction
- 3. Market Dynamics
- 3.1. Introduction
- 3.2. Market Drivers
- 3.3. Market Restrains
- 3.4. Market Trends
- 4. Market Factor Analysis
- 4.1. Porters Five Forces
- 4.2. Supply/Value Chain
- 4.3. PESTEL analysis
- 4.4. Market Entropy
- 4.5. Patent/Trademark Analysis
- 5. Global Surge Protection Components Analysis, Insights and Forecast, 2020-2032
- 5.1. Market Analysis, Insights and Forecast - by Application
- 5.1.1. Industrial
- 5.1.2. Commercial
- 5.1.3. Residential
- 5.2. Market Analysis, Insights and Forecast - by Type
- 5.2.1. Below 10 kA
- 5.2.2. 10 kA-25 kA
- 5.2.3. Above 25 kA
- 5.3. Market Analysis, Insights and Forecast - by Region
- 5.3.1. North America
- 5.3.2. South America
- 5.3.3. Europe
- 5.3.4. Middle East & Africa
- 5.3.5. Asia Pacific
- 5.1. Market Analysis, Insights and Forecast - by Application
- 6. North America Surge Protection Components Analysis, Insights and Forecast, 2020-2032
- 6.1. Market Analysis, Insights and Forecast - by Application
- 6.1.1. Industrial
- 6.1.2. Commercial
- 6.1.3. Residential
- 6.2. Market Analysis, Insights and Forecast - by Type
- 6.2.1. Below 10 kA
- 6.2.2. 10 kA-25 kA
- 6.2.3. Above 25 kA
- 6.1. Market Analysis, Insights and Forecast - by Application
- 7. South America Surge Protection Components Analysis, Insights and Forecast, 2020-2032
- 7.1. Market Analysis, Insights and Forecast - by Application
- 7.1.1. Industrial
- 7.1.2. Commercial
- 7.1.3. Residential
- 7.2. Market Analysis, Insights and Forecast - by Type
- 7.2.1. Below 10 kA
- 7.2.2. 10 kA-25 kA
- 7.2.3. Above 25 kA
- 7.1. Market Analysis, Insights and Forecast - by Application
- 8. Europe Surge Protection Components Analysis, Insights and Forecast, 2020-2032
- 8.1. Market Analysis, Insights and Forecast - by Application
- 8.1.1. Industrial
- 8.1.2. Commercial
- 8.1.3. Residential
- 8.2. Market Analysis, Insights and Forecast - by Type
- 8.2.1. Below 10 kA
- 8.2.2. 10 kA-25 kA
- 8.2.3. Above 25 kA
- 8.1. Market Analysis, Insights and Forecast - by Application
- 9. Middle East & Africa Surge Protection Components Analysis, Insights and Forecast, 2020-2032
- 9.1. Market Analysis, Insights and Forecast - by Application
- 9.1.1. Industrial
- 9.1.2. Commercial
- 9.1.3. Residential
- 9.2. Market Analysis, Insights and Forecast - by Type
- 9.2.1. Below 10 kA
- 9.2.2. 10 kA-25 kA
- 9.2.3. Above 25 kA
- 9.1. Market Analysis, Insights and Forecast - by Application
- 10. Asia Pacific Surge Protection Components Analysis, Insights and Forecast, 2020-2032
- 10.1. Market Analysis, Insights and Forecast - by Application
- 10.1.1. Industrial
- 10.1.2. Commercial
- 10.1.3. Residential
- 10.2. Market Analysis, Insights and Forecast - by Type
- 10.2.1. Below 10 kA
- 10.2.2. 10 kA-25 kA
- 10.2.3. Above 25 kA
- 10.1. Market Analysis, Insights and Forecast - by Application
- 11. Competitive Analysis
- 11.1. Global Market Share Analysis 2025
- 11.2. Company Profiles
- 11.2.1 ABB
- 11.2.1.1. Overview
- 11.2.1.2. Products
- 11.2.1.3. SWOT Analysis
- 11.2.1.4. Recent Developments
- 11.2.1.5. Financials (Based on Availability)
- 11.2.2 Eaton
- 11.2.2.1. Overview
- 11.2.2.2. Products
- 11.2.2.3. SWOT Analysis
- 11.2.2.4. Recent Developments
- 11.2.2.5. Financials (Based on Availability)
- 11.2.3 Emersen Electric
- 11.2.3.1. Overview
- 11.2.3.2. Products
- 11.2.3.3. SWOT Analysis
- 11.2.3.4. Recent Developments
- 11.2.3.5. Financials (Based on Availability)
- 11.2.4 Siemens
- 11.2.4.1. Overview
- 11.2.4.2. Products
- 11.2.4.3. SWOT Analysis
- 11.2.4.4. Recent Developments
- 11.2.4.5. Financials (Based on Availability)
- 11.2.5 Schneider Electric
- 11.2.5.1. Overview
- 11.2.5.2. Products
- 11.2.5.3. SWOT Analysis
- 11.2.5.4. Recent Developments
- 11.2.5.5. Financials (Based on Availability)
- 11.2.6 General Electric
- 11.2.6.1. Overview
- 11.2.6.2. Products
- 11.2.6.3. SWOT Analysis
- 11.2.6.4. Recent Developments
- 11.2.6.5. Financials (Based on Availability)
- 11.2.7 Koninklijke Philips
- 11.2.7.1. Overview
- 11.2.7.2. Products
- 11.2.7.3. SWOT Analysis
- 11.2.7.4. Recent Developments
- 11.2.7.5. Financials (Based on Availability)
- 11.2.8 Littelfuse
- 11.2.8.1. Overview
- 11.2.8.2. Products
- 11.2.8.3. SWOT Analysis
- 11.2.8.4. Recent Developments
- 11.2.8.5. Financials (Based on Availability)
- 11.2.9 Advanced Protection Technologies
- 11.2.9.1. Overview
- 11.2.9.2. Products
- 11.2.9.3. SWOT Analysis
- 11.2.9.4. Recent Developments
- 11.2.9.5. Financials (Based on Availability)
- 11.2.10 Belkin International
- 11.2.10.1. Overview
- 11.2.10.2. Products
- 11.2.10.3. SWOT Analysis
- 11.2.10.4. Recent Developments
- 11.2.10.5. Financials (Based on Availability)
- 11.2.11 Leviton Manufacturing
- 11.2.11.1. Overview
- 11.2.11.2. Products
- 11.2.11.3. SWOT Analysis
- 11.2.11.4. Recent Developments
- 11.2.11.5. Financials (Based on Availability)
- 11.2.12 Tripp Lite
- 11.2.12.1. Overview
- 11.2.12.2. Products
- 11.2.12.3. SWOT Analysis
- 11.2.12.4. Recent Developments
- 11.2.12.5. Financials (Based on Availability)
- 11.2.13 Panamax
- 11.2.13.1. Overview
- 11.2.13.2. Products
- 11.2.13.3. SWOT Analysis
- 11.2.13.4. Recent Developments
- 11.2.13.5. Financials (Based on Availability)
- 11.2.14 REV Ritter
- 11.2.14.1. Overview
- 11.2.14.2. Products
- 11.2.14.3. SWOT Analysis
- 11.2.14.4. Recent Developments
- 11.2.14.5. Financials (Based on Availability)
- 11.2.15 Raycap Corporation
- 11.2.15.1. Overview
- 11.2.15.2. Products
- 11.2.15.3. SWOT Analysis
- 11.2.15.4. Recent Developments
- 11.2.15.5. Financials (Based on Availability)
- 11.2.16 Phoenix Contact GmbH
- 11.2.16.1. Overview
- 11.2.16.2. Products
- 11.2.16.3. SWOT Analysis
- 11.2.16.4. Recent Developments
- 11.2.16.5. Financials (Based on Availability)
- 11.2.17 Hubbell Incorporated
- 11.2.17.1. Overview
- 11.2.17.2. Products
- 11.2.17.3. SWOT Analysis
- 11.2.17.4. Recent Developments
- 11.2.17.5. Financials (Based on Availability)
- 11.2.18 Legrand SA
- 11.2.18.1. Overview
- 11.2.18.2. Products
- 11.2.18.3. SWOT Analysis
- 11.2.18.4. Recent Developments
- 11.2.18.5. Financials (Based on Availability)
- 11.2.19 Mersen Electrical Power
- 11.2.19.1. Overview
- 11.2.19.2. Products
- 11.2.19.3. SWOT Analysis
- 11.2.19.4. Recent Developments
- 11.2.19.5. Financials (Based on Availability)
- 11.2.20 Citel
- 11.2.20.1. Overview
- 11.2.20.2. Products
- 11.2.20.3. SWOT Analysis
- 11.2.20.4. Recent Developments
- 11.2.20.5. Financials (Based on Availability)
- 11.2.21 MVC-Maxivolt
- 11.2.21.1. Overview
- 11.2.21.2. Products
- 11.2.21.3. SWOT Analysis
- 11.2.21.4. Recent Developments
- 11.2.21.5. Financials (Based on Availability)
- 11.2.22 MCG Surge Protection
- 11.2.22.1. Overview
- 11.2.22.2. Products
- 11.2.22.3. SWOT Analysis
- 11.2.22.4. Recent Developments
- 11.2.22.5. Financials (Based on Availability)
- 11.2.23 JMV
- 11.2.23.1. Overview
- 11.2.23.2. Products
- 11.2.23.3. SWOT Analysis
- 11.2.23.4. Recent Developments
- 11.2.23.5. Financials (Based on Availability)
- 11.2.24 ISG Global
- 11.2.24.1. Overview
- 11.2.24.2. Products
- 11.2.24.3. SWOT Analysis
- 11.2.24.4. Recent Developments
- 11.2.24.5. Financials (Based on Availability)
- 11.2.1 ABB
List of Figures
- Figure 1: Global Surge Protection Components Revenue Breakdown (million, %) by Region 2025 & 2033
- Figure 2: Global Surge Protection Components Volume Breakdown (K, %) by Region 2025 & 2033
- Figure 3: North America Surge Protection Components Revenue (million), by Application 2025 & 2033
- Figure 4: North America Surge Protection Components Volume (K), by Application 2025 & 2033
- Figure 5: North America Surge Protection Components Revenue Share (%), by Application 2025 & 2033
- Figure 6: North America Surge Protection Components Volume Share (%), by Application 2025 & 2033
- Figure 7: North America Surge Protection Components Revenue (million), by Type 2025 & 2033
- Figure 8: North America Surge Protection Components Volume (K), by Type 2025 & 2033
- Figure 9: North America Surge Protection Components Revenue Share (%), by Type 2025 & 2033
- Figure 10: North America Surge Protection Components Volume Share (%), by Type 2025 & 2033
- Figure 11: North America Surge Protection Components Revenue (million), by Country 2025 & 2033
- Figure 12: North America Surge Protection Components Volume (K), by Country 2025 & 2033
- Figure 13: North America Surge Protection Components Revenue Share (%), by Country 2025 & 2033
- Figure 14: North America Surge Protection Components Volume Share (%), by Country 2025 & 2033
- Figure 15: South America Surge Protection Components Revenue (million), by Application 2025 & 2033
- Figure 16: South America Surge Protection Components Volume (K), by Application 2025 & 2033
- Figure 17: South America Surge Protection Components Revenue Share (%), by Application 2025 & 2033
- Figure 18: South America Surge Protection Components Volume Share (%), by Application 2025 & 2033
- Figure 19: South America Surge Protection Components Revenue (million), by Type 2025 & 2033
- Figure 20: South America Surge Protection Components Volume (K), by Type 2025 & 2033
- Figure 21: South America Surge Protection Components Revenue Share (%), by Type 2025 & 2033
- Figure 22: South America Surge Protection Components Volume Share (%), by Type 2025 & 2033
- Figure 23: South America Surge Protection Components Revenue (million), by Country 2025 & 2033
- Figure 24: South America Surge Protection Components Volume (K), by Country 2025 & 2033
- Figure 25: South America Surge Protection Components Revenue Share (%), by Country 2025 & 2033
- Figure 26: South America Surge Protection Components Volume Share (%), by Country 2025 & 2033
- Figure 27: Europe Surge Protection Components Revenue (million), by Application 2025 & 2033
- Figure 28: Europe Surge Protection Components Volume (K), by Application 2025 & 2033
- Figure 29: Europe Surge Protection Components Revenue Share (%), by Application 2025 & 2033
- Figure 30: Europe Surge Protection Components Volume Share (%), by Application 2025 & 2033
- Figure 31: Europe Surge Protection Components Revenue (million), by Type 2025 & 2033
- Figure 32: Europe Surge Protection Components Volume (K), by Type 2025 & 2033
- Figure 33: Europe Surge Protection Components Revenue Share (%), by Type 2025 & 2033
- Figure 34: Europe Surge Protection Components Volume Share (%), by Type 2025 & 2033
- Figure 35: Europe Surge Protection Components Revenue (million), by Country 2025 & 2033
- Figure 36: Europe Surge Protection Components Volume (K), by Country 2025 & 2033
- Figure 37: Europe Surge Protection Components Revenue Share (%), by Country 2025 & 2033
- Figure 38: Europe Surge Protection Components Volume Share (%), by Country 2025 & 2033
- Figure 39: Middle East & Africa Surge Protection Components Revenue (million), by Application 2025 & 2033
- Figure 40: Middle East & Africa Surge Protection Components Volume (K), by Application 2025 & 2033
- Figure 41: Middle East & Africa Surge Protection Components Revenue Share (%), by Application 2025 & 2033
- Figure 42: Middle East & Africa Surge Protection Components Volume Share (%), by Application 2025 & 2033
- Figure 43: Middle East & Africa Surge Protection Components Revenue (million), by Type 2025 & 2033
- Figure 44: Middle East & Africa Surge Protection Components Volume (K), by Type 2025 & 2033
- Figure 45: Middle East & Africa Surge Protection Components Revenue Share (%), by Type 2025 & 2033
- Figure 46: Middle East & Africa Surge Protection Components Volume Share (%), by Type 2025 & 2033
- Figure 47: Middle East & Africa Surge Protection Components Revenue (million), by Country 2025 & 2033
- Figure 48: Middle East & Africa Surge Protection Components Volume (K), by Country 2025 & 2033
- Figure 49: Middle East & Africa Surge Protection Components Revenue Share (%), by Country 2025 & 2033
- Figure 50: Middle East & Africa Surge Protection Components Volume Share (%), by Country 2025 & 2033
- Figure 51: Asia Pacific Surge Protection Components Revenue (million), by Application 2025 & 2033
- Figure 52: Asia Pacific Surge Protection Components Volume (K), by Application 2025 & 2033
- Figure 53: Asia Pacific Surge Protection Components Revenue Share (%), by Application 2025 & 2033
- Figure 54: Asia Pacific Surge Protection Components Volume Share (%), by Application 2025 & 2033
- Figure 55: Asia Pacific Surge Protection Components Revenue (million), by Type 2025 & 2033
- Figure 56: Asia Pacific Surge Protection Components Volume (K), by Type 2025 & 2033
- Figure 57: Asia Pacific Surge Protection Components Revenue Share (%), by Type 2025 & 2033
- Figure 58: Asia Pacific Surge Protection Components Volume Share (%), by Type 2025 & 2033
- Figure 59: Asia Pacific Surge Protection Components Revenue (million), by Country 2025 & 2033
- Figure 60: Asia Pacific Surge Protection Components Volume (K), by Country 2025 & 2033
- Figure 61: Asia Pacific Surge Protection Components Revenue Share (%), by Country 2025 & 2033
- Figure 62: Asia Pacific Surge Protection Components Volume Share (%), by Country 2025 & 2033
List of Tables
- Table 1: Global Surge Protection Components Revenue million Forecast, by Application 2020 & 2033
- Table 2: Global Surge Protection Components Volume K Forecast, by Application 2020 & 2033
- Table 3: Global Surge Protection Components Revenue million Forecast, by Type 2020 & 2033
- Table 4: Global Surge Protection Components Volume K Forecast, by Type 2020 & 2033
- Table 5: Global Surge Protection Components Revenue million Forecast, by Region 2020 & 2033
- Table 6: Global Surge Protection Components Volume K Forecast, by Region 2020 & 2033
- Table 7: Global Surge Protection Components Revenue million Forecast, by Application 2020 & 2033
- Table 8: Global Surge Protection Components Volume K Forecast, by Application 2020 & 2033
- Table 9: Global Surge Protection Components Revenue million Forecast, by Type 2020 & 2033
- Table 10: Global Surge Protection Components Volume K Forecast, by Type 2020 & 2033
- Table 11: Global Surge Protection Components Revenue million Forecast, by Country 2020 & 2033
- Table 12: Global Surge Protection Components Volume K Forecast, by Country 2020 & 2033
- Table 13: United States Surge Protection Components Revenue (million) Forecast, by Application 2020 & 2033
- Table 14: United States Surge Protection Components Volume (K) Forecast, by Application 2020 & 2033
- Table 15: Canada Surge Protection Components Revenue (million) Forecast, by Application 2020 & 2033
- Table 16: Canada Surge Protection Components Volume (K) Forecast, by Application 2020 & 2033
- Table 17: Mexico Surge Protection Components Revenue (million) Forecast, by Application 2020 & 2033
- Table 18: Mexico Surge Protection Components Volume (K) Forecast, by Application 2020 & 2033
- Table 19: Global Surge Protection Components Revenue million Forecast, by Application 2020 & 2033
- Table 20: Global Surge Protection Components Volume K Forecast, by Application 2020 & 2033
- Table 21: Global Surge Protection Components Revenue million Forecast, by Type 2020 & 2033
- Table 22: Global Surge Protection Components Volume K Forecast, by Type 2020 & 2033
- Table 23: Global Surge Protection Components Revenue million Forecast, by Country 2020 & 2033
- Table 24: Global Surge Protection Components Volume K Forecast, by Country 2020 & 2033
- Table 25: Brazil Surge Protection Components Revenue (million) Forecast, by Application 2020 & 2033
- Table 26: Brazil Surge Protection Components Volume (K) Forecast, by Application 2020 & 2033
- Table 27: Argentina Surge Protection Components Revenue (million) Forecast, by Application 2020 & 2033
- Table 28: Argentina Surge Protection Components Volume (K) Forecast, by Application 2020 & 2033
- Table 29: Rest of South America Surge Protection Components Revenue (million) Forecast, by Application 2020 & 2033
- Table 30: Rest of South America Surge Protection Components Volume (K) Forecast, by Application 2020 & 2033
- Table 31: Global Surge Protection Components Revenue million Forecast, by Application 2020 & 2033
- Table 32: Global Surge Protection Components Volume K Forecast, by Application 2020 & 2033
- Table 33: Global Surge Protection Components Revenue million Forecast, by Type 2020 & 2033
- Table 34: Global Surge Protection Components Volume K Forecast, by Type 2020 & 2033
- Table 35: Global Surge Protection Components Revenue million Forecast, by Country 2020 & 2033
- Table 36: Global Surge Protection Components Volume K Forecast, by Country 2020 & 2033
- Table 37: United Kingdom Surge Protection Components Revenue (million) Forecast, by Application 2020 & 2033
- Table 38: United Kingdom Surge Protection Components Volume (K) Forecast, by Application 2020 & 2033
- Table 39: Germany Surge Protection Components Revenue (million) Forecast, by Application 2020 & 2033
- Table 40: Germany Surge Protection Components Volume (K) Forecast, by Application 2020 & 2033
- Table 41: France Surge Protection Components Revenue (million) Forecast, by Application 2020 & 2033
- Table 42: France Surge Protection Components Volume (K) Forecast, by Application 2020 & 2033
- Table 43: Italy Surge Protection Components Revenue (million) Forecast, by Application 2020 & 2033
- Table 44: Italy Surge Protection Components Volume (K) Forecast, by Application 2020 & 2033
- Table 45: Spain Surge Protection Components Revenue (million) Forecast, by Application 2020 & 2033
- Table 46: Spain Surge Protection Components Volume (K) Forecast, by Application 2020 & 2033
- Table 47: Russia Surge Protection Components Revenue (million) Forecast, by Application 2020 & 2033
- Table 48: Russia Surge Protection Components Volume (K) Forecast, by Application 2020 & 2033
- Table 49: Benelux Surge Protection Components Revenue (million) Forecast, by Application 2020 & 2033
- Table 50: Benelux Surge Protection Components Volume (K) Forecast, by Application 2020 & 2033
- Table 51: Nordics Surge Protection Components Revenue (million) Forecast, by Application 2020 & 2033
- Table 52: Nordics Surge Protection Components Volume (K) Forecast, by Application 2020 & 2033
- Table 53: Rest of Europe Surge Protection Components Revenue (million) Forecast, by Application 2020 & 2033
- Table 54: Rest of Europe Surge Protection Components Volume (K) Forecast, by Application 2020 & 2033
- Table 55: Global Surge Protection Components Revenue million Forecast, by Application 2020 & 2033
- Table 56: Global Surge Protection Components Volume K Forecast, by Application 2020 & 2033
- Table 57: Global Surge Protection Components Revenue million Forecast, by Type 2020 & 2033
- Table 58: Global Surge Protection Components Volume K Forecast, by Type 2020 & 2033
- Table 59: Global Surge Protection Components Revenue million Forecast, by Country 2020 & 2033
- Table 60: Global Surge Protection Components Volume K Forecast, by Country 2020 & 2033
- Table 61: Turkey Surge Protection Components Revenue (million) Forecast, by Application 2020 & 2033
- Table 62: Turkey Surge Protection Components Volume (K) Forecast, by Application 2020 & 2033
- Table 63: Israel Surge Protection Components Revenue (million) Forecast, by Application 2020 & 2033
- Table 64: Israel Surge Protection Components Volume (K) Forecast, by Application 2020 & 2033
- Table 65: GCC Surge Protection Components Revenue (million) Forecast, by Application 2020 & 2033
- Table 66: GCC Surge Protection Components Volume (K) Forecast, by Application 2020 & 2033
- Table 67: North Africa Surge Protection Components Revenue (million) Forecast, by Application 2020 & 2033
- Table 68: North Africa Surge Protection Components Volume (K) Forecast, by Application 2020 & 2033
- Table 69: South Africa Surge Protection Components Revenue (million) Forecast, by Application 2020 & 2033
- Table 70: South Africa Surge Protection Components Volume (K) Forecast, by Application 2020 & 2033
- Table 71: Rest of Middle East & Africa Surge Protection Components Revenue (million) Forecast, by Application 2020 & 2033
- Table 72: Rest of Middle East & Africa Surge Protection Components Volume (K) Forecast, by Application 2020 & 2033
- Table 73: Global Surge Protection Components Revenue million Forecast, by Application 2020 & 2033
- Table 74: Global Surge Protection Components Volume K Forecast, by Application 2020 & 2033
- Table 75: Global Surge Protection Components Revenue million Forecast, by Type 2020 & 2033
- Table 76: Global Surge Protection Components Volume K Forecast, by Type 2020 & 2033
- Table 77: Global Surge Protection Components Revenue million Forecast, by Country 2020 & 2033
- Table 78: Global Surge Protection Components Volume K Forecast, by Country 2020 & 2033
- Table 79: China Surge Protection Components Revenue (million) Forecast, by Application 2020 & 2033
- Table 80: China Surge Protection Components Volume (K) Forecast, by Application 2020 & 2033
- Table 81: India Surge Protection Components Revenue (million) Forecast, by Application 2020 & 2033
- Table 82: India Surge Protection Components Volume (K) Forecast, by Application 2020 & 2033
- Table 83: Japan Surge Protection Components Revenue (million) Forecast, by Application 2020 & 2033
- Table 84: Japan Surge Protection Components Volume (K) Forecast, by Application 2020 & 2033
- Table 85: South Korea Surge Protection Components Revenue (million) Forecast, by Application 2020 & 2033
- Table 86: South Korea Surge Protection Components Volume (K) Forecast, by Application 2020 & 2033
- Table 87: ASEAN Surge Protection Components Revenue (million) Forecast, by Application 2020 & 2033
- Table 88: ASEAN Surge Protection Components Volume (K) Forecast, by Application 2020 & 2033
- Table 89: Oceania Surge Protection Components Revenue (million) Forecast, by Application 2020 & 2033
- Table 90: Oceania Surge Protection Components Volume (K) Forecast, by Application 2020 & 2033
- Table 91: Rest of Asia Pacific Surge Protection Components Revenue (million) Forecast, by Application 2020 & 2033
- Table 92: Rest of Asia Pacific Surge Protection Components Volume (K) Forecast, by Application 2020 & 2033
Frequently Asked Questions
1. What is the projected Compound Annual Growth Rate (CAGR) of the Surge Protection Components?
The projected CAGR is approximately XXX%.
2. Which companies are prominent players in the Surge Protection Components?
Key companies in the market include ABB, Eaton, Emersen Electric, Siemens, Schneider Electric, General Electric, Koninklijke Philips, Littelfuse, Advanced Protection Technologies, Belkin International, Leviton Manufacturing, Tripp Lite, Panamax, REV Ritter, Raycap Corporation, Phoenix Contact GmbH, Hubbell Incorporated, Legrand SA, Mersen Electrical Power, Citel, MVC-Maxivolt, MCG Surge Protection, JMV, ISG Global.
3. What are the main segments of the Surge Protection Components?
The market segments include Application, Type.
4. Can you provide details about the market size?
The market size is estimated to be USD XXX million as of 2022.
5. What are some drivers contributing to market growth?
N/A
6. What are the notable trends driving market growth?
N/A
7. Are there any restraints impacting market growth?
N/A
8. Can you provide examples of recent developments in the market?
N/A
9. What pricing options are available for accessing the report?
Pricing options include single-user, multi-user, and enterprise licenses priced at USD 3950.00, USD 5925.00, and USD 7900.00 respectively.
10. Is the market size provided in terms of value or volume?
The market size is provided in terms of value, measured in million and volume, measured in K.
11. Are there any specific market keywords associated with the report?
Yes, the market keyword associated with the report is "Surge Protection Components," which aids in identifying and referencing the specific market segment covered.
12. How do I determine which pricing option suits my needs best?
The pricing options vary based on user requirements and access needs. Individual users may opt for single-user licenses, while businesses requiring broader access may choose multi-user or enterprise licenses for cost-effective access to the report.
13. Are there any additional resources or data provided in the Surge Protection Components report?
While the report offers comprehensive insights, it's advisable to review the specific contents or supplementary materials provided to ascertain if additional resources or data are available.
14. How can I stay updated on further developments or reports in the Surge Protection Components?
To stay informed about further developments, trends, and reports in the Surge Protection Components, consider subscribing to industry newsletters, following relevant companies and organizations, or regularly checking reputable industry news sources and publications.
Methodology
Step 1 - Identification of Relevant Samples Size from Population Database


Step 2 - Approaches for Defining Global Market Size (Value, Volume* & Price*)

Note*: In applicable scenarios
Step 3 - Data Sources
Primary Research
- Web Analytics
- Survey Reports
- Research Institute
- Latest Research Reports
- Opinion Leaders
Secondary Research
- Annual Reports
- White Paper
- Latest Press Release
- Industry Association
- Paid Database
- Investor Presentations

Step 4 - Data Triangulation
Involves using different sources of information in order to increase the validity of a study
These sources are likely to be stakeholders in a program - participants, other researchers, program staff, other community members, and so on.
Then we put all data in single framework & apply various statistical tools to find out the dynamic on the market.
During the analysis stage, feedback from the stakeholder groups would be compared to determine areas of agreement as well as areas of divergence