

Key Insights
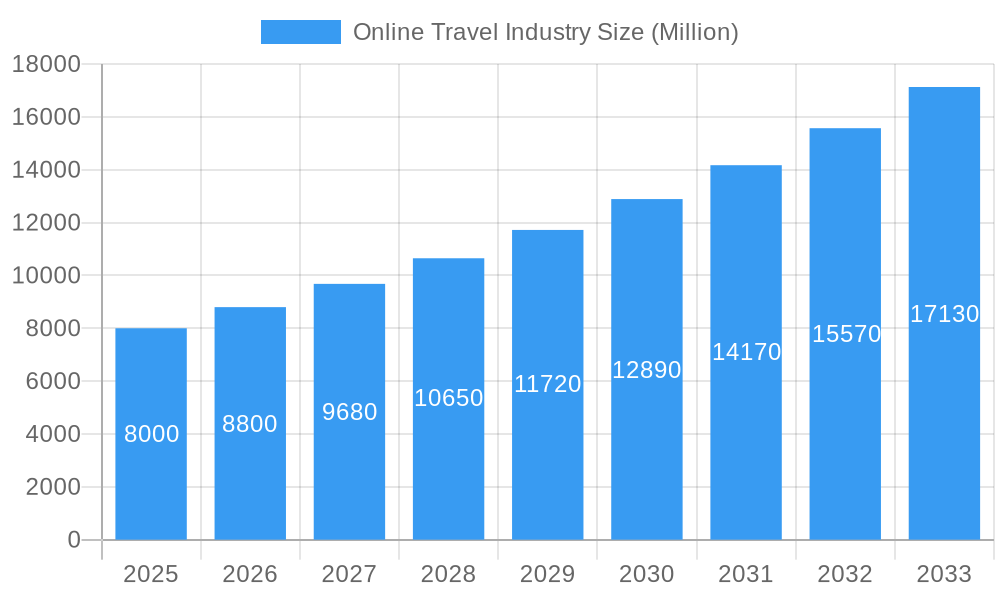
The online travel market is poised for significant expansion, projected to reach a market size of $622.6 billion by 2025, with a robust Compound Annual Growth Rate (CAGR) of 9.75% from the 2025 base year. This growth is propelled by key factors including widespread smartphone adoption and global high-speed internet access, simplifying online booking processes. The emergence of budget airlines and increasingly affordable international travel expands accessibility for a broader consumer base. The market's diversification, encompassing budget-friendly hostels to luxury hotels bookable via mobile apps, websites, and direct/third-party portals, caters to varied traveler needs. Competitive pricing, AI-driven personalized recommendations, and integrated loyalty programs further stimulate growth. However, challenges such as economic volatility impacting discretionary spending, cybersecurity risks, and reliance on technology infrastructure require strategic mitigation. The competitive landscape is dynamic, with major players like Booking Holdings, Expedia Group, and Airbnb, alongside regional and niche operators, actively competing for market share. While North America and Europe currently lead, the Asia-Pacific region presents substantial growth potential driven by rising middle-class incomes and expanding internet penetration.
Online Travel Industry Market Size (In Billion)
Market segmentation highlights critical trends. Mobile app bookings remain dominant, underscoring smartphone ubiquity. While third-party Online Travel Agencies (OTAs) retain a strong presence, direct bookings via captive portals are gaining traction, fostering stronger customer relationships and potentially improving profit margins for service providers. This evolving landscape demands continuous innovation in customer experience, personalized offerings, and effective marketing. Future success hinges on adapting to changing traveler preferences, embracing sustainable tourism, and leveraging advancements like AI and virtual reality to enhance the travel journey. Addressing data privacy and security concerns is paramount to maintaining consumer trust.
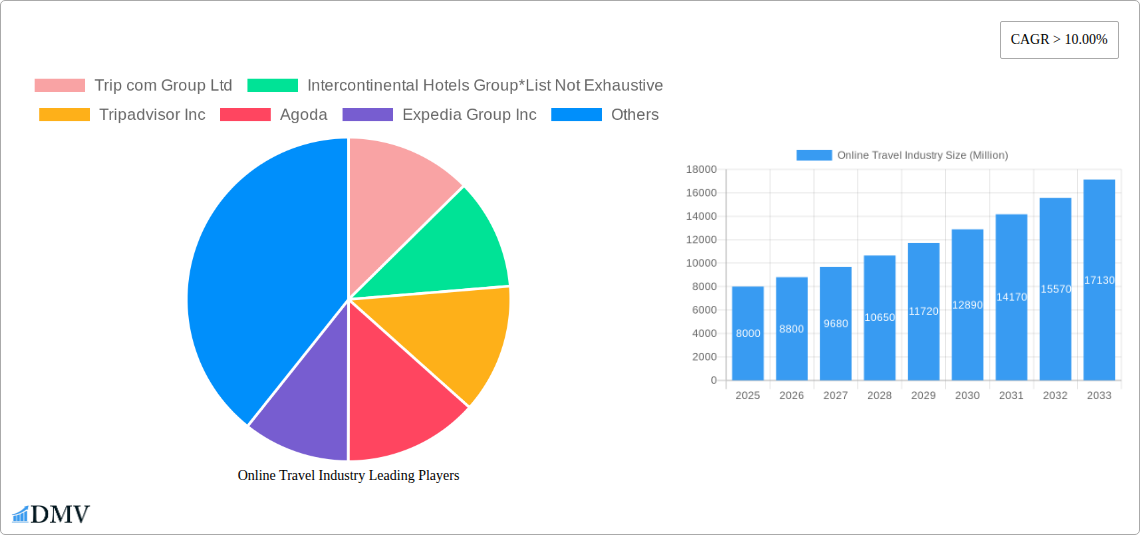
Online Travel Industry Company Market Share
Online Travel Industry: A Comprehensive Market Report (2019-2033)
This insightful report delivers a comprehensive analysis of the Online Travel Industry, projecting a market valuation exceeding $XX Million by 2033. We delve into market composition, technological advancements, key players, and future growth opportunities, providing stakeholders with actionable intelligence for strategic decision-making. The study period covers 2019-2033, with 2025 as the base and estimated year. The forecast period spans 2025-2033, and the historical period encompasses 2019-2024.
Online Travel Industry Market Composition & Trends
This section evaluates the competitive landscape, identifying key trends and growth drivers within the $XX Million online travel market. We analyze market concentration, revealing the market share distribution amongst major players like Booking Holdings Inc, Expedia Group Inc, and Trip.com Group Ltd. The report further examines the impact of innovation catalysts such as AI-powered personalization and the rise of mobile booking platforms. We also assess the regulatory environment, analyzing its influence on market dynamics and the emergence of substitute products, impacting the overall market size. Finally, the report details significant M&A activities, including deal values and their influence on market consolidation, with a focus on companies like Intercontinental Hotels Group and Airbnb Inc.
- Market Share Distribution: Booking Holdings Inc holds an estimated xx% market share in 2025, followed by Expedia Group Inc at xx% and Trip.com Group Ltd at xx%.
- M&A Activity: The report details xx major mergers and acquisitions in the period 2019-2024, with a combined value exceeding $XX Million.
- Innovation Catalysts: Artificial intelligence (AI), Virtual Reality (VR) and personalized travel recommendations are identified as key drivers of innovation.
- Regulatory Landscape: The report analyzes the impact of GDPR, CCPA, and other relevant regulations on data privacy and consumer protection.
- Substitute Products: The rise of alternative accommodation platforms (e.g., home rentals) poses a competitive threat to traditional hotels.
Online Travel Industry Industry Evolution
This section provides a detailed analysis of the online travel industry's evolution from 2019 to 2033, highlighting significant growth trajectories, technological advancements, and evolving consumer preferences. The industry witnessed a compound annual growth rate (CAGR) of xx% during the historical period (2019-2024), fueled by increased internet penetration and smartphone adoption. We forecast a CAGR of xx% from 2025 to 2033, driven by factors such as the increasing popularity of mobile applications for travel booking and the growing adoption of personalized travel experiences. We analyze the shift in consumer preferences towards sustainable and experiential travel, and how companies are adapting to these changing needs. The adoption of mobile applications for booking has reached xx% in 2025, showcasing significant user preference.
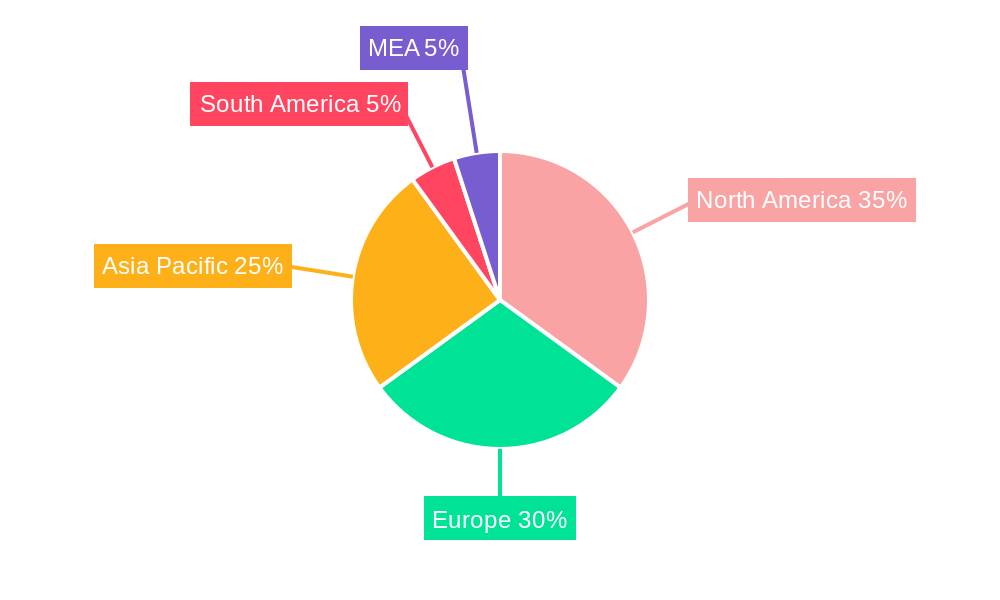
Leading Regions, Countries, or Segments in Online Travel Industry
This section identifies the leading regions, countries, and segments within the online travel industry. North America and Asia-Pacific are highlighted as dominant regions, fueled by robust economic growth and high internet penetration. Within these regions, specific countries, like the US and China, are identified as key markets. Regarding booking modes, mobile applications continue to experience substantial growth surpassing Website bookings, while third-party online travel agents (OTAs) dominate over direct bookings.
- Key Drivers for Mobile Application Dominance: Increased smartphone penetration, user-friendly interfaces, and the convenience of mobile booking.
- Key Drivers for Third-Party OTA Dominance: Wide selection of travel options, competitive pricing, and integrated booking functionalities.
- In-depth Analysis: The report analyzes factors such as investment trends, regulatory support, and consumer preferences that contribute to the dominance of these regions and booking platforms.
Online Travel Industry Product Innovations
The Online Travel Industry continues to witness significant product innovations, including AI-powered chatbots for customer service, personalized travel recommendations based on user data, and virtual reality tours of hotels and destinations. These innovations enhance the user experience, provide greater convenience, and foster customer loyalty. The implementation of blockchain technology for secure transactions is also gaining traction. The overall success of these innovations is measured through increased user engagement, higher conversion rates, and improved customer satisfaction.
Propelling Factors for Online Travel Industry Growth
Several factors drive the growth of the online travel industry. Technological advancements, including improved mobile apps and AI-powered personalization, are enhancing user experience and driving adoption. Favorable economic conditions and rising disposable incomes boost travel spending. Supportive government regulations and initiatives, such as visa simplification and tourism promotion campaigns, also contribute significantly.
Obstacles in the Online Travel Industry Market
Despite considerable growth potential, challenges remain. Stringent regulatory compliance regarding data privacy and security represents a significant hurdle. Supply chain disruptions, such as airline cancellations or hotel closures, impact operations and customer satisfaction. Intense competition, including price wars and the emergence of new players, further complicates the market dynamics, significantly impacting profitability margins. These factors contribute to an overall reduction in predicted market growth by an estimated xx%.
Future Opportunities in Online Travel Industry
The future of the online travel industry holds significant promise. Untapped markets in emerging economies represent a massive growth opportunity. New technologies like augmented reality (AR) and the metaverse offer innovative ways to engage customers and deliver immersive travel experiences. The growing demand for sustainable and responsible travel also presents an opportunity for businesses that prioritize eco-friendly practices.
Major Players in the Online Travel Industry Ecosystem
Key Developments in Online Travel Industry Industry
- 2022-03: Expedia Group Inc launches a new mobile application with enhanced AI-powered features.
- 2023-10: Booking Holdings Inc acquires a smaller competitor, significantly expanding its market share.
- 2024-06: Trip.com Group Ltd partners with a major airline to offer exclusive deals to its customers. (Further key developments will be detailed within the full report)
Strategic Online Travel Industry Market Forecast
The online travel industry is poised for continued growth, driven by technological advancements, evolving consumer preferences, and the expansion into new markets. The projected market valuation of over $XX Million by 2033 underscores the immense potential of this sector. Companies that adapt to changing consumer needs and leverage innovative technologies will be best positioned to capitalize on this growth. The increasing focus on sustainability and personalized experiences will shape future market trends.
Online Travel Industry Segmentation
-
1. Platform
- 1.1. Mobile Application
- 1.2. Website
-
2. Mode of Booking
- 2.1. Third party online portals
- 2.2. Direct / captive portals
Online Travel Industry Segmentation By Geography
-
1. North America
- 1.1. United States
- 1.2. Canada
- 1.3. Mexico
-
2. South America
- 2.1. Brazil
- 2.2. Argentina
- 2.3. Rest of South America
-
3. Europe
- 3.1. United Kingdom
- 3.2. Germany
- 3.3. France
- 3.4. Italy
- 3.5. Spain
- 3.6. Russia
- 3.7. Benelux
- 3.8. Nordics
- 3.9. Rest of Europe
-
4. Middle East & Africa
- 4.1. Turkey
- 4.2. Israel
- 4.3. GCC
- 4.4. North Africa
- 4.5. South Africa
- 4.6. Rest of Middle East & Africa
-
5. Asia Pacific
- 5.1. China
- 5.2. India
- 5.3. Japan
- 5.4. South Korea
- 5.5. ASEAN
- 5.6. Oceania
- 5.7. Rest of Asia Pacific
Online Travel Industry Regional Market Share
Geographic Coverage of Online Travel Industry
Online Travel Industry REPORT HIGHLIGHTS
| Aspects | Details |
|---|---|
| Study Period | 2020-2034 |
| Base Year | 2025 |
| Estimated Year | 2026 |
| Forecast Period | 2026-2034 |
| Historical Period | 2020-2025 |
| Growth Rate | CAGR of 9.75% from 2020-2034 |
| Segmentation |
|
Table of Contents
- 1. Introduction
- 1.1. Research Scope
- 1.2. Market Segmentation
- 1.3. Research Objective
- 1.4. Definitions and Assumptions
- 2. Executive Summary
- 2.1. Market Snapshot
- 3. Market Dynamics
- 3.1. Market Drivers
- 3.2. Market Restrains
- 3.3. Market Trends
- 3.4. Market Opportunities
- 4. Market Factor Analysis
- 4.1. Porters Five Forces
- 4.1.1. Bargaining Power of Suppliers
- 4.1.2. Bargaining Power of Buyers
- 4.1.3. Threat of New Entrants
- 4.1.4. Threat of Substitutes
- 4.1.5. Competitive Rivalry
- 4.2. PESTEL analysis
- 4.3. BCG Analysis
- 4.3.1. Stars (High Growth, High Market Share)
- 4.3.2. Cash Cows (Low Growth, High Market Share)
- 4.3.3. Question Mark (High Growth, Low Market Share)
- 4.3.4. Dogs (Low Growth, Low Market Share)
- 4.4. Ansoff Matrix Analysis
- 4.5. Supply Chain Analysis
- 4.6. Regulatory Landscape
- 4.7. Current Market Potential and Opportunity Assessment (TAM–SAM–SOM Framework)
- 4.8. DMV Analyst Note
- 4.1. Porters Five Forces
- 5. Market Analysis, Insights and Forecast 2021-2033
- 5.1. Market Analysis, Insights and Forecast - by Platform
- 5.1.1. Mobile Application
- 5.1.2. Website
- 5.2. Market Analysis, Insights and Forecast - by Mode of Booking
- 5.2.1. Third party online portals
- 5.2.2. Direct / captive portals
- 5.3. Market Analysis, Insights and Forecast - by Region
- 5.3.1. North America
- 5.3.2. South America
- 5.3.3. Europe
- 5.3.4. Middle East & Africa
- 5.3.5. Asia Pacific
- 5.1. Market Analysis, Insights and Forecast - by Platform
- 6. Global Online Travel Industry Analysis, Insights and Forecast, 2021-2033
- 6.1. Market Analysis, Insights and Forecast - by Platform
- 6.1.1. Mobile Application
- 6.1.2. Website
- 6.2. Market Analysis, Insights and Forecast - by Mode of Booking
- 6.2.1. Third party online portals
- 6.2.2. Direct / captive portals
- 6.1. Market Analysis, Insights and Forecast - by Platform
- 7. North America Online Travel Industry Analysis, Insights and Forecast, 2020-2032
- 7.1. Market Analysis, Insights and Forecast - by Platform
- 7.1.1. Mobile Application
- 7.1.2. Website
- 7.2. Market Analysis, Insights and Forecast - by Mode of Booking
- 7.2.1. Third party online portals
- 7.2.2. Direct / captive portals
- 7.1. Market Analysis, Insights and Forecast - by Platform
- 8. South America Online Travel Industry Analysis, Insights and Forecast, 2020-2032
- 8.1. Market Analysis, Insights and Forecast - by Platform
- 8.1.1. Mobile Application
- 8.1.2. Website
- 8.2. Market Analysis, Insights and Forecast - by Mode of Booking
- 8.2.1. Third party online portals
- 8.2.2. Direct / captive portals
- 8.1. Market Analysis, Insights and Forecast - by Platform
- 9. Europe Online Travel Industry Analysis, Insights and Forecast, 2020-2032
- 9.1. Market Analysis, Insights and Forecast - by Platform
- 9.1.1. Mobile Application
- 9.1.2. Website
- 9.2. Market Analysis, Insights and Forecast - by Mode of Booking
- 9.2.1. Third party online portals
- 9.2.2. Direct / captive portals
- 9.1. Market Analysis, Insights and Forecast - by Platform
- 10. Middle East & Africa Online Travel Industry Analysis, Insights and Forecast, 2020-2032
- 10.1. Market Analysis, Insights and Forecast - by Platform
- 10.1.1. Mobile Application
- 10.1.2. Website
- 10.2. Market Analysis, Insights and Forecast - by Mode of Booking
- 10.2.1. Third party online portals
- 10.2.2. Direct / captive portals
- 10.1. Market Analysis, Insights and Forecast - by Platform
- 11. Asia Pacific Online Travel Industry Analysis, Insights and Forecast, 2020-2032
- 11.1. Market Analysis, Insights and Forecast - by Platform
- 11.1.1. Mobile Application
- 11.1.2. Website
- 11.2. Market Analysis, Insights and Forecast - by Mode of Booking
- 11.2.1. Third party online portals
- 11.2.2. Direct / captive portals
- 11.1. Market Analysis, Insights and Forecast - by Platform
- 12. Competitive Analysis
- 12.1. Company Profiles
- 12.1.1 Trip com Group Ltd
- 12.1.1.1. Company Overview
- 12.1.1.2. Products
- 12.1.1.3. Company Financials
- 12.1.1.4. SWOT Analysis
- 12.1.2 Intercontinental Hotels Group*List Not Exhaustive
- 12.1.2.1. Company Overview
- 12.1.2.2. Products
- 12.1.2.3. Company Financials
- 12.1.2.4. SWOT Analysis
- 12.1.3 Tripadvisor Inc
- 12.1.3.1. Company Overview
- 12.1.3.2. Products
- 12.1.3.3. Company Financials
- 12.1.3.4. SWOT Analysis
- 12.1.4 Agoda
- 12.1.4.1. Company Overview
- 12.1.4.2. Products
- 12.1.4.3. Company Financials
- 12.1.4.4. SWOT Analysis
- 12.1.5 Expedia Group Inc
- 12.1.5.1. Company Overview
- 12.1.5.2. Products
- 12.1.5.3. Company Financials
- 12.1.5.4. SWOT Analysis
- 12.1.6 Traveloka Indonesia PT
- 12.1.6.1. Company Overview
- 12.1.6.2. Products
- 12.1.6.3. Company Financials
- 12.1.6.4. SWOT Analysis
- 12.1.7 HRS GmbH
- 12.1.7.1. Company Overview
- 12.1.7.2. Products
- 12.1.7.3. Company Financials
- 12.1.7.4. SWOT Analysis
- 12.1.8 Oravel Stays Pvt Ltd
- 12.1.8.1. Company Overview
- 12.1.8.2. Products
- 12.1.8.3. Company Financials
- 12.1.8.4. SWOT Analysis
- 12.1.9 Airbnb Inc
- 12.1.9.1. Company Overview
- 12.1.9.2. Products
- 12.1.9.3. Company Financials
- 12.1.9.4. SWOT Analysis
- 12.1.10 Hostelworld Group
- 12.1.10.1. Company Overview
- 12.1.10.2. Products
- 12.1.10.3. Company Financials
- 12.1.10.4. SWOT Analysis
- 12.1.11 Hotelbeds Group SL
- 12.1.11.1. Company Overview
- 12.1.11.2. Products
- 12.1.11.3. Company Financials
- 12.1.11.4. SWOT Analysis
- 12.1.12 Booking Holdings Inc
- 12.1.12.1. Company Overview
- 12.1.12.2. Products
- 12.1.12.3. Company Financials
- 12.1.12.4. SWOT Analysis
- 12.1.1 Trip com Group Ltd
- 12.2. Market Entropy
- 12.2.1 Company's Key Areas Served
- 12.2.2 Recent Developments
- 12.3. Company Market Share Analysis 2025
- 12.3.1 Top 5 Companies Market Share Analysis
- 12.3.2 Top 3 Companies Market Share Analysis
- 12.4. List of Potential Customers
- 13. Research Methodology
List of Figures
- Figure 1: Global Online Travel Industry Revenue Breakdown (billion, %) by Region 2025 & 2033
- Figure 2: North America Online Travel Industry Revenue (billion), by Platform 2025 & 2033
- Figure 3: North America Online Travel Industry Revenue Share (%), by Platform 2025 & 2033
- Figure 4: North America Online Travel Industry Revenue (billion), by Mode of Booking 2025 & 2033
- Figure 5: North America Online Travel Industry Revenue Share (%), by Mode of Booking 2025 & 2033
- Figure 6: North America Online Travel Industry Revenue (billion), by Country 2025 & 2033
- Figure 7: North America Online Travel Industry Revenue Share (%), by Country 2025 & 2033
- Figure 8: South America Online Travel Industry Revenue (billion), by Platform 2025 & 2033
- Figure 9: South America Online Travel Industry Revenue Share (%), by Platform 2025 & 2033
- Figure 10: South America Online Travel Industry Revenue (billion), by Mode of Booking 2025 & 2033
- Figure 11: South America Online Travel Industry Revenue Share (%), by Mode of Booking 2025 & 2033
- Figure 12: South America Online Travel Industry Revenue (billion), by Country 2025 & 2033
- Figure 13: South America Online Travel Industry Revenue Share (%), by Country 2025 & 2033
- Figure 14: Europe Online Travel Industry Revenue (billion), by Platform 2025 & 2033
- Figure 15: Europe Online Travel Industry Revenue Share (%), by Platform 2025 & 2033
- Figure 16: Europe Online Travel Industry Revenue (billion), by Mode of Booking 2025 & 2033
- Figure 17: Europe Online Travel Industry Revenue Share (%), by Mode of Booking 2025 & 2033
- Figure 18: Europe Online Travel Industry Revenue (billion), by Country 2025 & 2033
- Figure 19: Europe Online Travel Industry Revenue Share (%), by Country 2025 & 2033
- Figure 20: Middle East & Africa Online Travel Industry Revenue (billion), by Platform 2025 & 2033
- Figure 21: Middle East & Africa Online Travel Industry Revenue Share (%), by Platform 2025 & 2033
- Figure 22: Middle East & Africa Online Travel Industry Revenue (billion), by Mode of Booking 2025 & 2033
- Figure 23: Middle East & Africa Online Travel Industry Revenue Share (%), by Mode of Booking 2025 & 2033
- Figure 24: Middle East & Africa Online Travel Industry Revenue (billion), by Country 2025 & 2033
- Figure 25: Middle East & Africa Online Travel Industry Revenue Share (%), by Country 2025 & 2033
- Figure 26: Asia Pacific Online Travel Industry Revenue (billion), by Platform 2025 & 2033
- Figure 27: Asia Pacific Online Travel Industry Revenue Share (%), by Platform 2025 & 2033
- Figure 28: Asia Pacific Online Travel Industry Revenue (billion), by Mode of Booking 2025 & 2033
- Figure 29: Asia Pacific Online Travel Industry Revenue Share (%), by Mode of Booking 2025 & 2033
- Figure 30: Asia Pacific Online Travel Industry Revenue (billion), by Country 2025 & 2033
- Figure 31: Asia Pacific Online Travel Industry Revenue Share (%), by Country 2025 & 2033
List of Tables
- Table 1: Global Online Travel Industry Revenue billion Forecast, by Platform 2020 & 2033
- Table 2: Global Online Travel Industry Revenue billion Forecast, by Mode of Booking 2020 & 2033
- Table 3: Global Online Travel Industry Revenue billion Forecast, by Region 2020 & 2033
- Table 4: Global Online Travel Industry Revenue billion Forecast, by Platform 2020 & 2033
- Table 5: Global Online Travel Industry Revenue billion Forecast, by Mode of Booking 2020 & 2033
- Table 6: Global Online Travel Industry Revenue billion Forecast, by Country 2020 & 2033
- Table 7: United States Online Travel Industry Revenue (billion) Forecast, by Application 2020 & 2033
- Table 8: Canada Online Travel Industry Revenue (billion) Forecast, by Application 2020 & 2033
- Table 9: Mexico Online Travel Industry Revenue (billion) Forecast, by Application 2020 & 2033
- Table 10: Global Online Travel Industry Revenue billion Forecast, by Platform 2020 & 2033
- Table 11: Global Online Travel Industry Revenue billion Forecast, by Mode of Booking 2020 & 2033
- Table 12: Global Online Travel Industry Revenue billion Forecast, by Country 2020 & 2033
- Table 13: Brazil Online Travel Industry Revenue (billion) Forecast, by Application 2020 & 2033
- Table 14: Argentina Online Travel Industry Revenue (billion) Forecast, by Application 2020 & 2033
- Table 15: Rest of South America Online Travel Industry Revenue (billion) Forecast, by Application 2020 & 2033
- Table 16: Global Online Travel Industry Revenue billion Forecast, by Platform 2020 & 2033
- Table 17: Global Online Travel Industry Revenue billion Forecast, by Mode of Booking 2020 & 2033
- Table 18: Global Online Travel Industry Revenue billion Forecast, by Country 2020 & 2033
- Table 19: United Kingdom Online Travel Industry Revenue (billion) Forecast, by Application 2020 & 2033
- Table 20: Germany Online Travel Industry Revenue (billion) Forecast, by Application 2020 & 2033
- Table 21: France Online Travel Industry Revenue (billion) Forecast, by Application 2020 & 2033
- Table 22: Italy Online Travel Industry Revenue (billion) Forecast, by Application 2020 & 2033
- Table 23: Spain Online Travel Industry Revenue (billion) Forecast, by Application 2020 & 2033
- Table 24: Russia Online Travel Industry Revenue (billion) Forecast, by Application 2020 & 2033
- Table 25: Benelux Online Travel Industry Revenue (billion) Forecast, by Application 2020 & 2033
- Table 26: Nordics Online Travel Industry Revenue (billion) Forecast, by Application 2020 & 2033
- Table 27: Rest of Europe Online Travel Industry Revenue (billion) Forecast, by Application 2020 & 2033
- Table 28: Global Online Travel Industry Revenue billion Forecast, by Platform 2020 & 2033
- Table 29: Global Online Travel Industry Revenue billion Forecast, by Mode of Booking 2020 & 2033
- Table 30: Global Online Travel Industry Revenue billion Forecast, by Country 2020 & 2033
- Table 31: Turkey Online Travel Industry Revenue (billion) Forecast, by Application 2020 & 2033
- Table 32: Israel Online Travel Industry Revenue (billion) Forecast, by Application 2020 & 2033
- Table 33: GCC Online Travel Industry Revenue (billion) Forecast, by Application 2020 & 2033
- Table 34: North Africa Online Travel Industry Revenue (billion) Forecast, by Application 2020 & 2033
- Table 35: South Africa Online Travel Industry Revenue (billion) Forecast, by Application 2020 & 2033
- Table 36: Rest of Middle East & Africa Online Travel Industry Revenue (billion) Forecast, by Application 2020 & 2033
- Table 37: Global Online Travel Industry Revenue billion Forecast, by Platform 2020 & 2033
- Table 38: Global Online Travel Industry Revenue billion Forecast, by Mode of Booking 2020 & 2033
- Table 39: Global Online Travel Industry Revenue billion Forecast, by Country 2020 & 2033
- Table 40: China Online Travel Industry Revenue (billion) Forecast, by Application 2020 & 2033
- Table 41: India Online Travel Industry Revenue (billion) Forecast, by Application 2020 & 2033
- Table 42: Japan Online Travel Industry Revenue (billion) Forecast, by Application 2020 & 2033
- Table 43: South Korea Online Travel Industry Revenue (billion) Forecast, by Application 2020 & 2033
- Table 44: ASEAN Online Travel Industry Revenue (billion) Forecast, by Application 2020 & 2033
- Table 45: Oceania Online Travel Industry Revenue (billion) Forecast, by Application 2020 & 2033
- Table 46: Rest of Asia Pacific Online Travel Industry Revenue (billion) Forecast, by Application 2020 & 2033
Frequently Asked Questions
1. What is the projected Compound Annual Growth Rate (CAGR) of the Online Travel Industry?
The projected CAGR is approximately 9.75%.
2. Which companies are prominent players in the Online Travel Industry?
Key companies in the market include Trip com Group Ltd, Intercontinental Hotels Group*List Not Exhaustive, Tripadvisor Inc, Agoda, Expedia Group Inc, Traveloka Indonesia PT, HRS GmbH, Oravel Stays Pvt Ltd, Airbnb Inc, Hostelworld Group, Hotelbeds Group SL, Booking Holdings Inc.
3. What are the main segments of the Online Travel Industry?
The market segments include Platform, Mode of Booking.
4. Can you provide details about the market size?
The market size is estimated to be USD 622.6 billion as of 2022.
5. What are some drivers contributing to market growth?
Increase in Domestic Travel Driving the Market; Growing Tourist Footfall Driving the Market.
6. What are the notable trends driving market growth?
Increasing Internet Penetration has Huge Impact on the Market.
7. Are there any restraints impacting market growth?
Restrictions on Purchases of Number of Products; Customs Regulations and Taxation Policies.
8. Can you provide examples of recent developments in the market?
N/A
9. What pricing options are available for accessing the report?
Pricing options include single-user, multi-user, and enterprise licenses priced at USD 3800, USD 4500, and USD 5800 respectively.
10. Is the market size provided in terms of value or volume?
The market size is provided in terms of value, measured in billion.
11. Are there any specific market keywords associated with the report?
Yes, the market keyword associated with the report is "Online Travel Industry," which aids in identifying and referencing the specific market segment covered.
12. How do I determine which pricing option suits my needs best?
The pricing options vary based on user requirements and access needs. Individual users may opt for single-user licenses, while businesses requiring broader access may choose multi-user or enterprise licenses for cost-effective access to the report.
13. Are there any additional resources or data provided in the Online Travel Industry report?
While the report offers comprehensive insights, it's advisable to review the specific contents or supplementary materials provided to ascertain if additional resources or data are available.
14. How can I stay updated on further developments or reports in the Online Travel Industry?
To stay informed about further developments, trends, and reports in the Online Travel Industry, consider subscribing to industry newsletters, following relevant companies and organizations, or regularly checking reputable industry news sources and publications.
Methodology
Step 1 - Identification of Relevant Samples Size from Population Database


Step 2 - Approaches for Defining Global Market Size (Value, Volume* & Price*)

Note*: In applicable scenarios
Step 3 - Data Sources
Primary Research
- Web Analytics
- Survey Reports
- Research Institute
- Latest Research Reports
- Opinion Leaders
Secondary Research
- Annual Reports
- White Paper
- Latest Press Release
- Industry Association
- Paid Database
- Investor Presentations

Step 4 - Data Triangulation
Involves using different sources of information in order to increase the validity of a study
These sources are likely to be stakeholders in a program - participants, other researchers, program staff, other community members, and so on.
Then we put all data in single framework & apply various statistical tools to find out the dynamic on the market.
During the analysis stage, feedback from the stakeholder groups would be compared to determine areas of agreement as well as areas of divergence