

Key Insights
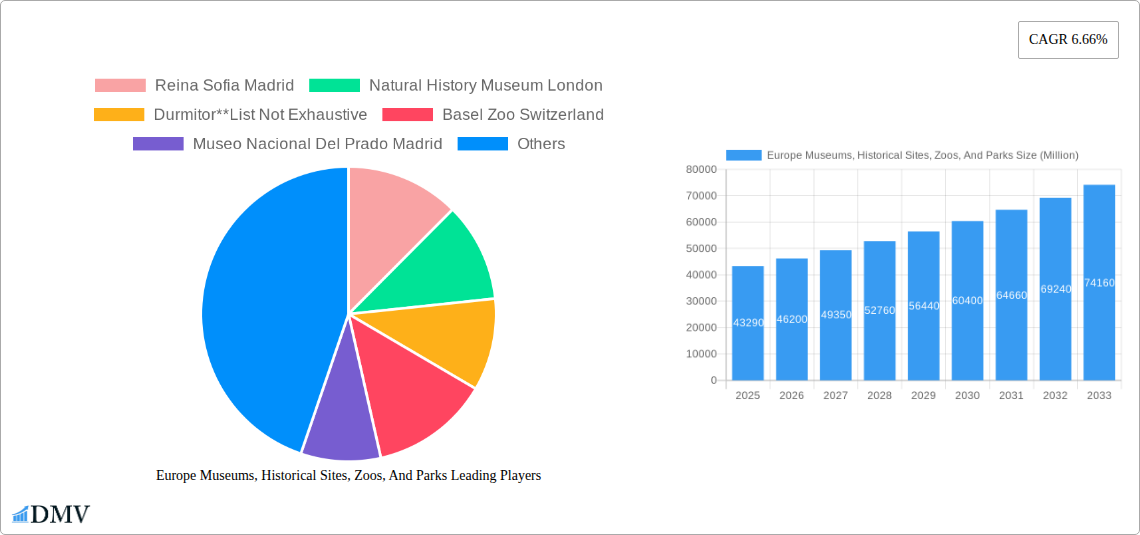
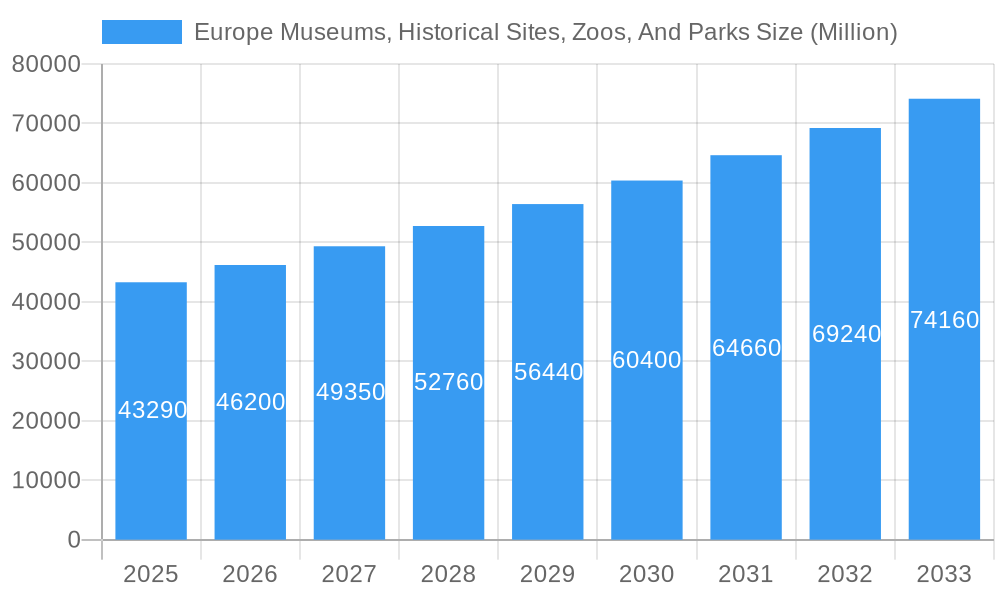
The European museums, historical sites, zoos, and parks market exhibits robust growth, projected at a Compound Annual Growth Rate (CAGR) of 6.66% from 2025 to 2033, reaching a market size of €43.29 billion in 2025. Several factors drive this expansion. Increased disposable incomes across Europe, coupled with a rising interest in cultural experiences and sustainable tourism, fuel demand for these attractions. Governments are increasingly investing in infrastructure improvements and marketing initiatives to boost tourism, further stimulating the market. The diversification of offerings, including immersive experiences, educational programs, and specialized tours, also contributes to growth. While potential restraints include seasonality, economic downturns, and competition from alternative leisure activities, the market's resilience and adaptability suggest continued expansion. The segment breakdown reveals a strong contribution from major players like the Louvre, British Museum, and various national parks, indicating a concentration of market share among established institutions. However, smaller, niche attractions are also experiencing growth, driven by unique offerings and targeted marketing strategies.
Europe Museums, Historical Sites, Zoos, And Parks Market Size (In Billion)
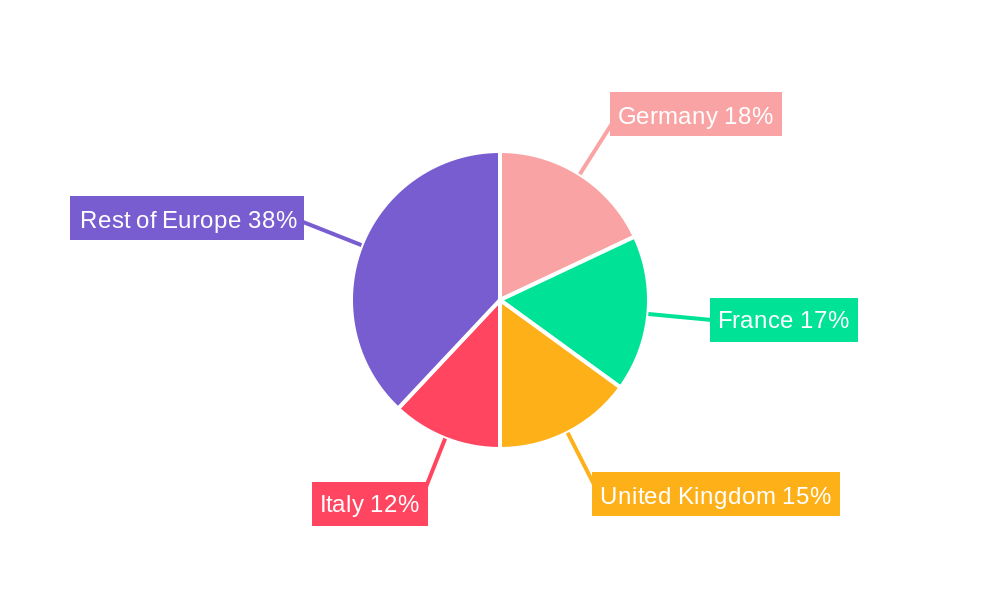
The market segmentation highlights significant variations across different types of attractions. Museums and historical sites tend to attract a higher-spending clientele, driving revenue from ticket sales and associated services. Zoos and botanical gardens, while attracting a broad demographic, also benefit from diverse revenue streams such as food and beverage sales and memberships. National parks, heavily reliant on tourism, exhibit sensitivity to seasonal fluctuations. Geographic variations are also apparent, with countries like France, Germany, the UK, and Italy dominating the market due to established tourism infrastructure, substantial historical significance, and high visitor numbers. The continued growth in the sector hinges on the ability of these institutions to adapt to changing tourist preferences, embracing digital technologies, and implementing effective sustainability initiatives. Further market penetration will depend on effective marketing campaigns, and strategic partnerships, particularly in promoting less well-known but equally valuable attractions across the wider European region.
Europe Museums, Historical Sites, Zoos, And Parks Company Market Share
Europe Museums, Historical Sites, Zoos, and Parks Market Report: 2019-2033
This comprehensive report provides an in-depth analysis of the European museums, historical sites, zoos, and parks market, offering valuable insights for stakeholders across the industry. With a study period spanning 2019-2033, a base year of 2025, and a forecast period of 2025-2033, this report delivers critical data and forecasts for informed decision-making. The market is projected to reach a value of €XX Million by 2033, demonstrating significant growth potential. This report analyzes key segments, leading players, and future opportunities within this dynamic sector.
Europe Museums, Historical Sites, Zoos, And Parks Market Composition & Trends
The European museums, historical sites, zoos, and parks market is characterized by a moderately fragmented landscape, with a few major players commanding significant market share, while numerous smaller institutions contribute to the overall revenue. Market share distribution is highly varied across countries and segment types, with museums in major European capitals holding prominent positions. Innovation is driven by technological advancements such as immersive experiences, augmented reality applications, and digital ticketing systems. Regulatory landscapes vary across European countries, impacting operational costs and visitor access. Substitute products include alternative leisure activities, impacting revenue streams. End-users comprise a diverse group ranging from individual tourists to educational groups, demanding a multifaceted experience that balances entertainment, education, and cultural preservation. M&A activity has been moderate in recent years, with deal values ranging from €XX Million to €XX Million. Recent examples include [Specific examples of M&A activity with deal values if available, otherwise indicate unavailable].
- Market Concentration: Moderately Fragmented
- Innovation Catalysts: Technological advancements, digitalization, immersive experiences.
- Regulatory Landscape: Varies significantly across countries.
- Substitute Products: Alternative leisure activities, online entertainment.
- End-User Profiles: Diverse, including tourists, educational groups, families, and local communities.
- M&A Activity: Moderate, with deal values ranging from €XX Million to €XX Million (or unavailable).
Europe Museums, Historical Sites, Zoos, And Parks Industry Evolution
The European museums, historical sites, zoos, and parks industry has experienced significant growth in recent years, driven by increasing tourism and a growing appreciation for cultural heritage and natural environments. Technological advancements such as virtual and augmented reality experiences have enhanced visitor engagement, creating immersive and educational experiences. Shifting consumer demands toward personalized and unique experiences have led to the development of specialized tours, interactive exhibits, and customized offerings. The industry also demonstrates sensitivity to sustainability concerns, with a growing adoption of eco-friendly practices across the sector. Growth rates vary by segment; Museums have shown consistent growth, averaging approximately X% annually between 2019 and 2024. Zoos and parks, while exhibiting similar trends, show varying growth based on location and specific offerings. The adoption rate of new technologies (e.g., VR/AR) is accelerating, with an estimated X% of major institutions utilizing such technologies by 2025.
Leading Regions, Countries, or Segments in Europe Museums, Historical Sites, Zoos, And Parks
By Type: Museums consistently hold the largest market share, driven by their cultural significance and global appeal. Historical sites, nature parks, and zoos and botanical gardens contribute significantly, each with unique market dynamics. Other similar institutions, such as aquariums and science centers, are demonstrating strong growth potential.
By Revenue Source: Ticket sales remain the primary revenue stream, but food and beverage sales, alongside merchandise and other revenue sources, play a crucial role in overall profitability. The relative proportion of revenue from each source varies significantly across different institutions, with some places placing a heavier emphasis on ancillary sales.
By Country: France, the United Kingdom, Germany, and Italy are leading markets, benefiting from high tourist numbers and a rich cultural heritage. The "Rest of Europe" segment shows significant growth potential, with many emerging tourist destinations and expanding infrastructure.
Key Drivers:
- High Tourist Footfall: Major European cities attract millions of international and domestic visitors.
- Government Funding and Support: Many institutions benefit from public funding, fostering expansion and preservation efforts.
- Strategic Investments: Private investments in renovations, expansion, and technological upgrades are driving growth.
- Cultural Significance: European cultural heritage holds significant global appeal, fueling interest in visiting museums and historical sites.
Europe Museums, Historical Sites, Zoos, And Parks Product Innovations
Recent innovations include the introduction of immersive and interactive exhibits using augmented reality and virtual reality technologies. Digital ticketing systems, personalized tours, and mobile applications enhance visitor experience and efficiency. Unique selling propositions include curated experiences, educational programs, and themed events catering to diverse interests and demographics. Technological advancements are focused on enhancing visitor engagement, improving operational efficiency, and promoting sustainability.
Propelling Factors for Europe Museums, Historical Sites, Zoos, And Parks Growth
The market is propelled by increasing tourism, governmental support for cultural preservation, and technological advancements enhancing visitor engagement. Economic growth in many European countries directly fuels spending on leisure activities, including visits to museums and parks. Favorable regulatory environments supporting tourism and cultural institutions also stimulate growth. Examples include initiatives promoting sustainable tourism and accessibility for all.
Obstacles in the Europe Museums, Historical Sites, Zoos, And Parks Market
Significant obstacles include seasonality, impacting visitor numbers and revenue streams. Supply chain disruptions can affect operational costs and maintenance. Competitive pressures from alternative leisure activities necessitate continuous innovation and diversification. Regulatory changes and varying levels of governmental support across different countries pose further challenges.
Future Opportunities in Europe Museums, Historical Sites, Zoos, And Parks
Future growth is expected to be driven by the expansion of immersive technologies, personalized experiences, and sustainable practices. Developing new markets through targeted marketing campaigns and strategic partnerships could unlock substantial potential. New revenue streams, such as corporate events and educational programs, could further diversify income sources.
Major Players in the Europe Museums, Historical Sites, Zoos, And Parks Ecosystem
- Reina Sofia Madrid
- Natural History Museum London
- Durmitor National Park (Website unavailable)
- Basel Zoo Switzerland
- Museo Nacional Del Prado Madrid
- State Tretyakov Gallery Moscow
- Centre Pompidou Paris
- Chester Zoo England
- Plitvice Lakes National Park (Website unavailable)
- State Hermitage St Petersburg
- British Museum London
- Pairi Daiza Zoo Southern Belgium
- Zoologischer Garten Berlin AG (Website unavailable)
- Schonbrunner Zoo Vienna
- Vatican Museums Vatican
- Louvre Paris
Key Developments in Europe Museums, Historical Sites, Zoos, And Parks Industry
September 2022: The Museum of Homelessness (MoH) announced plans to open its first location in London's Finsbury Park, focusing on community engagement and providing support to the homeless population. This represents a shift toward social inclusion and community-focused initiatives within the cultural sector.
March 2023: The opening of the Young V&A in Bethnal Green marks a significant development in children's museum offerings, showcasing a renewed focus on engaging younger audiences with interactive exhibits and creative learning experiences. This development contributes to the increasing diversity in museum offerings and a growing focus on interactive learning experiences.
Strategic Europe Museums, Historical Sites, Zoos, And Parks Market Forecast
The European museums, historical sites, zoos, and parks market is poised for continued growth, driven by sustained tourism, technological advancements, and increased government investment in cultural infrastructure. The market's expansion will be fueled by the growing adoption of immersive technologies, personalized visitor experiences, and a heightened focus on sustainability. New revenue streams and innovative partnerships will contribute to a positive market outlook over the forecast period. The market is anticipated to maintain a steady growth trajectory, expanding beyond its current €XX Million valuation (or predicted value).
Europe Museums, Historical Sites, Zoos, And Parks Segmentation
-
1. Type
- 1.1. Museums
- 1.2. Historical Sites
- 1.3. Zoos And Botanical Gardens
- 1.4. Nature Parks
- 1.5. Other Similar Institutions
-
2. Revenue Source
- 2.1. Tickets
- 2.2. Food And Beverages
- 2.3. Other Revenue Souces
Europe Museums, Historical Sites, Zoos, And Parks Segmentation By Geography
-
1. Europe
- 1.1. United Kingdom
- 1.2. Germany
- 1.3. France
- 1.4. Italy
- 1.5. Spain
- 1.6. Netherlands
- 1.7. Belgium
- 1.8. Sweden
- 1.9. Norway
- 1.10. Poland
- 1.11. Denmark
Europe Museums, Historical Sites, Zoos, And Parks Regional Market Share
Geographic Coverage of Europe Museums, Historical Sites, Zoos, And Parks
Europe Museums, Historical Sites, Zoos, And Parks REPORT HIGHLIGHTS
| Aspects | Details |
|---|---|
| Study Period | 2020-2034 |
| Base Year | 2025 |
| Estimated Year | 2026 |
| Forecast Period | 2026-2034 |
| Historical Period | 2020-2025 |
| Growth Rate | CAGR of 6.66% from 2020-2034 |
| Segmentation |
|
Table of Contents
- 1. Introduction
- 1.1. Research Scope
- 1.2. Market Segmentation
- 1.3. Research Objective
- 1.4. Definitions and Assumptions
- 2. Executive Summary
- 2.1. Market Snapshot
- 3. Market Dynamics
- 3.1. Market Drivers
- 3.2. Market Restrains
- 3.3. Market Trends
- 3.4. Market Opportunities
- 4. Market Factor Analysis
- 4.1. Porters Five Forces
- 4.1.1. Bargaining Power of Suppliers
- 4.1.2. Bargaining Power of Buyers
- 4.1.3. Threat of New Entrants
- 4.1.4. Threat of Substitutes
- 4.1.5. Competitive Rivalry
- 4.2. PESTEL analysis
- 4.3. BCG Analysis
- 4.3.1. Stars (High Growth, High Market Share)
- 4.3.2. Cash Cows (Low Growth, High Market Share)
- 4.3.3. Question Mark (High Growth, Low Market Share)
- 4.3.4. Dogs (Low Growth, Low Market Share)
- 4.4. Ansoff Matrix Analysis
- 4.5. Supply Chain Analysis
- 4.6. Regulatory Landscape
- 4.7. Current Market Potential and Opportunity Assessment (TAM–SAM–SOM Framework)
- 4.8. DMV Analyst Note
- 4.1. Porters Five Forces
- 5. Market Analysis, Insights and Forecast 2021-2033
- 5.1. Market Analysis, Insights and Forecast - by Type
- 5.1.1. Museums
- 5.1.2. Historical Sites
- 5.1.3. Zoos And Botanical Gardens
- 5.1.4. Nature Parks
- 5.1.5. Other Similar Institutions
- 5.2. Market Analysis, Insights and Forecast - by Revenue Source
- 5.2.1. Tickets
- 5.2.2. Food And Beverages
- 5.2.3. Other Revenue Souces
- 5.3. Market Analysis, Insights and Forecast - by Region
- 5.3.1. Europe
- 5.1. Market Analysis, Insights and Forecast - by Type
- 6. Europe Museums, Historical Sites, Zoos, And Parks Analysis, Insights and Forecast, 2021-2033
- 6.1. Market Analysis, Insights and Forecast - by Type
- 6.1.1. Museums
- 6.1.2. Historical Sites
- 6.1.3. Zoos And Botanical Gardens
- 6.1.4. Nature Parks
- 6.1.5. Other Similar Institutions
- 6.2. Market Analysis, Insights and Forecast - by Revenue Source
- 6.2.1. Tickets
- 6.2.2. Food And Beverages
- 6.2.3. Other Revenue Souces
- 6.1. Market Analysis, Insights and Forecast - by Type
- 7. Competitive Analysis
- 7.1. Company Profiles
- 7.1.1 Reina Sofia Madrid
- 7.1.1.1. Company Overview
- 7.1.1.2. Products
- 7.1.1.3. Company Financials
- 7.1.1.4. SWOT Analysis
- 7.1.2 Natural History Museum London
- 7.1.2.1. Company Overview
- 7.1.2.2. Products
- 7.1.2.3. Company Financials
- 7.1.2.4. SWOT Analysis
- 7.1.3 Durmitor**List Not Exhaustive
- 7.1.3.1. Company Overview
- 7.1.3.2. Products
- 7.1.3.3. Company Financials
- 7.1.3.4. SWOT Analysis
- 7.1.4 Basel Zoo Switzerland
- 7.1.4.1. Company Overview
- 7.1.4.2. Products
- 7.1.4.3. Company Financials
- 7.1.4.4. SWOT Analysis
- 7.1.5 Museo Nacional Del Prado Madrid
- 7.1.5.1. Company Overview
- 7.1.5.2. Products
- 7.1.5.3. Company Financials
- 7.1.5.4. SWOT Analysis
- 7.1.6 State Tretyakov Gallery Moscow
- 7.1.6.1. Company Overview
- 7.1.6.2. Products
- 7.1.6.3. Company Financials
- 7.1.6.4. SWOT Analysis
- 7.1.7 Centre Pompidou Paris
- 7.1.7.1. Company Overview
- 7.1.7.2. Products
- 7.1.7.3. Company Financials
- 7.1.7.4. SWOT Analysis
- 7.1.8 Chester Zoo England
- 7.1.8.1. Company Overview
- 7.1.8.2. Products
- 7.1.8.3. Company Financials
- 7.1.8.4. SWOT Analysis
- 7.1.9 Plitvice Lakes National Park
- 7.1.9.1. Company Overview
- 7.1.9.2. Products
- 7.1.9.3. Company Financials
- 7.1.9.4. SWOT Analysis
- 7.1.10 State Hermitage St Petersburg
- 7.1.10.1. Company Overview
- 7.1.10.2. Products
- 7.1.10.3. Company Financials
- 7.1.10.4. SWOT Analysis
- 7.1.11 British Museum London
- 7.1.11.1. Company Overview
- 7.1.11.2. Products
- 7.1.11.3. Company Financials
- 7.1.11.4. SWOT Analysis
- 7.1.12 Pairi Daiza Zoo Southern Belgium
- 7.1.12.1. Company Overview
- 7.1.12.2. Products
- 7.1.12.3. Company Financials
- 7.1.12.4. SWOT Analysis
- 7.1.13 Zoologischer Garten Berlin AG
- 7.1.13.1. Company Overview
- 7.1.13.2. Products
- 7.1.13.3. Company Financials
- 7.1.13.4. SWOT Analysis
- 7.1.14 Schonbrunner Zoo Vienna
- 7.1.14.1. Company Overview
- 7.1.14.2. Products
- 7.1.14.3. Company Financials
- 7.1.14.4. SWOT Analysis
- 7.1.15 Vatican Museums Vatican
- 7.1.15.1. Company Overview
- 7.1.15.2. Products
- 7.1.15.3. Company Financials
- 7.1.15.4. SWOT Analysis
- 7.1.16 Louvre Paris
- 7.1.16.1. Company Overview
- 7.1.16.2. Products
- 7.1.16.3. Company Financials
- 7.1.16.4. SWOT Analysis
- 7.1.1 Reina Sofia Madrid
- 7.2. Market Entropy
- 7.2.1 Company's Key Areas Served
- 7.2.2 Recent Developments
- 7.3. Company Market Share Analysis 2025
- 7.3.1 Top 5 Companies Market Share Analysis
- 7.3.2 Top 3 Companies Market Share Analysis
- 7.4. List of Potential Customers
- 8. Research Methodology
List of Figures
- Figure 1: Europe Museums, Historical Sites, Zoos, And Parks Revenue Breakdown (Million, %) by Product 2025 & 2033
- Figure 2: Europe Museums, Historical Sites, Zoos, And Parks Share (%) by Company 2025
List of Tables
- Table 1: Europe Museums, Historical Sites, Zoos, And Parks Revenue Million Forecast, by Type 2020 & 2033
- Table 2: Europe Museums, Historical Sites, Zoos, And Parks Revenue Million Forecast, by Revenue Source 2020 & 2033
- Table 3: Europe Museums, Historical Sites, Zoos, And Parks Revenue Million Forecast, by Region 2020 & 2033
- Table 4: Europe Museums, Historical Sites, Zoos, And Parks Revenue Million Forecast, by Type 2020 & 2033
- Table 5: Europe Museums, Historical Sites, Zoos, And Parks Revenue Million Forecast, by Revenue Source 2020 & 2033
- Table 6: Europe Museums, Historical Sites, Zoos, And Parks Revenue Million Forecast, by Country 2020 & 2033
- Table 7: United Kingdom Europe Museums, Historical Sites, Zoos, And Parks Revenue (Million) Forecast, by Application 2020 & 2033
- Table 8: Germany Europe Museums, Historical Sites, Zoos, And Parks Revenue (Million) Forecast, by Application 2020 & 2033
- Table 9: France Europe Museums, Historical Sites, Zoos, And Parks Revenue (Million) Forecast, by Application 2020 & 2033
- Table 10: Italy Europe Museums, Historical Sites, Zoos, And Parks Revenue (Million) Forecast, by Application 2020 & 2033
- Table 11: Spain Europe Museums, Historical Sites, Zoos, And Parks Revenue (Million) Forecast, by Application 2020 & 2033
- Table 12: Netherlands Europe Museums, Historical Sites, Zoos, And Parks Revenue (Million) Forecast, by Application 2020 & 2033
- Table 13: Belgium Europe Museums, Historical Sites, Zoos, And Parks Revenue (Million) Forecast, by Application 2020 & 2033
- Table 14: Sweden Europe Museums, Historical Sites, Zoos, And Parks Revenue (Million) Forecast, by Application 2020 & 2033
- Table 15: Norway Europe Museums, Historical Sites, Zoos, And Parks Revenue (Million) Forecast, by Application 2020 & 2033
- Table 16: Poland Europe Museums, Historical Sites, Zoos, And Parks Revenue (Million) Forecast, by Application 2020 & 2033
- Table 17: Denmark Europe Museums, Historical Sites, Zoos, And Parks Revenue (Million) Forecast, by Application 2020 & 2033
Frequently Asked Questions
1. What is the projected Compound Annual Growth Rate (CAGR) of the Europe Museums, Historical Sites, Zoos, And Parks?
The projected CAGR is approximately 6.66%.
2. Which companies are prominent players in the Europe Museums, Historical Sites, Zoos, And Parks?
Key companies in the market include Reina Sofia Madrid, Natural History Museum London, Durmitor**List Not Exhaustive, Basel Zoo Switzerland, Museo Nacional Del Prado Madrid, State Tretyakov Gallery Moscow, Centre Pompidou Paris, Chester Zoo England, Plitvice Lakes National Park, State Hermitage St Petersburg, British Museum London, Pairi Daiza Zoo Southern Belgium, Zoologischer Garten Berlin AG, Schonbrunner Zoo Vienna, Vatican Museums Vatican, Louvre Paris.
3. What are the main segments of the Europe Museums, Historical Sites, Zoos, And Parks?
The market segments include Type, Revenue Source.
4. Can you provide details about the market size?
The market size is estimated to be USD 43.29 Million as of 2022.
5. What are some drivers contributing to market growth?
Rise in the Number of Visitors to Museums is Driving the Market; Digitalization is Driving the Market.
6. What are the notable trends driving market growth?
Rise in the Number of Visitors to Museums is Driving the Market.
7. Are there any restraints impacting market growth?
Maintenance and Preservation Costs; Changing Visitor Preferences.
8. Can you provide examples of recent developments in the market?
March 2023: Young V&A will open its doors in Bethnal Green for the summer holidays after a project that has seen it be transformed from its former iteration as the V&A Museum of Childhood.
9. What pricing options are available for accessing the report?
Pricing options include single-user, multi-user, and enterprise licenses priced at USD 4750, USD 5250, and USD 8750 respectively.
10. Is the market size provided in terms of value or volume?
The market size is provided in terms of value, measured in Million.
11. Are there any specific market keywords associated with the report?
Yes, the market keyword associated with the report is "Europe Museums, Historical Sites, Zoos, And Parks," which aids in identifying and referencing the specific market segment covered.
12. How do I determine which pricing option suits my needs best?
The pricing options vary based on user requirements and access needs. Individual users may opt for single-user licenses, while businesses requiring broader access may choose multi-user or enterprise licenses for cost-effective access to the report.
13. Are there any additional resources or data provided in the Europe Museums, Historical Sites, Zoos, And Parks report?
While the report offers comprehensive insights, it's advisable to review the specific contents or supplementary materials provided to ascertain if additional resources or data are available.
14. How can I stay updated on further developments or reports in the Europe Museums, Historical Sites, Zoos, And Parks?
To stay informed about further developments, trends, and reports in the Europe Museums, Historical Sites, Zoos, And Parks, consider subscribing to industry newsletters, following relevant companies and organizations, or regularly checking reputable industry news sources and publications.
Methodology
Step 1 - Identification of Relevant Samples Size from Population Database


Step 2 - Approaches for Defining Global Market Size (Value, Volume* & Price*)

Note*: In applicable scenarios
Step 3 - Data Sources
Primary Research
- Web Analytics
- Survey Reports
- Research Institute
- Latest Research Reports
- Opinion Leaders
Secondary Research
- Annual Reports
- White Paper
- Latest Press Release
- Industry Association
- Paid Database
- Investor Presentations

Step 4 - Data Triangulation
Involves using different sources of information in order to increase the validity of a study
These sources are likely to be stakeholders in a program - participants, other researchers, program staff, other community members, and so on.
Then we put all data in single framework & apply various statistical tools to find out the dynamic on the market.
During the analysis stage, feedback from the stakeholder groups would be compared to determine areas of agreement as well as areas of divergence