

Key Insights
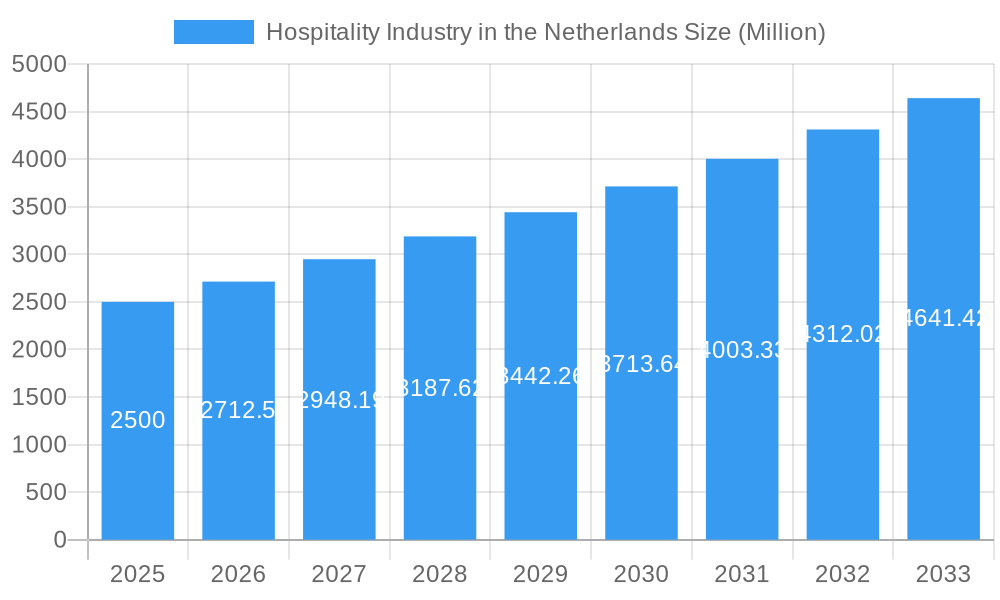
The Netherlands hospitality sector demonstrates a compelling growth trajectory, with a projected Compound Annual Growth Rate (CAGR) of 3.5%. The market, valued at $3.95 billion in the base year 2025, is anticipated to expand significantly through 2033. Key growth drivers include escalating tourism, increasing disposable incomes, and a rising demand for unique lodging options such as serviced apartments. The market is segmented by hotel type, differentiating between chain and independent establishments, and by service level, encompassing budget, mid-scale, and luxury offerings.
Hospitality Industry in the Netherlands Market Size (In Billion)
Chain hotels, particularly prominent international brands, currently hold a dominant market share, bolstered by robust loyalty programs. However, the presence of competitive independent hotels and a growing serviced apartment segment signifies a dynamic and diversifying market. The concentration of market share among a few key players suggests potential for strategic mergers and acquisitions. Concurrently, the expansion of budget and economy hotel options addresses the needs of price-conscious travelers. Future market growth may be influenced by economic volatility and seasonal tourism patterns, presenting both challenges and opportunities for investment and innovation within the Netherlands hospitality industry.
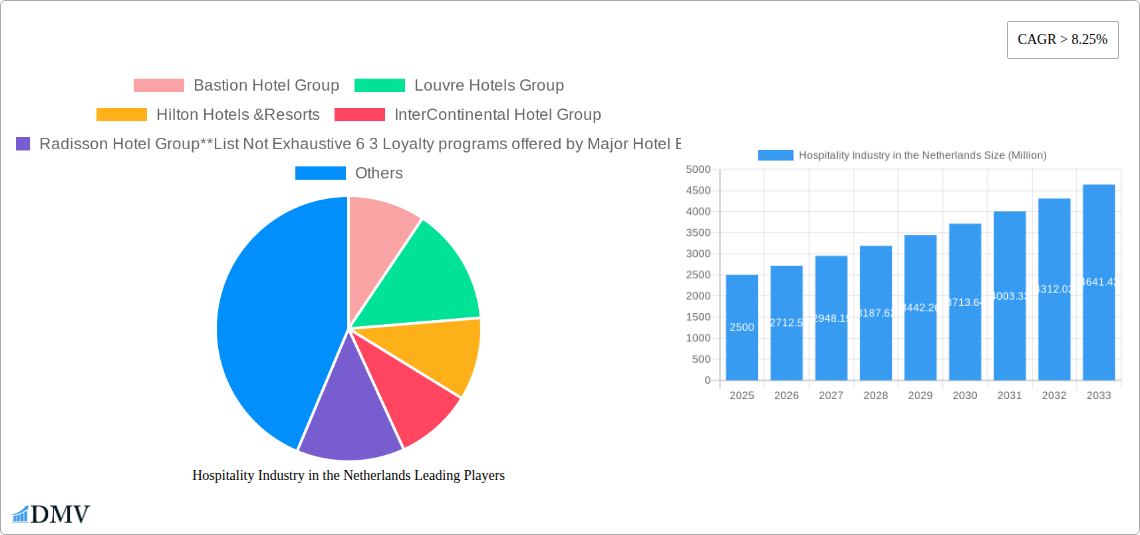
Hospitality Industry in the Netherlands Company Market Share
The competitive arena comprises a blend of international hospitality conglomerates and strong regional entities. Leading companies employ diverse strategies, ranging from premium luxury experiences to cost-effective budget solutions, to meet the varied demands of travelers. Sustained success in this market hinges on adaptability to evolving consumer preferences, the implementation of effective marketing campaigns, and the consistent maintenance of high operational standards. Future market expansion will be shaped by infrastructure development, government tourism policies, and global economic conditions. Strategic adoption of sustainability initiatives and advanced digital technologies will be paramount for securing a competitive advantage in the forthcoming years.
Hospitality Industry in the Netherlands: Market Composition & Trends (2019-2033)
This comprehensive report provides a deep dive into the dynamic Netherlands hospitality market, offering valuable insights for stakeholders from 2019 to 2033. The study period covers the historical period (2019-2024), the base year (2025), and a detailed forecast period (2025-2033), culminating in an estimated year (2025) projection. We analyze market concentration, innovation, regulations, substitute offerings, and key consumer segments, alongside significant M&A activity within the €XX Million market.
Market Concentration & Competitive Landscape:
- Market Share Distribution: The Netherlands hospitality market exhibits a moderately concentrated structure, with the top five players—AccorHotels, Marriott International, NH Hotels, Fletcher Hotel, and Hilton Hotels & Resorts—holding an estimated xx% combined market share in 2025. Smaller chains and independent hotels constitute the remaining market share.
- M&A Activity: The period 2019-2024 witnessed a total of xx M&A deals valued at approximately €XX Million, driven largely by consolidation within the budget and mid-scale segments. Future M&A activity is expected to increase due to pressure to scale and compete with larger multinational players.
- Competitive Intelligence: Analysis reveals strong competition based on pricing, location, branding, and service offerings. Key players are constantly innovating to enhance guest experiences and improve operational efficiency.
Company Profiles: Detailed company profiles are included for Bastion Hotel Group, Louvre Hotels Group, Hilton Hotels & Resorts, InterContinental Hotel Group, Radisson Hotel Group, Van der Valk, Marriott International, AccorHotels, NH Hotels, and Fletcher Hotel, encompassing market positioning, strategies, and financial performance.
Hospitality Industry in the Netherlands: Industry Evolution (2019-2033)
This section analyzes the transformative forces shaping the Netherlands hospitality landscape, from growth trajectories and technological integration to evolving consumer preferences. The market is anticipated to reach €XX Million by 2033, exhibiting a Compound Annual Growth Rate (CAGR) of xx% from 2025 to 2033.
The rise of online travel agents (OTAs), the increasing adoption of revenue management systems, and the growth of sharing economy platforms are key factors influencing market dynamics. Technological advancements, such as AI-powered chatbots for customer service and smart room technology are improving efficiency and customer satisfaction. A notable shift towards sustainable and experiential travel is observed, with consumers increasingly prioritizing eco-friendly options and authentic cultural experiences. This has led to a growth in demand for unique accommodations and curated experiences. Furthermore, the changing demographics of travelers also impact the market, with the growth of bleisure travel influencing hotel development and service offerings.
Leading Regions, Countries, or Segments in the Netherlands Hospitality Industry
The Netherlands hospitality market demonstrates regional variations in segment dominance.
- By Type: Chain hotels hold a significant majority of market share, owing to their established brands, economies of scale, and wider reach. Independent hotels maintain a smaller but resilient segment, often catering to niche markets and specializing in unique experiences.
- By Segment: The mid and upper-mid scale hotel segments currently dominate, driven by strong corporate travel and leisure demand. The budget and economy hotel segments are also experiencing growth due to increasing price-sensitivity among travelers. Luxury hotels cater to a smaller but high-spending market segment. The service apartment segment is experiencing steady growth, driven by longer-stay travelers and business professionals.
Key drivers include:
- Investment Trends: Significant investments in hotel construction and renovation are focused primarily in major cities like Amsterdam, Rotterdam, and The Hague, driven by both domestic and international investors.
- Regulatory Support: Government initiatives focused on sustainable tourism and infrastructure development play a significant role in shaping the market landscape.
Hospitality Industry in the Netherlands: Product Innovations
Recent innovations include the integration of smart technology for enhanced guest experiences (e.g., mobile check-in, room controls), personalized services leveraging data analytics, and the use of augmented and virtual reality to enrich guest experiences, as demonstrated by recent initiatives from InterContinental Hotel Group and Fletcher Hotels. These innovations focus on improving operational efficiency and enhancing guest satisfaction, ultimately driving higher customer loyalty and revenue generation.
Propelling Factors for Hospitality Industry in the Netherlands Growth
Several key factors drive growth in the Netherlands hospitality sector: Firstly, the country's robust tourism industry, attracting millions of international visitors annually, provides a strong foundation for the sector. Secondly, increasing disposable incomes among the Dutch population boost domestic travel and leisure spending. Thirdly, governmental support for tourism development and investments in infrastructure contribute significantly. Finally, ongoing technological advancements enhance efficiency and customer experiences.
Obstacles in the Netherlands Hospitality Industry Market
The Netherlands hospitality industry faces challenges, including seasonal fluctuations in demand, intense competition from established chains and emerging players, and potential supply chain disruptions affecting operational efficiency and pricing. Fluctuations in the Euro exchange rate also impact profitability by influencing international visitor spending.
Future Opportunities in the Netherlands Hospitality Industry
Emerging opportunities exist in areas such as sustainable tourism, personalized experiences tailored to specific traveler segments, the expansion of the service apartment sector, and continued technological advancements offering enhanced guest experiences through AI, VR, and AR. The growing popularity of bleisure travel also presents a significant avenue for market expansion.
Major Players in the Netherlands Hospitality Industry Ecosystem
- Bastion Hotel Group
- Louvre Hotels Group
- Hilton Hotels & Resorts
- InterContinental Hotel Group
- Radisson Hotel Group
- Van der Valk
- Marriott International
- AccorHotels
- NH Hotels
- Fletcher Hotel
Loyalty Programs: Major hotel brands offer a range of loyalty programs, including points-based systems, elite status tiers, and exclusive member benefits, aiming to enhance customer retention and drive repeat business.
Key Developments in the Netherlands Hospitality Industry
- May 2022: Fletcher Hotel launched an immersive virtual treasure hunt experience, enhancing guest engagement.
- January 2023: InterContinental Hotel Group implemented an Augmented Reality (AR) hotel art tour, enriching the guest experience through technology.
Strategic Netherlands Hospitality Industry Market Forecast
The Netherlands hospitality market is poised for continued growth, driven by a combination of factors, including sustained tourism growth, economic stability, and technological innovation, presenting significant opportunities for expansion, diversification and enhanced guest experiences. The market is projected to witness a healthy expansion in the forecast period, fueled by positive economic trends, increasing tourism, and the adoption of innovative technologies.
Hospitality Industry in the Netherlands Segmentation
-
1. Type
- 1.1. Chain Hotels
- 1.2. Independent Hotels
-
2. Segment
- 2.1. Service Apartments
- 2.2. Budget and Economy Hotels
- 2.3. Mid and Upper mid scale Hotels
- 2.4. Luxury Hotels
Hospitality Industry in the Netherlands Segmentation By Geography
-
1. North America
- 1.1. United States
- 1.2. Canada
- 1.3. Mexico
-
2. South America
- 2.1. Brazil
- 2.2. Argentina
- 2.3. Rest of South America
-
3. Europe
- 3.1. United Kingdom
- 3.2. Germany
- 3.3. France
- 3.4. Italy
- 3.5. Spain
- 3.6. Russia
- 3.7. Benelux
- 3.8. Nordics
- 3.9. Rest of Europe
-
4. Middle East & Africa
- 4.1. Turkey
- 4.2. Israel
- 4.3. GCC
- 4.4. North Africa
- 4.5. South Africa
- 4.6. Rest of Middle East & Africa
-
5. Asia Pacific
- 5.1. China
- 5.2. India
- 5.3. Japan
- 5.4. South Korea
- 5.5. ASEAN
- 5.6. Oceania
- 5.7. Rest of Asia Pacific
Hospitality Industry in the Netherlands Regional Market Share
Geographic Coverage of Hospitality Industry in the Netherlands
Hospitality Industry in the Netherlands REPORT HIGHLIGHTS
| Aspects | Details |
|---|---|
| Study Period | 2020-2034 |
| Base Year | 2025 |
| Estimated Year | 2026 |
| Forecast Period | 2026-2034 |
| Historical Period | 2020-2025 |
| Growth Rate | CAGR of 3.5% from 2020-2034 |
| Segmentation |
|
Table of Contents
- 1. Introduction
- 1.1. Research Scope
- 1.2. Market Segmentation
- 1.3. Research Objective
- 1.4. Definitions and Assumptions
- 2. Executive Summary
- 2.1. Market Snapshot
- 3. Market Dynamics
- 3.1. Market Drivers
- 3.2. Market Restrains
- 3.3. Market Trends
- 3.4. Market Opportunities
- 4. Market Factor Analysis
- 4.1. Porters Five Forces
- 4.1.1. Bargaining Power of Suppliers
- 4.1.2. Bargaining Power of Buyers
- 4.1.3. Threat of New Entrants
- 4.1.4. Threat of Substitutes
- 4.1.5. Competitive Rivalry
- 4.2. PESTEL analysis
- 4.3. BCG Analysis
- 4.3.1. Stars (High Growth, High Market Share)
- 4.3.2. Cash Cows (Low Growth, High Market Share)
- 4.3.3. Question Mark (High Growth, Low Market Share)
- 4.3.4. Dogs (Low Growth, Low Market Share)
- 4.4. Ansoff Matrix Analysis
- 4.5. Supply Chain Analysis
- 4.6. Regulatory Landscape
- 4.7. Current Market Potential and Opportunity Assessment (TAM–SAM–SOM Framework)
- 4.8. DMV Analyst Note
- 4.1. Porters Five Forces
- 5. Market Analysis, Insights and Forecast 2021-2033
- 5.1. Market Analysis, Insights and Forecast - by Type
- 5.1.1. Chain Hotels
- 5.1.2. Independent Hotels
- 5.2. Market Analysis, Insights and Forecast - by Segment
- 5.2.1. Service Apartments
- 5.2.2. Budget and Economy Hotels
- 5.2.3. Mid and Upper mid scale Hotels
- 5.2.4. Luxury Hotels
- 5.3. Market Analysis, Insights and Forecast - by Region
- 5.3.1. North America
- 5.3.2. South America
- 5.3.3. Europe
- 5.3.4. Middle East & Africa
- 5.3.5. Asia Pacific
- 5.1. Market Analysis, Insights and Forecast - by Type
- 6. Global Hospitality Industry in the Netherlands Analysis, Insights and Forecast, 2021-2033
- 6.1. Market Analysis, Insights and Forecast - by Type
- 6.1.1. Chain Hotels
- 6.1.2. Independent Hotels
- 6.2. Market Analysis, Insights and Forecast - by Segment
- 6.2.1. Service Apartments
- 6.2.2. Budget and Economy Hotels
- 6.2.3. Mid and Upper mid scale Hotels
- 6.2.4. Luxury Hotels
- 6.1. Market Analysis, Insights and Forecast - by Type
- 7. North America Hospitality Industry in the Netherlands Analysis, Insights and Forecast, 2020-2032
- 7.1. Market Analysis, Insights and Forecast - by Type
- 7.1.1. Chain Hotels
- 7.1.2. Independent Hotels
- 7.2. Market Analysis, Insights and Forecast - by Segment
- 7.2.1. Service Apartments
- 7.2.2. Budget and Economy Hotels
- 7.2.3. Mid and Upper mid scale Hotels
- 7.2.4. Luxury Hotels
- 7.1. Market Analysis, Insights and Forecast - by Type
- 8. South America Hospitality Industry in the Netherlands Analysis, Insights and Forecast, 2020-2032
- 8.1. Market Analysis, Insights and Forecast - by Type
- 8.1.1. Chain Hotels
- 8.1.2. Independent Hotels
- 8.2. Market Analysis, Insights and Forecast - by Segment
- 8.2.1. Service Apartments
- 8.2.2. Budget and Economy Hotels
- 8.2.3. Mid and Upper mid scale Hotels
- 8.2.4. Luxury Hotels
- 8.1. Market Analysis, Insights and Forecast - by Type
- 9. Europe Hospitality Industry in the Netherlands Analysis, Insights and Forecast, 2020-2032
- 9.1. Market Analysis, Insights and Forecast - by Type
- 9.1.1. Chain Hotels
- 9.1.2. Independent Hotels
- 9.2. Market Analysis, Insights and Forecast - by Segment
- 9.2.1. Service Apartments
- 9.2.2. Budget and Economy Hotels
- 9.2.3. Mid and Upper mid scale Hotels
- 9.2.4. Luxury Hotels
- 9.1. Market Analysis, Insights and Forecast - by Type
- 10. Middle East & Africa Hospitality Industry in the Netherlands Analysis, Insights and Forecast, 2020-2032
- 10.1. Market Analysis, Insights and Forecast - by Type
- 10.1.1. Chain Hotels
- 10.1.2. Independent Hotels
- 10.2. Market Analysis, Insights and Forecast - by Segment
- 10.2.1. Service Apartments
- 10.2.2. Budget and Economy Hotels
- 10.2.3. Mid and Upper mid scale Hotels
- 10.2.4. Luxury Hotels
- 10.1. Market Analysis, Insights and Forecast - by Type
- 11. Asia Pacific Hospitality Industry in the Netherlands Analysis, Insights and Forecast, 2020-2032
- 11.1. Market Analysis, Insights and Forecast - by Type
- 11.1.1. Chain Hotels
- 11.1.2. Independent Hotels
- 11.2. Market Analysis, Insights and Forecast - by Segment
- 11.2.1. Service Apartments
- 11.2.2. Budget and Economy Hotels
- 11.2.3. Mid and Upper mid scale Hotels
- 11.2.4. Luxury Hotels
- 11.1. Market Analysis, Insights and Forecast - by Type
- 12. Competitive Analysis
- 12.1. Company Profiles
- 12.1.1 Bastion Hotel Group
- 12.1.1.1. Company Overview
- 12.1.1.2. Products
- 12.1.1.3. Company Financials
- 12.1.1.4. SWOT Analysis
- 12.1.2 Louvre Hotels Group
- 12.1.2.1. Company Overview
- 12.1.2.2. Products
- 12.1.2.3. Company Financials
- 12.1.2.4. SWOT Analysis
- 12.1.3 Hilton Hotels &Resorts
- 12.1.3.1. Company Overview
- 12.1.3.2. Products
- 12.1.3.3. Company Financials
- 12.1.3.4. SWOT Analysis
- 12.1.4 InterContinental Hotel Group
- 12.1.4.1. Company Overview
- 12.1.4.2. Products
- 12.1.4.3. Company Financials
- 12.1.4.4. SWOT Analysis
- 12.1.5 Radisson Hotel Group**List Not Exhaustive 6 3 Loyalty programs offered by Major Hotel Brand
- 12.1.5.1. Company Overview
- 12.1.5.2. Products
- 12.1.5.3. Company Financials
- 12.1.5.4. SWOT Analysis
- 12.1.6 6 COMPETITVE INTELLIGENCE6 1 Market Concentration6 2 Company profiles
- 12.1.6.1. Company Overview
- 12.1.6.2. Products
- 12.1.6.3. Company Financials
- 12.1.6.4. SWOT Analysis
- 12.1.7 Van der Valk
- 12.1.7.1. Company Overview
- 12.1.7.2. Products
- 12.1.7.3. Company Financials
- 12.1.7.4. SWOT Analysis
- 12.1.8 Marriott International
- 12.1.8.1. Company Overview
- 12.1.8.2. Products
- 12.1.8.3. Company Financials
- 12.1.8.4. SWOT Analysis
- 12.1.9 AccorHotels
- 12.1.9.1. Company Overview
- 12.1.9.2. Products
- 12.1.9.3. Company Financials
- 12.1.9.4. SWOT Analysis
- 12.1.10 NH Hotels
- 12.1.10.1. Company Overview
- 12.1.10.2. Products
- 12.1.10.3. Company Financials
- 12.1.10.4. SWOT Analysis
- 12.1.11 Fletcher Hotel
- 12.1.11.1. Company Overview
- 12.1.11.2. Products
- 12.1.11.3. Company Financials
- 12.1.11.4. SWOT Analysis
- 12.1.1 Bastion Hotel Group
- 12.2. Market Entropy
- 12.2.1 Company's Key Areas Served
- 12.2.2 Recent Developments
- 12.3. Company Market Share Analysis 2025
- 12.3.1 Top 5 Companies Market Share Analysis
- 12.3.2 Top 3 Companies Market Share Analysis
- 12.4. List of Potential Customers
- 13. Research Methodology
List of Figures
- Figure 1: Global Hospitality Industry in the Netherlands Revenue Breakdown (billion, %) by Region 2025 & 2033
- Figure 2: North America Hospitality Industry in the Netherlands Revenue (billion), by Type 2025 & 2033
- Figure 3: North America Hospitality Industry in the Netherlands Revenue Share (%), by Type 2025 & 2033
- Figure 4: North America Hospitality Industry in the Netherlands Revenue (billion), by Segment 2025 & 2033
- Figure 5: North America Hospitality Industry in the Netherlands Revenue Share (%), by Segment 2025 & 2033
- Figure 6: North America Hospitality Industry in the Netherlands Revenue (billion), by Country 2025 & 2033
- Figure 7: North America Hospitality Industry in the Netherlands Revenue Share (%), by Country 2025 & 2033
- Figure 8: South America Hospitality Industry in the Netherlands Revenue (billion), by Type 2025 & 2033
- Figure 9: South America Hospitality Industry in the Netherlands Revenue Share (%), by Type 2025 & 2033
- Figure 10: South America Hospitality Industry in the Netherlands Revenue (billion), by Segment 2025 & 2033
- Figure 11: South America Hospitality Industry in the Netherlands Revenue Share (%), by Segment 2025 & 2033
- Figure 12: South America Hospitality Industry in the Netherlands Revenue (billion), by Country 2025 & 2033
- Figure 13: South America Hospitality Industry in the Netherlands Revenue Share (%), by Country 2025 & 2033
- Figure 14: Europe Hospitality Industry in the Netherlands Revenue (billion), by Type 2025 & 2033
- Figure 15: Europe Hospitality Industry in the Netherlands Revenue Share (%), by Type 2025 & 2033
- Figure 16: Europe Hospitality Industry in the Netherlands Revenue (billion), by Segment 2025 & 2033
- Figure 17: Europe Hospitality Industry in the Netherlands Revenue Share (%), by Segment 2025 & 2033
- Figure 18: Europe Hospitality Industry in the Netherlands Revenue (billion), by Country 2025 & 2033
- Figure 19: Europe Hospitality Industry in the Netherlands Revenue Share (%), by Country 2025 & 2033
- Figure 20: Middle East & Africa Hospitality Industry in the Netherlands Revenue (billion), by Type 2025 & 2033
- Figure 21: Middle East & Africa Hospitality Industry in the Netherlands Revenue Share (%), by Type 2025 & 2033
- Figure 22: Middle East & Africa Hospitality Industry in the Netherlands Revenue (billion), by Segment 2025 & 2033
- Figure 23: Middle East & Africa Hospitality Industry in the Netherlands Revenue Share (%), by Segment 2025 & 2033
- Figure 24: Middle East & Africa Hospitality Industry in the Netherlands Revenue (billion), by Country 2025 & 2033
- Figure 25: Middle East & Africa Hospitality Industry in the Netherlands Revenue Share (%), by Country 2025 & 2033
- Figure 26: Asia Pacific Hospitality Industry in the Netherlands Revenue (billion), by Type 2025 & 2033
- Figure 27: Asia Pacific Hospitality Industry in the Netherlands Revenue Share (%), by Type 2025 & 2033
- Figure 28: Asia Pacific Hospitality Industry in the Netherlands Revenue (billion), by Segment 2025 & 2033
- Figure 29: Asia Pacific Hospitality Industry in the Netherlands Revenue Share (%), by Segment 2025 & 2033
- Figure 30: Asia Pacific Hospitality Industry in the Netherlands Revenue (billion), by Country 2025 & 2033
- Figure 31: Asia Pacific Hospitality Industry in the Netherlands Revenue Share (%), by Country 2025 & 2033
List of Tables
- Table 1: Global Hospitality Industry in the Netherlands Revenue billion Forecast, by Type 2020 & 2033
- Table 2: Global Hospitality Industry in the Netherlands Revenue billion Forecast, by Segment 2020 & 2033
- Table 3: Global Hospitality Industry in the Netherlands Revenue billion Forecast, by Region 2020 & 2033
- Table 4: Global Hospitality Industry in the Netherlands Revenue billion Forecast, by Type 2020 & 2033
- Table 5: Global Hospitality Industry in the Netherlands Revenue billion Forecast, by Segment 2020 & 2033
- Table 6: Global Hospitality Industry in the Netherlands Revenue billion Forecast, by Country 2020 & 2033
- Table 7: United States Hospitality Industry in the Netherlands Revenue (billion) Forecast, by Application 2020 & 2033
- Table 8: Canada Hospitality Industry in the Netherlands Revenue (billion) Forecast, by Application 2020 & 2033
- Table 9: Mexico Hospitality Industry in the Netherlands Revenue (billion) Forecast, by Application 2020 & 2033
- Table 10: Global Hospitality Industry in the Netherlands Revenue billion Forecast, by Type 2020 & 2033
- Table 11: Global Hospitality Industry in the Netherlands Revenue billion Forecast, by Segment 2020 & 2033
- Table 12: Global Hospitality Industry in the Netherlands Revenue billion Forecast, by Country 2020 & 2033
- Table 13: Brazil Hospitality Industry in the Netherlands Revenue (billion) Forecast, by Application 2020 & 2033
- Table 14: Argentina Hospitality Industry in the Netherlands Revenue (billion) Forecast, by Application 2020 & 2033
- Table 15: Rest of South America Hospitality Industry in the Netherlands Revenue (billion) Forecast, by Application 2020 & 2033
- Table 16: Global Hospitality Industry in the Netherlands Revenue billion Forecast, by Type 2020 & 2033
- Table 17: Global Hospitality Industry in the Netherlands Revenue billion Forecast, by Segment 2020 & 2033
- Table 18: Global Hospitality Industry in the Netherlands Revenue billion Forecast, by Country 2020 & 2033
- Table 19: United Kingdom Hospitality Industry in the Netherlands Revenue (billion) Forecast, by Application 2020 & 2033
- Table 20: Germany Hospitality Industry in the Netherlands Revenue (billion) Forecast, by Application 2020 & 2033
- Table 21: France Hospitality Industry in the Netherlands Revenue (billion) Forecast, by Application 2020 & 2033
- Table 22: Italy Hospitality Industry in the Netherlands Revenue (billion) Forecast, by Application 2020 & 2033
- Table 23: Spain Hospitality Industry in the Netherlands Revenue (billion) Forecast, by Application 2020 & 2033
- Table 24: Russia Hospitality Industry in the Netherlands Revenue (billion) Forecast, by Application 2020 & 2033
- Table 25: Benelux Hospitality Industry in the Netherlands Revenue (billion) Forecast, by Application 2020 & 2033
- Table 26: Nordics Hospitality Industry in the Netherlands Revenue (billion) Forecast, by Application 2020 & 2033
- Table 27: Rest of Europe Hospitality Industry in the Netherlands Revenue (billion) Forecast, by Application 2020 & 2033
- Table 28: Global Hospitality Industry in the Netherlands Revenue billion Forecast, by Type 2020 & 2033
- Table 29: Global Hospitality Industry in the Netherlands Revenue billion Forecast, by Segment 2020 & 2033
- Table 30: Global Hospitality Industry in the Netherlands Revenue billion Forecast, by Country 2020 & 2033
- Table 31: Turkey Hospitality Industry in the Netherlands Revenue (billion) Forecast, by Application 2020 & 2033
- Table 32: Israel Hospitality Industry in the Netherlands Revenue (billion) Forecast, by Application 2020 & 2033
- Table 33: GCC Hospitality Industry in the Netherlands Revenue (billion) Forecast, by Application 2020 & 2033
- Table 34: North Africa Hospitality Industry in the Netherlands Revenue (billion) Forecast, by Application 2020 & 2033
- Table 35: South Africa Hospitality Industry in the Netherlands Revenue (billion) Forecast, by Application 2020 & 2033
- Table 36: Rest of Middle East & Africa Hospitality Industry in the Netherlands Revenue (billion) Forecast, by Application 2020 & 2033
- Table 37: Global Hospitality Industry in the Netherlands Revenue billion Forecast, by Type 2020 & 2033
- Table 38: Global Hospitality Industry in the Netherlands Revenue billion Forecast, by Segment 2020 & 2033
- Table 39: Global Hospitality Industry in the Netherlands Revenue billion Forecast, by Country 2020 & 2033
- Table 40: China Hospitality Industry in the Netherlands Revenue (billion) Forecast, by Application 2020 & 2033
- Table 41: India Hospitality Industry in the Netherlands Revenue (billion) Forecast, by Application 2020 & 2033
- Table 42: Japan Hospitality Industry in the Netherlands Revenue (billion) Forecast, by Application 2020 & 2033
- Table 43: South Korea Hospitality Industry in the Netherlands Revenue (billion) Forecast, by Application 2020 & 2033
- Table 44: ASEAN Hospitality Industry in the Netherlands Revenue (billion) Forecast, by Application 2020 & 2033
- Table 45: Oceania Hospitality Industry in the Netherlands Revenue (billion) Forecast, by Application 2020 & 2033
- Table 46: Rest of Asia Pacific Hospitality Industry in the Netherlands Revenue (billion) Forecast, by Application 2020 & 2033
Frequently Asked Questions
1. What is the projected Compound Annual Growth Rate (CAGR) of the Hospitality Industry in the Netherlands?
The projected CAGR is approximately 3.5%.
2. Which companies are prominent players in the Hospitality Industry in the Netherlands?
Key companies in the market include Bastion Hotel Group, Louvre Hotels Group, Hilton Hotels &Resorts, InterContinental Hotel Group, Radisson Hotel Group**List Not Exhaustive 6 3 Loyalty programs offered by Major Hotel Brand, 6 COMPETITVE INTELLIGENCE6 1 Market Concentration6 2 Company profiles, Van der Valk, Marriott International, AccorHotels, NH Hotels, Fletcher Hotel.
3. What are the main segments of the Hospitality Industry in the Netherlands?
The market segments include Type, Segment.
4. Can you provide details about the market size?
The market size is estimated to be USD 3.95 billion as of 2022.
5. What are some drivers contributing to market growth?
4.; Contribution to the Economy to Generate Income for the Nation.
6. What are the notable trends driving market growth?
Tier-II Cities Are Going to Attract More Investors Thus Driving The Industry.
7. Are there any restraints impacting market growth?
4.; Long Hours of Working Pattern.
8. Can you provide examples of recent developments in the market?
January 2023: InterContinental Hotel Group, Netherlands, took the initiative on an Augmented Reality (AR) hotel art tour where visitors can interact virtually with 10 artworks in the hotel's collection, supplemented by computer-generated graphics and sound as well as written or audio narratives about the piece and artist.
9. What pricing options are available for accessing the report?
Pricing options include single-user, multi-user, and enterprise licenses priced at USD 3800, USD 4500, and USD 5800 respectively.
10. Is the market size provided in terms of value or volume?
The market size is provided in terms of value, measured in billion.
11. Are there any specific market keywords associated with the report?
Yes, the market keyword associated with the report is "Hospitality Industry in the Netherlands," which aids in identifying and referencing the specific market segment covered.
12. How do I determine which pricing option suits my needs best?
The pricing options vary based on user requirements and access needs. Individual users may opt for single-user licenses, while businesses requiring broader access may choose multi-user or enterprise licenses for cost-effective access to the report.
13. Are there any additional resources or data provided in the Hospitality Industry in the Netherlands report?
While the report offers comprehensive insights, it's advisable to review the specific contents or supplementary materials provided to ascertain if additional resources or data are available.
14. How can I stay updated on further developments or reports in the Hospitality Industry in the Netherlands?
To stay informed about further developments, trends, and reports in the Hospitality Industry in the Netherlands, consider subscribing to industry newsletters, following relevant companies and organizations, or regularly checking reputable industry news sources and publications.
Methodology
Step 1 - Identification of Relevant Samples Size from Population Database


Step 2 - Approaches for Defining Global Market Size (Value, Volume* & Price*)

Note*: In applicable scenarios
Step 3 - Data Sources
Primary Research
- Web Analytics
- Survey Reports
- Research Institute
- Latest Research Reports
- Opinion Leaders
Secondary Research
- Annual Reports
- White Paper
- Latest Press Release
- Industry Association
- Paid Database
- Investor Presentations

Step 4 - Data Triangulation
Involves using different sources of information in order to increase the validity of a study
These sources are likely to be stakeholders in a program - participants, other researchers, program staff, other community members, and so on.
Then we put all data in single framework & apply various statistical tools to find out the dynamic on the market.
During the analysis stage, feedback from the stakeholder groups would be compared to determine areas of agreement as well as areas of divergence