

Key Insights
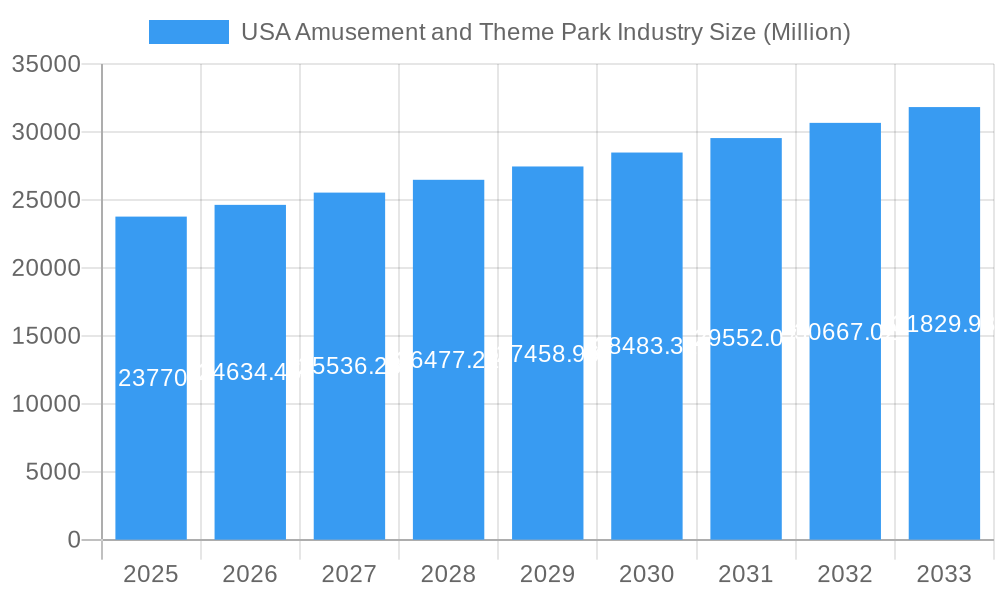
The US amusement and theme park industry, a significant contributor to the entertainment sector, is projected to experience robust growth throughout the forecast period (2025-2033). With a 2025 market size of $23.77 billion and a Compound Annual Growth Rate (CAGR) exceeding 3.5%, the industry demonstrates consistent expansion. This growth is fueled by several key drivers, including rising disposable incomes, increasing tourism, technological advancements leading to more immersive experiences (e.g., virtual reality integration), and the enduring appeal of family-friendly entertainment. Furthermore, the industry's segmentation, encompassing various ride types (land, water, and others) and revenue streams (tickets, food & beverage, merchandise, hospitality, and others), allows for diversified revenue generation and strategic expansion opportunities. The increasing popularity of themed experiences and immersive storytelling also contributes to the sector's appeal. However, challenges remain, such as economic fluctuations impacting consumer spending and the need for continuous innovation to maintain visitor interest and overcome competitive pressures.
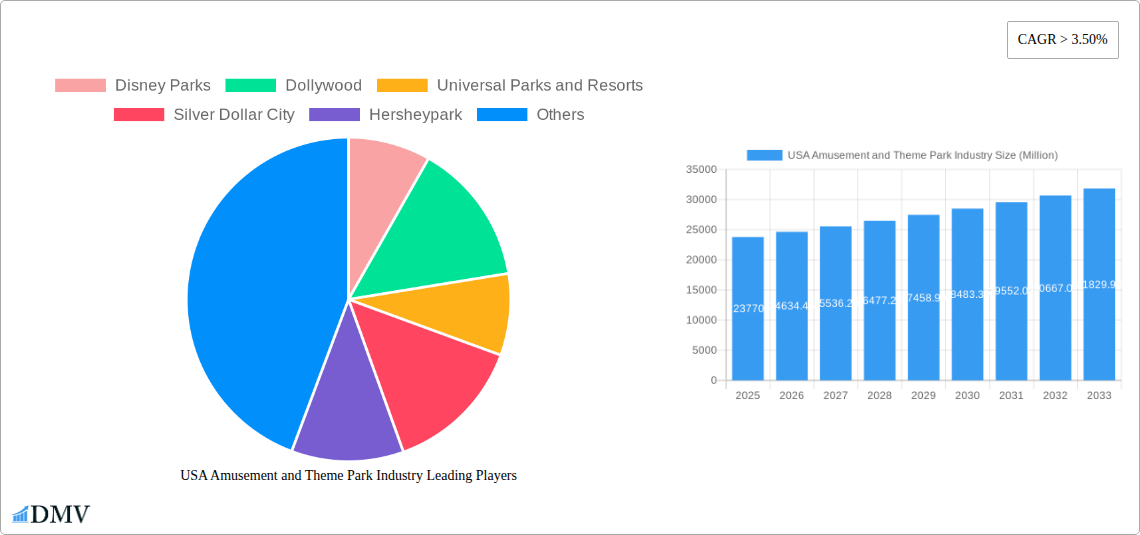
USA Amusement and Theme Park Industry Market Size (In Billion)
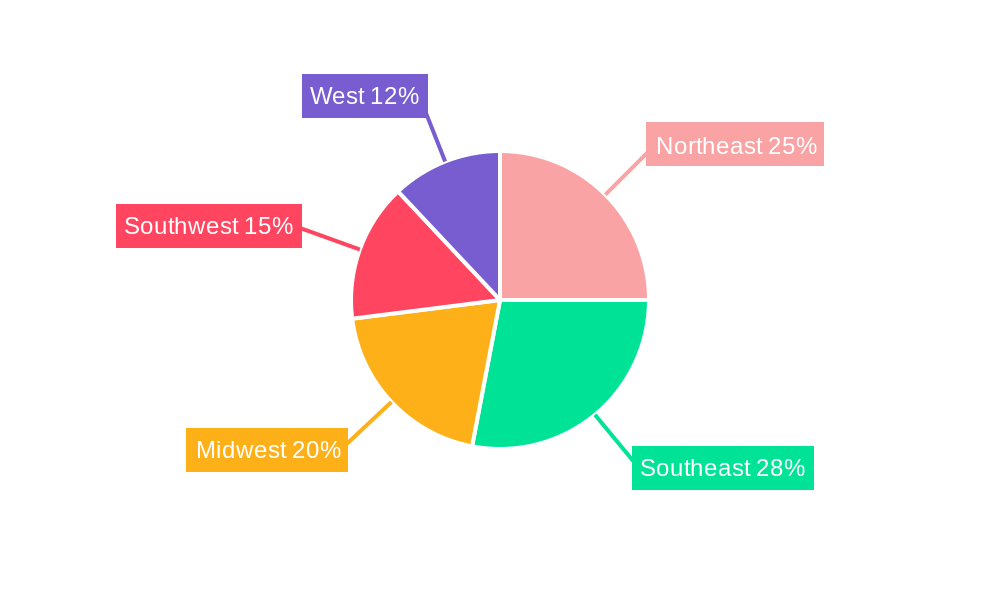
Regional variations within the US market are expected, with established tourism hotspots in the Northeast, Southeast, and West likely experiencing stronger growth compared to other regions. Key players like Disney Parks, Universal Parks & Resorts, Six Flags, and Cedar Fair are strategically investing in new attractions, park expansions, and technological upgrades to enhance the visitor experience and maintain market share. Competition is fierce, requiring companies to continually differentiate their offerings and adapt to evolving consumer preferences. The industry's success hinges on its capacity to provide unique, memorable experiences, leverage technological innovations, and effectively manage operational costs while delivering exceptional customer service. The ongoing trend towards incorporating sustainability initiatives into park operations is also gaining momentum, further shaping the industry's future trajectory.
USA Amusement and Theme Park Industry Company Market Share
USA Amusement and Theme Park Industry: Market Report 2019-2033
This comprehensive report provides a detailed analysis of the USA amusement and theme park industry, offering valuable insights for stakeholders seeking to navigate this dynamic market. Covering the period 2019-2033, with a base year of 2025 and a forecast period of 2025-2033, this report examines market trends, leading players, and future growth opportunities. The industry's value is projected to reach xx Million by 2033, showcasing significant potential for investors and businesses alike.
USA Amusement and Theme Park Industry Market Composition & Trends
This section delves into the competitive landscape of the US amusement and theme park industry, analyzing market concentration, innovation, regulation, and mergers & acquisitions (M&A) activity. The market is characterized by a mix of large multinational corporations and regional players, with key companies including Disney Parks, Universal Parks & Resorts, Six Flags Inc., Cedar Fair Entertainment Company, and SeaWorld Parks & Entertainment holding significant market share. However, the industry also features numerous smaller, specialized parks, contributing to a diverse competitive landscape.
- Market Share Distribution (2024): Disney Parks holds an estimated xx% market share, followed by Universal Parks & Resorts at xx%, Six Flags Inc. at xx%, and others. These figures are subject to fluctuation depending on annual performance.
- Innovation Catalysts: Technological advancements like virtual reality (VR) and augmented reality (AR) integration, personalized experiences, and improved ride technology are driving innovation.
- Regulatory Landscape: Safety regulations, accessibility standards, and environmental concerns significantly influence park operations and development. Variations in state and local regulations add complexity.
- Substitute Products: Other forms of entertainment, such as video games, home entertainment systems, and online experiences, represent substitute products, placing pressure on park attendance.
- End-User Profiles: The industry caters to a broad range of demographics, from families with children to young adults and tourists, demanding diverse offerings to appeal to these various segments.
- M&A Activity: Recent acquisitions, such as Crescent Real Estate LLC's acquisition of the Element Orlando Universal Blvd. hotel in September 2023, highlight the ongoing consolidation within the industry. The total value of M&A deals in the historical period (2019-2024) is estimated at xx Million.
USA Amusement and Theme Park Industry Industry Evolution
The US amusement and theme park industry has experienced significant evolution throughout the historical period (2019-2024). The industry’s growth trajectory has been influenced by several factors: changing consumer preferences (e.g., demand for immersive experiences), technological advancements (e.g., integration of AR/VR), and economic conditions (e.g., consumer spending patterns). Post-pandemic recovery saw a surge in attendance, though inflation and economic uncertainty could impact future growth. Technological advancements, particularly in ride technology and interactive experiences, continue to redefine the visitor experience, driving both customer satisfaction and operational efficiency. This includes the incorporation of cutting-edge technologies like AI, mobile apps, and digital ticketing systems. The shift towards personalized experiences, catering to individual preferences through targeted marketing and customized offerings, is also a key trend. The growth rate from 2019 to 2024 averaged approximately xx%, with expectations for a more moderate rate in the forecast period. Adoption of new technologies is expected to be high, driven by competition and consumer demand for enhanced experiences.
Leading Regions, Countries, or Segments in USA Amusement and Theme Park Industry
Florida and California consistently rank as leading regions due to major players like Disney World and Universal Studios, attracting massive tourist numbers and generating substantial revenue. Within the segment breakdown:
By Type: Land rides maintain the largest revenue share, due to their long-standing popularity and the breadth of themes and experiences offered. Water rides, whilst significant, represent a smaller portion. "Other types" encompasses niche attractions and experiences like shows and live entertainment, whose share is steadily growing.
By Source of Revenue: Ticket sales remain the primary revenue source, followed by food and beverage sales, and merchandise. Hospitality (hotels and accommodations) is a growing segment, particularly for major parks. The revenue breakdown is approximately: Tickets (xx%), Food & Beverages (xx%), Merchandise (xx%), Hospitality (xx%), Other (xx%).
Key Drivers (Florida): High tourist influx, presence of major players, favorable climate, significant investments in new attractions and infrastructure, and strong state tourism promotion.
Key Drivers (California): Similar to Florida, strong tourism, major players, but with a focus on a different demographic of visitors.
The dominance of Florida and California is attributed to their established infrastructure, marketing power, and large-scale investment in the industry.
USA Amusement and Theme Park Industry Product Innovations
Recent innovations focus on enhanced guest experiences through immersive technologies. VR and AR integration within rides and attractions creates more interactive and engaging experiences. Personalized mobile applications provide customized itineraries, wait-time information, and mobile ordering options. Investment in sophisticated queue management systems minimizes wait times, while data analytics helps optimize resource allocation and enhance operational efficiency. The introduction of new themed areas based on popular intellectual properties also drives innovation. These innovations aim to create unique selling propositions and establish competitive advantages.
Propelling Factors for USA Amusement and Theme Park Industry Growth
Technological advancements in ride technology, virtual and augmented reality, and data analytics enhance visitor experiences, driving demand. Favorable economic conditions, particularly increases in disposable income, increase spending on leisure activities. Government support for tourism and infrastructure development creates a positive environment for expansion. Strategic partnerships and collaborations foster innovation and market penetration. The continuing popularity of themed experiences drives increased attendance and revenue.
Obstacles in the USA Amusement and Theme Park Industry Market
Significant barriers include volatile economic conditions and increasing operating costs, especially energy costs. Supply chain disruptions can impact the timely development and maintenance of attractions. Intense competition requires continuous innovation and investment to maintain market share. Stringent safety and environmental regulations necessitate considerable expenditure to meet compliance requirements. These factors, if not managed effectively, can negatively impact profitability and growth.
Future Opportunities in USA Amusement and Theme Park Industry
Expansion into new markets and demographics (e.g., targeting senior citizens or specific niche interest groups) presents significant opportunities. Integration of emerging technologies, like AI-powered personalized experiences and blockchain-based ticketing systems, increases efficiency and enhances the visitor experience. Focus on sustainable practices, minimizing environmental impact, appeals to environmentally conscious consumers. Development of unique and immersive themed areas, incorporating popular culture franchises and innovative storytelling, increases engagement.
Major Players in the USA Amusement and Theme Park Industry Ecosystem
- Disney Parks
- Dollywood
- Universal Parks and Resorts
- Silver Dollar City
- Hersheypark
- Six Flags Inc
- Busch Garden
- The Island in Pigeon Forge
- Cedar Fair Entertainment Company
- Magic Kingdom Park
- Dells Waterpark
- Seaworld Parks and Entertainment
Key Developments in USA Amusement and Theme Park Industry Industry
- July 2023: Asacha Media Group acquired a majority share in Arrow International Media, the producer of Disney's Animal Kingdom, impacting production and potentially future park development.
- September 2023: Crescent Real Estate LLC's acquisition of the Element Orlando Universal Blvd. hotel expands hospitality offerings near Icon Park, boosting tourism and park attendance.
Strategic USA Amusement and Theme Park Industry Market Forecast
The US amusement and theme park industry is poised for continued growth, driven by technological advancements, evolving consumer preferences, and strategic investments. The forecast period (2025-2033) anticipates strong growth, although economic factors may influence the rate of expansion. New technologies will play a vital role in shaping future visitor experiences, enhancing operational efficiency, and driving profitability. The focus on sustainable and immersive experiences will continue to shape market trends.
USA Amusement and Theme Park Industry Segmentation
-
1. Type
- 1.1. Land Rides
- 1.2. Water Rides
- 1.3. Other Types
-
2. Source of Revenue
- 2.1. Tickets
- 2.2. Foods & Beverages
- 2.3. Merchandise
- 2.4. Hospitality
- 2.5. Other Source of Revenues
USA Amusement and Theme Park Industry Segmentation By Geography
-
1. North America
- 1.1. United States
- 1.2. Canada
- 1.3. Mexico
-
2. South America
- 2.1. Brazil
- 2.2. Argentina
- 2.3. Rest of South America
-
3. Europe
- 3.1. United Kingdom
- 3.2. Germany
- 3.3. France
- 3.4. Italy
- 3.5. Spain
- 3.6. Russia
- 3.7. Benelux
- 3.8. Nordics
- 3.9. Rest of Europe
-
4. Middle East & Africa
- 4.1. Turkey
- 4.2. Israel
- 4.3. GCC
- 4.4. North Africa
- 4.5. South Africa
- 4.6. Rest of Middle East & Africa
-
5. Asia Pacific
- 5.1. China
- 5.2. India
- 5.3. Japan
- 5.4. South Korea
- 5.5. ASEAN
- 5.6. Oceania
- 5.7. Rest of Asia Pacific
USA Amusement and Theme Park Industry Regional Market Share
Geographic Coverage of USA Amusement and Theme Park Industry
USA Amusement and Theme Park Industry REPORT HIGHLIGHTS
| Aspects | Details |
|---|---|
| Study Period | 2020-2034 |
| Base Year | 2025 |
| Estimated Year | 2026 |
| Forecast Period | 2026-2034 |
| Historical Period | 2020-2025 |
| Growth Rate | CAGR of > 3.50% from 2020-2034 |
| Segmentation |
|
Table of Contents
- 1. Introduction
- 1.1. Research Scope
- 1.2. Market Segmentation
- 1.3. Research Objective
- 1.4. Definitions and Assumptions
- 2. Executive Summary
- 2.1. Market Snapshot
- 3. Market Dynamics
- 3.1. Market Drivers
- 3.2. Market Restrains
- 3.3. Market Trends
- 3.4. Market Opportunities
- 4. Market Factor Analysis
- 4.1. Porters Five Forces
- 4.1.1. Bargaining Power of Suppliers
- 4.1.2. Bargaining Power of Buyers
- 4.1.3. Threat of New Entrants
- 4.1.4. Threat of Substitutes
- 4.1.5. Competitive Rivalry
- 4.2. PESTEL analysis
- 4.3. BCG Analysis
- 4.3.1. Stars (High Growth, High Market Share)
- 4.3.2. Cash Cows (Low Growth, High Market Share)
- 4.3.3. Question Mark (High Growth, Low Market Share)
- 4.3.4. Dogs (Low Growth, Low Market Share)
- 4.4. Ansoff Matrix Analysis
- 4.5. Supply Chain Analysis
- 4.6. Regulatory Landscape
- 4.7. Current Market Potential and Opportunity Assessment (TAM–SAM–SOM Framework)
- 4.8. DMV Analyst Note
- 4.1. Porters Five Forces
- 5. Market Analysis, Insights and Forecast 2021-2033
- 5.1. Market Analysis, Insights and Forecast - by Type
- 5.1.1. Land Rides
- 5.1.2. Water Rides
- 5.1.3. Other Types
- 5.2. Market Analysis, Insights and Forecast - by Source of Revenue
- 5.2.1. Tickets
- 5.2.2. Foods & Beverages
- 5.2.3. Merchandise
- 5.2.4. Hospitality
- 5.2.5. Other Source of Revenues
- 5.3. Market Analysis, Insights and Forecast - by Region
- 5.3.1. North America
- 5.3.2. South America
- 5.3.3. Europe
- 5.3.4. Middle East & Africa
- 5.3.5. Asia Pacific
- 5.1. Market Analysis, Insights and Forecast - by Type
- 6. Global USA Amusement and Theme Park Industry Analysis, Insights and Forecast, 2021-2033
- 6.1. Market Analysis, Insights and Forecast - by Type
- 6.1.1. Land Rides
- 6.1.2. Water Rides
- 6.1.3. Other Types
- 6.2. Market Analysis, Insights and Forecast - by Source of Revenue
- 6.2.1. Tickets
- 6.2.2. Foods & Beverages
- 6.2.3. Merchandise
- 6.2.4. Hospitality
- 6.2.5. Other Source of Revenues
- 6.1. Market Analysis, Insights and Forecast - by Type
- 7. North America USA Amusement and Theme Park Industry Analysis, Insights and Forecast, 2020-2032
- 7.1. Market Analysis, Insights and Forecast - by Type
- 7.1.1. Land Rides
- 7.1.2. Water Rides
- 7.1.3. Other Types
- 7.2. Market Analysis, Insights and Forecast - by Source of Revenue
- 7.2.1. Tickets
- 7.2.2. Foods & Beverages
- 7.2.3. Merchandise
- 7.2.4. Hospitality
- 7.2.5. Other Source of Revenues
- 7.1. Market Analysis, Insights and Forecast - by Type
- 8. South America USA Amusement and Theme Park Industry Analysis, Insights and Forecast, 2020-2032
- 8.1. Market Analysis, Insights and Forecast - by Type
- 8.1.1. Land Rides
- 8.1.2. Water Rides
- 8.1.3. Other Types
- 8.2. Market Analysis, Insights and Forecast - by Source of Revenue
- 8.2.1. Tickets
- 8.2.2. Foods & Beverages
- 8.2.3. Merchandise
- 8.2.4. Hospitality
- 8.2.5. Other Source of Revenues
- 8.1. Market Analysis, Insights and Forecast - by Type
- 9. Europe USA Amusement and Theme Park Industry Analysis, Insights and Forecast, 2020-2032
- 9.1. Market Analysis, Insights and Forecast - by Type
- 9.1.1. Land Rides
- 9.1.2. Water Rides
- 9.1.3. Other Types
- 9.2. Market Analysis, Insights and Forecast - by Source of Revenue
- 9.2.1. Tickets
- 9.2.2. Foods & Beverages
- 9.2.3. Merchandise
- 9.2.4. Hospitality
- 9.2.5. Other Source of Revenues
- 9.1. Market Analysis, Insights and Forecast - by Type
- 10. Middle East & Africa USA Amusement and Theme Park Industry Analysis, Insights and Forecast, 2020-2032
- 10.1. Market Analysis, Insights and Forecast - by Type
- 10.1.1. Land Rides
- 10.1.2. Water Rides
- 10.1.3. Other Types
- 10.2. Market Analysis, Insights and Forecast - by Source of Revenue
- 10.2.1. Tickets
- 10.2.2. Foods & Beverages
- 10.2.3. Merchandise
- 10.2.4. Hospitality
- 10.2.5. Other Source of Revenues
- 10.1. Market Analysis, Insights and Forecast - by Type
- 11. Asia Pacific USA Amusement and Theme Park Industry Analysis, Insights and Forecast, 2020-2032
- 11.1. Market Analysis, Insights and Forecast - by Type
- 11.1.1. Land Rides
- 11.1.2. Water Rides
- 11.1.3. Other Types
- 11.2. Market Analysis, Insights and Forecast - by Source of Revenue
- 11.2.1. Tickets
- 11.2.2. Foods & Beverages
- 11.2.3. Merchandise
- 11.2.4. Hospitality
- 11.2.5. Other Source of Revenues
- 11.1. Market Analysis, Insights and Forecast - by Type
- 12. Competitive Analysis
- 12.1. Company Profiles
- 12.1.1 Disney Parks
- 12.1.1.1. Company Overview
- 12.1.1.2. Products
- 12.1.1.3. Company Financials
- 12.1.1.4. SWOT Analysis
- 12.1.2 Dollywood
- 12.1.2.1. Company Overview
- 12.1.2.2. Products
- 12.1.2.3. Company Financials
- 12.1.2.4. SWOT Analysis
- 12.1.3 Universal Parks and Resorts
- 12.1.3.1. Company Overview
- 12.1.3.2. Products
- 12.1.3.3. Company Financials
- 12.1.3.4. SWOT Analysis
- 12.1.4 Silver Dollar City
- 12.1.4.1. Company Overview
- 12.1.4.2. Products
- 12.1.4.3. Company Financials
- 12.1.4.4. SWOT Analysis
- 12.1.5 Hersheypark
- 12.1.5.1. Company Overview
- 12.1.5.2. Products
- 12.1.5.3. Company Financials
- 12.1.5.4. SWOT Analysis
- 12.1.6 Six Flags Inc
- 12.1.6.1. Company Overview
- 12.1.6.2. Products
- 12.1.6.3. Company Financials
- 12.1.6.4. SWOT Analysis
- 12.1.7 Busch Garden
- 12.1.7.1. Company Overview
- 12.1.7.2. Products
- 12.1.7.3. Company Financials
- 12.1.7.4. SWOT Analysis
- 12.1.8 The Island in Pigeon Forge
- 12.1.8.1. Company Overview
- 12.1.8.2. Products
- 12.1.8.3. Company Financials
- 12.1.8.4. SWOT Analysis
- 12.1.9 Cedar Fair Entertainment Company
- 12.1.9.1. Company Overview
- 12.1.9.2. Products
- 12.1.9.3. Company Financials
- 12.1.9.4. SWOT Analysis
- 12.1.10 Magic Kingdom Park
- 12.1.10.1. Company Overview
- 12.1.10.2. Products
- 12.1.10.3. Company Financials
- 12.1.10.4. SWOT Analysis
- 12.1.11 Dells Waterpark**List Not Exhaustive
- 12.1.11.1. Company Overview
- 12.1.11.2. Products
- 12.1.11.3. Company Financials
- 12.1.11.4. SWOT Analysis
- 12.1.12 Seaworld Parks and Entertainment
- 12.1.12.1. Company Overview
- 12.1.12.2. Products
- 12.1.12.3. Company Financials
- 12.1.12.4. SWOT Analysis
- 12.1.1 Disney Parks
- 12.2. Market Entropy
- 12.2.1 Company's Key Areas Served
- 12.2.2 Recent Developments
- 12.3. Company Market Share Analysis 2025
- 12.3.1 Top 5 Companies Market Share Analysis
- 12.3.2 Top 3 Companies Market Share Analysis
- 12.4. List of Potential Customers
- 13. Research Methodology
List of Figures
- Figure 1: Global USA Amusement and Theme Park Industry Revenue Breakdown (Million, %) by Region 2025 & 2033
- Figure 2: North America USA Amusement and Theme Park Industry Revenue (Million), by Type 2025 & 2033
- Figure 3: North America USA Amusement and Theme Park Industry Revenue Share (%), by Type 2025 & 2033
- Figure 4: North America USA Amusement and Theme Park Industry Revenue (Million), by Source of Revenue 2025 & 2033
- Figure 5: North America USA Amusement and Theme Park Industry Revenue Share (%), by Source of Revenue 2025 & 2033
- Figure 6: North America USA Amusement and Theme Park Industry Revenue (Million), by Country 2025 & 2033
- Figure 7: North America USA Amusement and Theme Park Industry Revenue Share (%), by Country 2025 & 2033
- Figure 8: South America USA Amusement and Theme Park Industry Revenue (Million), by Type 2025 & 2033
- Figure 9: South America USA Amusement and Theme Park Industry Revenue Share (%), by Type 2025 & 2033
- Figure 10: South America USA Amusement and Theme Park Industry Revenue (Million), by Source of Revenue 2025 & 2033
- Figure 11: South America USA Amusement and Theme Park Industry Revenue Share (%), by Source of Revenue 2025 & 2033
- Figure 12: South America USA Amusement and Theme Park Industry Revenue (Million), by Country 2025 & 2033
- Figure 13: South America USA Amusement and Theme Park Industry Revenue Share (%), by Country 2025 & 2033
- Figure 14: Europe USA Amusement and Theme Park Industry Revenue (Million), by Type 2025 & 2033
- Figure 15: Europe USA Amusement and Theme Park Industry Revenue Share (%), by Type 2025 & 2033
- Figure 16: Europe USA Amusement and Theme Park Industry Revenue (Million), by Source of Revenue 2025 & 2033
- Figure 17: Europe USA Amusement and Theme Park Industry Revenue Share (%), by Source of Revenue 2025 & 2033
- Figure 18: Europe USA Amusement and Theme Park Industry Revenue (Million), by Country 2025 & 2033
- Figure 19: Europe USA Amusement and Theme Park Industry Revenue Share (%), by Country 2025 & 2033
- Figure 20: Middle East & Africa USA Amusement and Theme Park Industry Revenue (Million), by Type 2025 & 2033
- Figure 21: Middle East & Africa USA Amusement and Theme Park Industry Revenue Share (%), by Type 2025 & 2033
- Figure 22: Middle East & Africa USA Amusement and Theme Park Industry Revenue (Million), by Source of Revenue 2025 & 2033
- Figure 23: Middle East & Africa USA Amusement and Theme Park Industry Revenue Share (%), by Source of Revenue 2025 & 2033
- Figure 24: Middle East & Africa USA Amusement and Theme Park Industry Revenue (Million), by Country 2025 & 2033
- Figure 25: Middle East & Africa USA Amusement and Theme Park Industry Revenue Share (%), by Country 2025 & 2033
- Figure 26: Asia Pacific USA Amusement and Theme Park Industry Revenue (Million), by Type 2025 & 2033
- Figure 27: Asia Pacific USA Amusement and Theme Park Industry Revenue Share (%), by Type 2025 & 2033
- Figure 28: Asia Pacific USA Amusement and Theme Park Industry Revenue (Million), by Source of Revenue 2025 & 2033
- Figure 29: Asia Pacific USA Amusement and Theme Park Industry Revenue Share (%), by Source of Revenue 2025 & 2033
- Figure 30: Asia Pacific USA Amusement and Theme Park Industry Revenue (Million), by Country 2025 & 2033
- Figure 31: Asia Pacific USA Amusement and Theme Park Industry Revenue Share (%), by Country 2025 & 2033
List of Tables
- Table 1: Global USA Amusement and Theme Park Industry Revenue Million Forecast, by Type 2020 & 2033
- Table 2: Global USA Amusement and Theme Park Industry Revenue Million Forecast, by Source of Revenue 2020 & 2033
- Table 3: Global USA Amusement and Theme Park Industry Revenue Million Forecast, by Region 2020 & 2033
- Table 4: Global USA Amusement and Theme Park Industry Revenue Million Forecast, by Type 2020 & 2033
- Table 5: Global USA Amusement and Theme Park Industry Revenue Million Forecast, by Source of Revenue 2020 & 2033
- Table 6: Global USA Amusement and Theme Park Industry Revenue Million Forecast, by Country 2020 & 2033
- Table 7: United States USA Amusement and Theme Park Industry Revenue (Million) Forecast, by Application 2020 & 2033
- Table 8: Canada USA Amusement and Theme Park Industry Revenue (Million) Forecast, by Application 2020 & 2033
- Table 9: Mexico USA Amusement and Theme Park Industry Revenue (Million) Forecast, by Application 2020 & 2033
- Table 10: Global USA Amusement and Theme Park Industry Revenue Million Forecast, by Type 2020 & 2033
- Table 11: Global USA Amusement and Theme Park Industry Revenue Million Forecast, by Source of Revenue 2020 & 2033
- Table 12: Global USA Amusement and Theme Park Industry Revenue Million Forecast, by Country 2020 & 2033
- Table 13: Brazil USA Amusement and Theme Park Industry Revenue (Million) Forecast, by Application 2020 & 2033
- Table 14: Argentina USA Amusement and Theme Park Industry Revenue (Million) Forecast, by Application 2020 & 2033
- Table 15: Rest of South America USA Amusement and Theme Park Industry Revenue (Million) Forecast, by Application 2020 & 2033
- Table 16: Global USA Amusement and Theme Park Industry Revenue Million Forecast, by Type 2020 & 2033
- Table 17: Global USA Amusement and Theme Park Industry Revenue Million Forecast, by Source of Revenue 2020 & 2033
- Table 18: Global USA Amusement and Theme Park Industry Revenue Million Forecast, by Country 2020 & 2033
- Table 19: United Kingdom USA Amusement and Theme Park Industry Revenue (Million) Forecast, by Application 2020 & 2033
- Table 20: Germany USA Amusement and Theme Park Industry Revenue (Million) Forecast, by Application 2020 & 2033
- Table 21: France USA Amusement and Theme Park Industry Revenue (Million) Forecast, by Application 2020 & 2033
- Table 22: Italy USA Amusement and Theme Park Industry Revenue (Million) Forecast, by Application 2020 & 2033
- Table 23: Spain USA Amusement and Theme Park Industry Revenue (Million) Forecast, by Application 2020 & 2033
- Table 24: Russia USA Amusement and Theme Park Industry Revenue (Million) Forecast, by Application 2020 & 2033
- Table 25: Benelux USA Amusement and Theme Park Industry Revenue (Million) Forecast, by Application 2020 & 2033
- Table 26: Nordics USA Amusement and Theme Park Industry Revenue (Million) Forecast, by Application 2020 & 2033
- Table 27: Rest of Europe USA Amusement and Theme Park Industry Revenue (Million) Forecast, by Application 2020 & 2033
- Table 28: Global USA Amusement and Theme Park Industry Revenue Million Forecast, by Type 2020 & 2033
- Table 29: Global USA Amusement and Theme Park Industry Revenue Million Forecast, by Source of Revenue 2020 & 2033
- Table 30: Global USA Amusement and Theme Park Industry Revenue Million Forecast, by Country 2020 & 2033
- Table 31: Turkey USA Amusement and Theme Park Industry Revenue (Million) Forecast, by Application 2020 & 2033
- Table 32: Israel USA Amusement and Theme Park Industry Revenue (Million) Forecast, by Application 2020 & 2033
- Table 33: GCC USA Amusement and Theme Park Industry Revenue (Million) Forecast, by Application 2020 & 2033
- Table 34: North Africa USA Amusement and Theme Park Industry Revenue (Million) Forecast, by Application 2020 & 2033
- Table 35: South Africa USA Amusement and Theme Park Industry Revenue (Million) Forecast, by Application 2020 & 2033
- Table 36: Rest of Middle East & Africa USA Amusement and Theme Park Industry Revenue (Million) Forecast, by Application 2020 & 2033
- Table 37: Global USA Amusement and Theme Park Industry Revenue Million Forecast, by Type 2020 & 2033
- Table 38: Global USA Amusement and Theme Park Industry Revenue Million Forecast, by Source of Revenue 2020 & 2033
- Table 39: Global USA Amusement and Theme Park Industry Revenue Million Forecast, by Country 2020 & 2033
- Table 40: China USA Amusement and Theme Park Industry Revenue (Million) Forecast, by Application 2020 & 2033
- Table 41: India USA Amusement and Theme Park Industry Revenue (Million) Forecast, by Application 2020 & 2033
- Table 42: Japan USA Amusement and Theme Park Industry Revenue (Million) Forecast, by Application 2020 & 2033
- Table 43: South Korea USA Amusement and Theme Park Industry Revenue (Million) Forecast, by Application 2020 & 2033
- Table 44: ASEAN USA Amusement and Theme Park Industry Revenue (Million) Forecast, by Application 2020 & 2033
- Table 45: Oceania USA Amusement and Theme Park Industry Revenue (Million) Forecast, by Application 2020 & 2033
- Table 46: Rest of Asia Pacific USA Amusement and Theme Park Industry Revenue (Million) Forecast, by Application 2020 & 2033
Frequently Asked Questions
1. What is the projected Compound Annual Growth Rate (CAGR) of the USA Amusement and Theme Park Industry?
The projected CAGR is approximately > 3.50%.
2. Which companies are prominent players in the USA Amusement and Theme Park Industry?
Key companies in the market include Disney Parks, Dollywood, Universal Parks and Resorts, Silver Dollar City, Hersheypark, Six Flags Inc, Busch Garden, The Island in Pigeon Forge, Cedar Fair Entertainment Company, Magic Kingdom Park, Dells Waterpark**List Not Exhaustive, Seaworld Parks and Entertainment.
3. What are the main segments of the USA Amusement and Theme Park Industry?
The market segments include Type, Source of Revenue.
4. Can you provide details about the market size?
The market size is estimated to be USD 23.77 Million as of 2022.
5. What are some drivers contributing to market growth?
The number of baby-boomer tourists is expected to increase. which will fuel the growth of the worldwide amusement park market.; Incorporating energy-saving innovations like LED lighting and solar panels.
6. What are the notable trends driving market growth?
Increase in the number of visitors in amusement and theme parks.
7. Are there any restraints impacting market growth?
Theme parks are raising admission costs and letting guests ride every ride without waiting in queue; Theme parks utilising virtual reality are becoming more and more common..
8. Can you provide examples of recent developments in the market?
September 2023: Crescent Real Estate LLC acquired the Element Orlando Universal Blvd., a 165-key hotel operated under a franchise agreement with Marriott International. Located just outside the confines of the mixed-use development known as Icon Park, Element Orlando hotel guests have immediate access to 20 acres of entertainment opportunities.
9. What pricing options are available for accessing the report?
Pricing options include single-user, multi-user, and enterprise licenses priced at USD 3800, USD 4500, and USD 5800 respectively.
10. Is the market size provided in terms of value or volume?
The market size is provided in terms of value, measured in Million.
11. Are there any specific market keywords associated with the report?
Yes, the market keyword associated with the report is "USA Amusement and Theme Park Industry," which aids in identifying and referencing the specific market segment covered.
12. How do I determine which pricing option suits my needs best?
The pricing options vary based on user requirements and access needs. Individual users may opt for single-user licenses, while businesses requiring broader access may choose multi-user or enterprise licenses for cost-effective access to the report.
13. Are there any additional resources or data provided in the USA Amusement and Theme Park Industry report?
While the report offers comprehensive insights, it's advisable to review the specific contents or supplementary materials provided to ascertain if additional resources or data are available.
14. How can I stay updated on further developments or reports in the USA Amusement and Theme Park Industry?
To stay informed about further developments, trends, and reports in the USA Amusement and Theme Park Industry, consider subscribing to industry newsletters, following relevant companies and organizations, or regularly checking reputable industry news sources and publications.
Methodology
Step 1 - Identification of Relevant Samples Size from Population Database


Step 2 - Approaches for Defining Global Market Size (Value, Volume* & Price*)

Note*: In applicable scenarios
Step 3 - Data Sources
Primary Research
- Web Analytics
- Survey Reports
- Research Institute
- Latest Research Reports
- Opinion Leaders
Secondary Research
- Annual Reports
- White Paper
- Latest Press Release
- Industry Association
- Paid Database
- Investor Presentations

Step 4 - Data Triangulation
Involves using different sources of information in order to increase the validity of a study
These sources are likely to be stakeholders in a program - participants, other researchers, program staff, other community members, and so on.
Then we put all data in single framework & apply various statistical tools to find out the dynamic on the market.
During the analysis stage, feedback from the stakeholder groups would be compared to determine areas of agreement as well as areas of divergence