

Key Insights
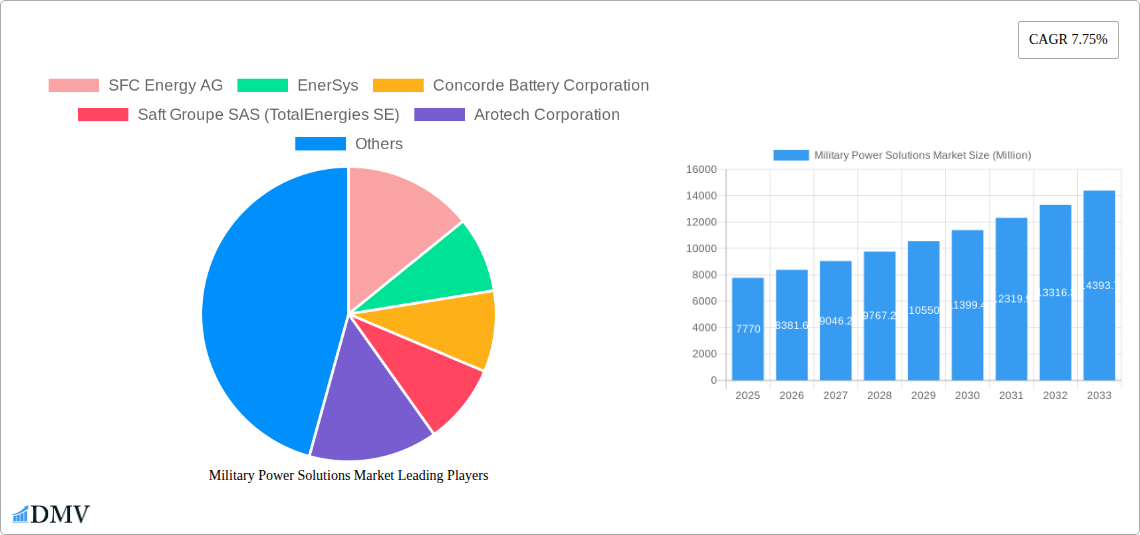
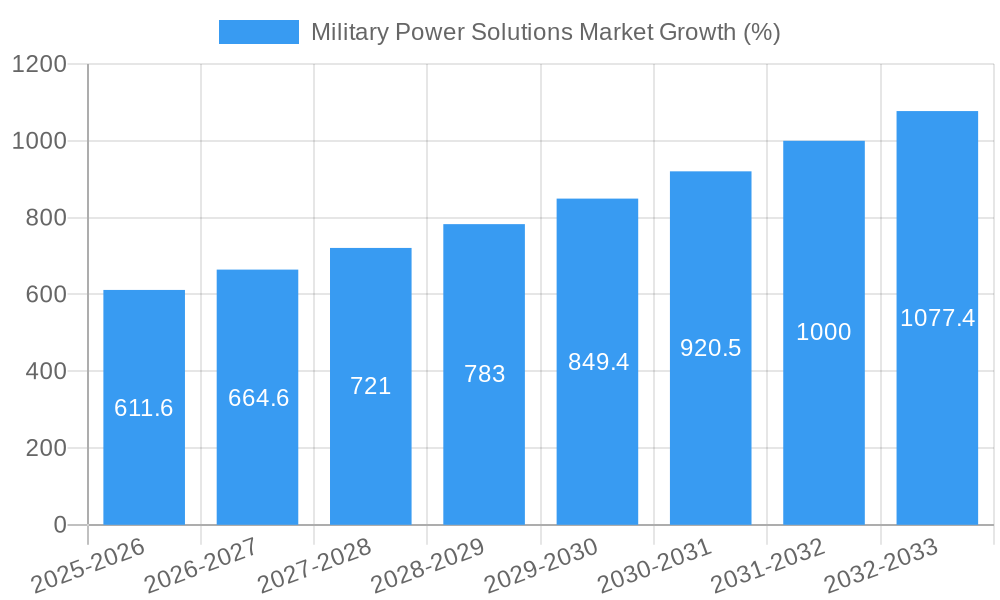
The Military Power Solutions market, valued at $7.77 billion in 2025, is projected to experience robust growth, exhibiting a Compound Annual Growth Rate (CAGR) of 7.75% from 2025 to 2033. This expansion is driven by several key factors. Increased defense budgets globally, particularly in regions experiencing geopolitical instability, fuel demand for advanced and reliable power solutions for military applications. The growing adoption of unmanned aerial vehicles (UAVs) and other autonomous systems necessitates lightweight, high-efficiency power sources, further stimulating market growth. Furthermore, the continuous development of advanced battery technologies, such as lithium-ion and solid-state batteries, offering improved energy density and lifespan, contributes significantly to market expansion. The shift towards electrification in military vehicles and equipment also presents substantial growth opportunities. Technological advancements in power generation and management systems, coupled with a focus on enhancing operational efficiency and reducing reliance on traditional fuel sources, are pivotal in shaping market dynamics.
However, the market faces certain challenges. High initial investment costs associated with adopting new technologies can act as a restraint, particularly for smaller nations with limited defense budgets. The stringent regulatory landscape surrounding the development and deployment of military power solutions, including environmental regulations and safety standards, necessitates significant compliance efforts. Moreover, technological advancements often involve sophisticated supply chains with potential vulnerabilities to disruptions, posing a risk to market stability. Despite these challenges, the long-term outlook for the Military Power Solutions market remains positive, driven by consistent technological innovations and increased global defense spending. The market segmentation across portable and non-portable solutions, diverse power sources, and deployment platforms (air, land, and sea) presents further opportunities for specialized product development and tailored solutions. Key players in the market are continuously investing in research and development to maintain a competitive edge, further accelerating market growth.
Military Power Solutions Market: A Comprehensive Market Report (2019-2033)
This insightful report provides a comprehensive analysis of the Military Power Solutions Market, offering invaluable insights for stakeholders seeking to understand market dynamics, growth trajectories, and future opportunities. With a study period spanning 2019-2033, a base year of 2025, and a forecast period of 2025-2033, this report meticulously examines the market's historical performance (2019-2024) and projects its future growth. The market is expected to reach xx Million by 2033, presenting significant investment and expansion opportunities.
Military Power Solutions Market Composition & Trends
The Military Power Solutions Market is characterized by a moderately concentrated landscape, with key players vying for market share. Innovation is driven by the continuous demand for enhanced power efficiency, reliability, and miniaturization in military applications. Stringent regulatory frameworks concerning safety and environmental compliance significantly influence market operations. Substitute products, such as fuel cells and alternative energy sources, are emerging, but their adoption is gradual due to limitations in energy density and technological maturity. End-users primarily consist of defense ministries, military branches, and defense contractors globally. Mergers and acquisitions (M&A) play a vital role in shaping the market, with deal values exceeding xx Million in recent years.
- Market Share Distribution (2024): EnerSys holds approximately 15% market share, followed by Saft Groupe SAS (TotalEnergies SE) at 12%, and RTX Corporation at 10%. The remaining market share is distributed among other players.
- M&A Activity (2019-2024): A total of 15 significant M&A deals, with a combined value exceeding xx Million, were recorded during this period. These acquisitions primarily focused on expanding geographical reach and technological capabilities.
Military Power Solutions Market Industry Evolution
The Military Power Solutions Market has experienced consistent growth over the past five years, driven by escalating global defense budgets and the increasing demand for advanced military technologies. Technological advancements, such as the development of high-energy density batteries and improved generator technologies, are significantly impacting market growth. Furthermore, the adoption of hybrid and electric power systems in military vehicles and equipment is driving demand for advanced power solutions. The market witnessed a Compound Annual Growth Rate (CAGR) of approximately 7% during the historical period (2019-2024) and is projected to maintain a CAGR of xx% during the forecast period (2025-2033). This growth is fueled by the increasing focus on lightweight, portable power solutions, especially for unmanned aerial vehicles (UAVs) and portable field equipment. The market is gradually moving towards more sustainable and environmentally friendly power solutions.
Leading Regions, Countries, or Segments in Military Power Solutions Market
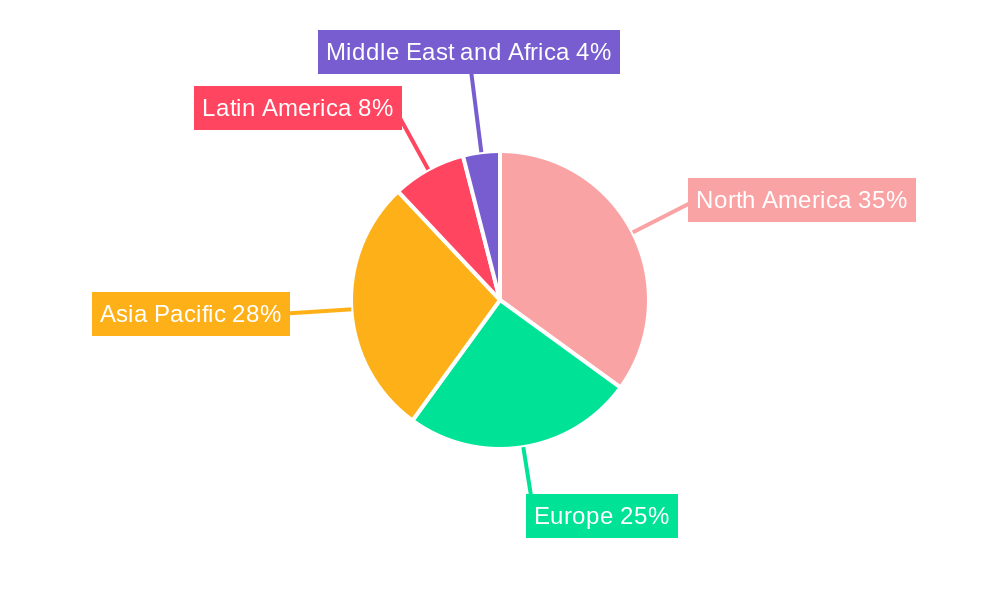
North America currently dominates the Military Power Solutions Market, driven by substantial defense budgets and the presence of major defense contractors. The US holds the largest share within this region, benefiting from extensive research and development initiatives and technological advancements.
- By Type: The Non-portable segment holds a larger market share due to the substantial power requirements of larger military platforms.
- By Source: Batteries are the dominant source, driven by their portability, ease of use, and increasing energy density.
- By Platform: The Land segment commands the largest market share, owing to the high number of land-based military vehicles and equipment.
Key Drivers:
- High Defense Spending: Significant investments in military modernization and technological upgrades in countries like the US and China are a primary driver.
- Technological Advancements: The introduction of advanced battery technologies, such as lithium-ion and solid-state batteries, and improved fuel cell systems is enhancing market growth.
- Government Regulations: Stringent regulations promoting the use of sustainable and environmentally friendly power sources are influencing market trends.
Military Power Solutions Market Product Innovations
Recent innovations focus on developing higher energy density, lighter-weight, and more robust power solutions. This includes advancements in battery chemistries, improved fuel cell technology, and the integration of smart power management systems. These advancements enhance operational efficiency, extend operational lifespan, and improve the overall performance of military equipment. Unique selling propositions focus on enhanced reliability, durability, and reduced weight.
Propelling Factors for Military Power Solutions Market Growth
Several factors fuel the Military Power Solutions Market's expansion. Firstly, increasing defense spending globally, particularly in the US and Asia-Pacific regions, drives demand for advanced power solutions. Secondly, technological advancements in battery technology and fuel cells offer higher energy density, extended lifespan, and improved efficiency. Finally, stringent environmental regulations are pushing the adoption of cleaner and more sustainable power solutions.
Obstacles in the Military Power Solutions Market
The market faces challenges, including supply chain disruptions affecting raw material availability and production costs. Stringent regulatory requirements for safety and environmental compliance add to the complexity and cost of product development and deployment. Furthermore, intense competition among established players and the emergence of new entrants exert significant competitive pressure.
Future Opportunities in Military Power Solutions Market
Future opportunities lie in the development and adoption of advanced battery technologies, such as solid-state batteries, and the integration of renewable energy sources into military power systems. Furthermore, expanding into emerging markets and exploring the potential of unmanned aerial vehicles (UAVs) and other autonomous systems presents significant growth potential.
Major Players in the Military Power Solutions Market Ecosystem
- SFC Energy AG
- EnerSys
- Concorde Battery Corporation
- Saft Groupe SAS (TotalEnergies SE)
- Arotech Corporation
- RTX Corporation
- Denchi Group Ltd
- Eniquest
- HIMOINSA S
- Cummins Inc
- EaglePicher Technologies LLC
Key Developments in Military Power Solutions Market Industry
- August 2023: Collins Aerospace (RTX Corporation) secured a USD 24 Million contract for electric generators for the US Army, boosting the demand for advanced generator technology.
- April 2023: EnerSys's acquisition of IBCS strengthens its service offerings and market presence in the UK, highlighting the importance of M&A in market expansion.
Strategic Military Power Solutions Market Forecast
The Military Power Solutions Market is poised for continued growth, driven by sustained defense spending, technological innovation, and the increasing demand for sustainable power solutions. The market's future potential is substantial, with significant opportunities in the development and adoption of advanced technologies and expansion into new geographical markets. The market is expected to experience robust growth throughout the forecast period, driven by a confluence of technological, economic, and geopolitical factors.
Military Power Solutions Market Segmentation
-
1. Type
- 1.1. Portable
- 1.2. Non-portable
-
2. Source
- 2.1. Batteries
- 2.2. Generators
- 2.3. Other Sources
-
3. Platform
- 3.1. Air
- 3.2. Land
- 3.3. Sea
Military Power Solutions Market Segmentation By Geography
-
1. North America
- 1.1. United States
- 1.2. Canada
-
2. Europe
- 2.1. United Kingdom
- 2.2. Germany
- 2.3. France
- 2.4. Russia
- 2.5. Rest of Europe
-
3. Asia Pacific
- 3.1. China
- 3.2. India
- 3.3. Japan
- 3.4. South Korea
- 3.5. Rest of Asia Pacific
-
4. Latin America
- 4.1. Brazil
- 4.2. Rest of Latin America
-
5. Middle East and Africa
- 5.1. United Arab Emirates
- 5.2. Saudi Arabia
- 5.3. Israel
- 5.4. Rest of Middle East and Africa
Military Power Solutions Market REPORT HIGHLIGHTS
| Aspects | Details |
|---|---|
| Study Period | 2019-2033 |
| Base Year | 2024 |
| Estimated Year | 2025 |
| Forecast Period | 2025-2033 |
| Historical Period | 2019-2024 |
| Growth Rate | CAGR of 7.75% from 2019-2033 |
| Segmentation |
|
Table of Contents
- 1. Introduction
- 1.1. Research Scope
- 1.2. Market Segmentation
- 1.3. Research Methodology
- 1.4. Definitions and Assumptions
- 2. Executive Summary
- 2.1. Introduction
- 3. Market Dynamics
- 3.1. Introduction
- 3.2. Market Drivers
- 3.3. Market Restrains
- 3.4. Market Trends
- 3.4.1. Generators Segment to Continue Market Share Domination
- 4. Market Factor Analysis
- 4.1. Porters Five Forces
- 4.2. Supply/Value Chain
- 4.3. PESTEL analysis
- 4.4. Market Entropy
- 4.5. Patent/Trademark Analysis
- 5. Global Military Power Solutions Market Analysis, Insights and Forecast, 2019-2031
- 5.1. Market Analysis, Insights and Forecast - by Type
- 5.1.1. Portable
- 5.1.2. Non-portable
- 5.2. Market Analysis, Insights and Forecast - by Source
- 5.2.1. Batteries
- 5.2.2. Generators
- 5.2.3. Other Sources
- 5.3. Market Analysis, Insights and Forecast - by Platform
- 5.3.1. Air
- 5.3.2. Land
- 5.3.3. Sea
- 5.4. Market Analysis, Insights and Forecast - by Region
- 5.4.1. North America
- 5.4.2. Europe
- 5.4.3. Asia Pacific
- 5.4.4. Latin America
- 5.4.5. Middle East and Africa
- 5.1. Market Analysis, Insights and Forecast - by Type
- 6. North America Military Power Solutions Market Analysis, Insights and Forecast, 2019-2031
- 6.1. Market Analysis, Insights and Forecast - by Type
- 6.1.1. Portable
- 6.1.2. Non-portable
- 6.2. Market Analysis, Insights and Forecast - by Source
- 6.2.1. Batteries
- 6.2.2. Generators
- 6.2.3. Other Sources
- 6.3. Market Analysis, Insights and Forecast - by Platform
- 6.3.1. Air
- 6.3.2. Land
- 6.3.3. Sea
- 6.1. Market Analysis, Insights and Forecast - by Type
- 7. Europe Military Power Solutions Market Analysis, Insights and Forecast, 2019-2031
- 7.1. Market Analysis, Insights and Forecast - by Type
- 7.1.1. Portable
- 7.1.2. Non-portable
- 7.2. Market Analysis, Insights and Forecast - by Source
- 7.2.1. Batteries
- 7.2.2. Generators
- 7.2.3. Other Sources
- 7.3. Market Analysis, Insights and Forecast - by Platform
- 7.3.1. Air
- 7.3.2. Land
- 7.3.3. Sea
- 7.1. Market Analysis, Insights and Forecast - by Type
- 8. Asia Pacific Military Power Solutions Market Analysis, Insights and Forecast, 2019-2031
- 8.1. Market Analysis, Insights and Forecast - by Type
- 8.1.1. Portable
- 8.1.2. Non-portable
- 8.2. Market Analysis, Insights and Forecast - by Source
- 8.2.1. Batteries
- 8.2.2. Generators
- 8.2.3. Other Sources
- 8.3. Market Analysis, Insights and Forecast - by Platform
- 8.3.1. Air
- 8.3.2. Land
- 8.3.3. Sea
- 8.1. Market Analysis, Insights and Forecast - by Type
- 9. Latin America Military Power Solutions Market Analysis, Insights and Forecast, 2019-2031
- 9.1. Market Analysis, Insights and Forecast - by Type
- 9.1.1. Portable
- 9.1.2. Non-portable
- 9.2. Market Analysis, Insights and Forecast - by Source
- 9.2.1. Batteries
- 9.2.2. Generators
- 9.2.3. Other Sources
- 9.3. Market Analysis, Insights and Forecast - by Platform
- 9.3.1. Air
- 9.3.2. Land
- 9.3.3. Sea
- 9.1. Market Analysis, Insights and Forecast - by Type
- 10. Middle East and Africa Military Power Solutions Market Analysis, Insights and Forecast, 2019-2031
- 10.1. Market Analysis, Insights and Forecast - by Type
- 10.1.1. Portable
- 10.1.2. Non-portable
- 10.2. Market Analysis, Insights and Forecast - by Source
- 10.2.1. Batteries
- 10.2.2. Generators
- 10.2.3. Other Sources
- 10.3. Market Analysis, Insights and Forecast - by Platform
- 10.3.1. Air
- 10.3.2. Land
- 10.3.3. Sea
- 10.1. Market Analysis, Insights and Forecast - by Type
- 11. North America Military Power Solutions Market Analysis, Insights and Forecast, 2019-2031
- 11.1. Market Analysis, Insights and Forecast - By Country/Sub-region
- 11.1.1 United States
- 11.1.2 Canada
- 12. Europe Military Power Solutions Market Analysis, Insights and Forecast, 2019-2031
- 12.1. Market Analysis, Insights and Forecast - By Country/Sub-region
- 12.1.1 United Kingdom
- 12.1.2 Germany
- 12.1.3 France
- 12.1.4 Russia
- 12.1.5 Rest of Europe
- 13. Asia Pacific Military Power Solutions Market Analysis, Insights and Forecast, 2019-2031
- 13.1. Market Analysis, Insights and Forecast - By Country/Sub-region
- 13.1.1 China
- 13.1.2 India
- 13.1.3 Japan
- 13.1.4 South Korea
- 13.1.5 Rest of Asia Pacific
- 14. Latin America Military Power Solutions Market Analysis, Insights and Forecast, 2019-2031
- 14.1. Market Analysis, Insights and Forecast - By Country/Sub-region
- 14.1.1 Brazil
- 14.1.2 Rest of Latin America
- 15. Middle East and Africa Military Power Solutions Market Analysis, Insights and Forecast, 2019-2031
- 15.1. Market Analysis, Insights and Forecast - By Country/Sub-region
- 15.1.1 United Arab Emirates
- 15.1.2 Saudi Arabia
- 15.1.3 Israel
- 15.1.4 Rest of Middle East and Africa
- 16. Competitive Analysis
- 16.1. Global Market Share Analysis 2024
- 16.2. Company Profiles
- 16.2.1 SFC Energy AG
- 16.2.1.1. Overview
- 16.2.1.2. Products
- 16.2.1.3. SWOT Analysis
- 16.2.1.4. Recent Developments
- 16.2.1.5. Financials (Based on Availability)
- 16.2.2 EnerSys
- 16.2.2.1. Overview
- 16.2.2.2. Products
- 16.2.2.3. SWOT Analysis
- 16.2.2.4. Recent Developments
- 16.2.2.5. Financials (Based on Availability)
- 16.2.3 Concorde Battery Corporation
- 16.2.3.1. Overview
- 16.2.3.2. Products
- 16.2.3.3. SWOT Analysis
- 16.2.3.4. Recent Developments
- 16.2.3.5. Financials (Based on Availability)
- 16.2.4 Saft Groupe SAS (TotalEnergies SE)
- 16.2.4.1. Overview
- 16.2.4.2. Products
- 16.2.4.3. SWOT Analysis
- 16.2.4.4. Recent Developments
- 16.2.4.5. Financials (Based on Availability)
- 16.2.5 Arotech Corporation
- 16.2.5.1. Overview
- 16.2.5.2. Products
- 16.2.5.3. SWOT Analysis
- 16.2.5.4. Recent Developments
- 16.2.5.5. Financials (Based on Availability)
- 16.2.6 RTX Corporation
- 16.2.6.1. Overview
- 16.2.6.2. Products
- 16.2.6.3. SWOT Analysis
- 16.2.6.4. Recent Developments
- 16.2.6.5. Financials (Based on Availability)
- 16.2.7 Denchi Group Ltd
- 16.2.7.1. Overview
- 16.2.7.2. Products
- 16.2.7.3. SWOT Analysis
- 16.2.7.4. Recent Developments
- 16.2.7.5. Financials (Based on Availability)
- 16.2.8 Eniquest
- 16.2.8.1. Overview
- 16.2.8.2. Products
- 16.2.8.3. SWOT Analysis
- 16.2.8.4. Recent Developments
- 16.2.8.5. Financials (Based on Availability)
- 16.2.9 HIMOINSA S
- 16.2.9.1. Overview
- 16.2.9.2. Products
- 16.2.9.3. SWOT Analysis
- 16.2.9.4. Recent Developments
- 16.2.9.5. Financials (Based on Availability)
- 16.2.10 Cummins Inc
- 16.2.10.1. Overview
- 16.2.10.2. Products
- 16.2.10.3. SWOT Analysis
- 16.2.10.4. Recent Developments
- 16.2.10.5. Financials (Based on Availability)
- 16.2.11 EaglePicher Technologies LLC
- 16.2.11.1. Overview
- 16.2.11.2. Products
- 16.2.11.3. SWOT Analysis
- 16.2.11.4. Recent Developments
- 16.2.11.5. Financials (Based on Availability)
- 16.2.1 SFC Energy AG
List of Figures
- Figure 1: Global Military Power Solutions Market Revenue Breakdown (Million, %) by Region 2024 & 2032
- Figure 2: North America Military Power Solutions Market Revenue (Million), by Country 2024 & 2032
- Figure 3: North America Military Power Solutions Market Revenue Share (%), by Country 2024 & 2032
- Figure 4: Europe Military Power Solutions Market Revenue (Million), by Country 2024 & 2032
- Figure 5: Europe Military Power Solutions Market Revenue Share (%), by Country 2024 & 2032
- Figure 6: Asia Pacific Military Power Solutions Market Revenue (Million), by Country 2024 & 2032
- Figure 7: Asia Pacific Military Power Solutions Market Revenue Share (%), by Country 2024 & 2032
- Figure 8: Latin America Military Power Solutions Market Revenue (Million), by Country 2024 & 2032
- Figure 9: Latin America Military Power Solutions Market Revenue Share (%), by Country 2024 & 2032
- Figure 10: Middle East and Africa Military Power Solutions Market Revenue (Million), by Country 2024 & 2032
- Figure 11: Middle East and Africa Military Power Solutions Market Revenue Share (%), by Country 2024 & 2032
- Figure 12: North America Military Power Solutions Market Revenue (Million), by Type 2024 & 2032
- Figure 13: North America Military Power Solutions Market Revenue Share (%), by Type 2024 & 2032
- Figure 14: North America Military Power Solutions Market Revenue (Million), by Source 2024 & 2032
- Figure 15: North America Military Power Solutions Market Revenue Share (%), by Source 2024 & 2032
- Figure 16: North America Military Power Solutions Market Revenue (Million), by Platform 2024 & 2032
- Figure 17: North America Military Power Solutions Market Revenue Share (%), by Platform 2024 & 2032
- Figure 18: North America Military Power Solutions Market Revenue (Million), by Country 2024 & 2032
- Figure 19: North America Military Power Solutions Market Revenue Share (%), by Country 2024 & 2032
- Figure 20: Europe Military Power Solutions Market Revenue (Million), by Type 2024 & 2032
- Figure 21: Europe Military Power Solutions Market Revenue Share (%), by Type 2024 & 2032
- Figure 22: Europe Military Power Solutions Market Revenue (Million), by Source 2024 & 2032
- Figure 23: Europe Military Power Solutions Market Revenue Share (%), by Source 2024 & 2032
- Figure 24: Europe Military Power Solutions Market Revenue (Million), by Platform 2024 & 2032
- Figure 25: Europe Military Power Solutions Market Revenue Share (%), by Platform 2024 & 2032
- Figure 26: Europe Military Power Solutions Market Revenue (Million), by Country 2024 & 2032
- Figure 27: Europe Military Power Solutions Market Revenue Share (%), by Country 2024 & 2032
- Figure 28: Asia Pacific Military Power Solutions Market Revenue (Million), by Type 2024 & 2032
- Figure 29: Asia Pacific Military Power Solutions Market Revenue Share (%), by Type 2024 & 2032
- Figure 30: Asia Pacific Military Power Solutions Market Revenue (Million), by Source 2024 & 2032
- Figure 31: Asia Pacific Military Power Solutions Market Revenue Share (%), by Source 2024 & 2032
- Figure 32: Asia Pacific Military Power Solutions Market Revenue (Million), by Platform 2024 & 2032
- Figure 33: Asia Pacific Military Power Solutions Market Revenue Share (%), by Platform 2024 & 2032
- Figure 34: Asia Pacific Military Power Solutions Market Revenue (Million), by Country 2024 & 2032
- Figure 35: Asia Pacific Military Power Solutions Market Revenue Share (%), by Country 2024 & 2032
- Figure 36: Latin America Military Power Solutions Market Revenue (Million), by Type 2024 & 2032
- Figure 37: Latin America Military Power Solutions Market Revenue Share (%), by Type 2024 & 2032
- Figure 38: Latin America Military Power Solutions Market Revenue (Million), by Source 2024 & 2032
- Figure 39: Latin America Military Power Solutions Market Revenue Share (%), by Source 2024 & 2032
- Figure 40: Latin America Military Power Solutions Market Revenue (Million), by Platform 2024 & 2032
- Figure 41: Latin America Military Power Solutions Market Revenue Share (%), by Platform 2024 & 2032
- Figure 42: Latin America Military Power Solutions Market Revenue (Million), by Country 2024 & 2032
- Figure 43: Latin America Military Power Solutions Market Revenue Share (%), by Country 2024 & 2032
- Figure 44: Middle East and Africa Military Power Solutions Market Revenue (Million), by Type 2024 & 2032
- Figure 45: Middle East and Africa Military Power Solutions Market Revenue Share (%), by Type 2024 & 2032
- Figure 46: Middle East and Africa Military Power Solutions Market Revenue (Million), by Source 2024 & 2032
- Figure 47: Middle East and Africa Military Power Solutions Market Revenue Share (%), by Source 2024 & 2032
- Figure 48: Middle East and Africa Military Power Solutions Market Revenue (Million), by Platform 2024 & 2032
- Figure 49: Middle East and Africa Military Power Solutions Market Revenue Share (%), by Platform 2024 & 2032
- Figure 50: Middle East and Africa Military Power Solutions Market Revenue (Million), by Country 2024 & 2032
- Figure 51: Middle East and Africa Military Power Solutions Market Revenue Share (%), by Country 2024 & 2032
List of Tables
- Table 1: Global Military Power Solutions Market Revenue Million Forecast, by Region 2019 & 2032
- Table 2: Global Military Power Solutions Market Revenue Million Forecast, by Type 2019 & 2032
- Table 3: Global Military Power Solutions Market Revenue Million Forecast, by Source 2019 & 2032
- Table 4: Global Military Power Solutions Market Revenue Million Forecast, by Platform 2019 & 2032
- Table 5: Global Military Power Solutions Market Revenue Million Forecast, by Region 2019 & 2032
- Table 6: Global Military Power Solutions Market Revenue Million Forecast, by Country 2019 & 2032
- Table 7: United States Military Power Solutions Market Revenue (Million) Forecast, by Application 2019 & 2032
- Table 8: Canada Military Power Solutions Market Revenue (Million) Forecast, by Application 2019 & 2032
- Table 9: Global Military Power Solutions Market Revenue Million Forecast, by Country 2019 & 2032
- Table 10: United Kingdom Military Power Solutions Market Revenue (Million) Forecast, by Application 2019 & 2032
- Table 11: Germany Military Power Solutions Market Revenue (Million) Forecast, by Application 2019 & 2032
- Table 12: France Military Power Solutions Market Revenue (Million) Forecast, by Application 2019 & 2032
- Table 13: Russia Military Power Solutions Market Revenue (Million) Forecast, by Application 2019 & 2032
- Table 14: Rest of Europe Military Power Solutions Market Revenue (Million) Forecast, by Application 2019 & 2032
- Table 15: Global Military Power Solutions Market Revenue Million Forecast, by Country 2019 & 2032
- Table 16: China Military Power Solutions Market Revenue (Million) Forecast, by Application 2019 & 2032
- Table 17: India Military Power Solutions Market Revenue (Million) Forecast, by Application 2019 & 2032
- Table 18: Japan Military Power Solutions Market Revenue (Million) Forecast, by Application 2019 & 2032
- Table 19: South Korea Military Power Solutions Market Revenue (Million) Forecast, by Application 2019 & 2032
- Table 20: Rest of Asia Pacific Military Power Solutions Market Revenue (Million) Forecast, by Application 2019 & 2032
- Table 21: Global Military Power Solutions Market Revenue Million Forecast, by Country 2019 & 2032
- Table 22: Brazil Military Power Solutions Market Revenue (Million) Forecast, by Application 2019 & 2032
- Table 23: Rest of Latin America Military Power Solutions Market Revenue (Million) Forecast, by Application 2019 & 2032
- Table 24: Global Military Power Solutions Market Revenue Million Forecast, by Country 2019 & 2032
- Table 25: United Arab Emirates Military Power Solutions Market Revenue (Million) Forecast, by Application 2019 & 2032
- Table 26: Saudi Arabia Military Power Solutions Market Revenue (Million) Forecast, by Application 2019 & 2032
- Table 27: Israel Military Power Solutions Market Revenue (Million) Forecast, by Application 2019 & 2032
- Table 28: Rest of Middle East and Africa Military Power Solutions Market Revenue (Million) Forecast, by Application 2019 & 2032
- Table 29: Global Military Power Solutions Market Revenue Million Forecast, by Type 2019 & 2032
- Table 30: Global Military Power Solutions Market Revenue Million Forecast, by Source 2019 & 2032
- Table 31: Global Military Power Solutions Market Revenue Million Forecast, by Platform 2019 & 2032
- Table 32: Global Military Power Solutions Market Revenue Million Forecast, by Country 2019 & 2032
- Table 33: United States Military Power Solutions Market Revenue (Million) Forecast, by Application 2019 & 2032
- Table 34: Canada Military Power Solutions Market Revenue (Million) Forecast, by Application 2019 & 2032
- Table 35: Global Military Power Solutions Market Revenue Million Forecast, by Type 2019 & 2032
- Table 36: Global Military Power Solutions Market Revenue Million Forecast, by Source 2019 & 2032
- Table 37: Global Military Power Solutions Market Revenue Million Forecast, by Platform 2019 & 2032
- Table 38: Global Military Power Solutions Market Revenue Million Forecast, by Country 2019 & 2032
- Table 39: United Kingdom Military Power Solutions Market Revenue (Million) Forecast, by Application 2019 & 2032
- Table 40: Germany Military Power Solutions Market Revenue (Million) Forecast, by Application 2019 & 2032
- Table 41: France Military Power Solutions Market Revenue (Million) Forecast, by Application 2019 & 2032
- Table 42: Russia Military Power Solutions Market Revenue (Million) Forecast, by Application 2019 & 2032
- Table 43: Rest of Europe Military Power Solutions Market Revenue (Million) Forecast, by Application 2019 & 2032
- Table 44: Global Military Power Solutions Market Revenue Million Forecast, by Type 2019 & 2032
- Table 45: Global Military Power Solutions Market Revenue Million Forecast, by Source 2019 & 2032
- Table 46: Global Military Power Solutions Market Revenue Million Forecast, by Platform 2019 & 2032
- Table 47: Global Military Power Solutions Market Revenue Million Forecast, by Country 2019 & 2032
- Table 48: China Military Power Solutions Market Revenue (Million) Forecast, by Application 2019 & 2032
- Table 49: India Military Power Solutions Market Revenue (Million) Forecast, by Application 2019 & 2032
- Table 50: Japan Military Power Solutions Market Revenue (Million) Forecast, by Application 2019 & 2032
- Table 51: South Korea Military Power Solutions Market Revenue (Million) Forecast, by Application 2019 & 2032
- Table 52: Rest of Asia Pacific Military Power Solutions Market Revenue (Million) Forecast, by Application 2019 & 2032
- Table 53: Global Military Power Solutions Market Revenue Million Forecast, by Type 2019 & 2032
- Table 54: Global Military Power Solutions Market Revenue Million Forecast, by Source 2019 & 2032
- Table 55: Global Military Power Solutions Market Revenue Million Forecast, by Platform 2019 & 2032
- Table 56: Global Military Power Solutions Market Revenue Million Forecast, by Country 2019 & 2032
- Table 57: Brazil Military Power Solutions Market Revenue (Million) Forecast, by Application 2019 & 2032
- Table 58: Rest of Latin America Military Power Solutions Market Revenue (Million) Forecast, by Application 2019 & 2032
- Table 59: Global Military Power Solutions Market Revenue Million Forecast, by Type 2019 & 2032
- Table 60: Global Military Power Solutions Market Revenue Million Forecast, by Source 2019 & 2032
- Table 61: Global Military Power Solutions Market Revenue Million Forecast, by Platform 2019 & 2032
- Table 62: Global Military Power Solutions Market Revenue Million Forecast, by Country 2019 & 2032
- Table 63: United Arab Emirates Military Power Solutions Market Revenue (Million) Forecast, by Application 2019 & 2032
- Table 64: Saudi Arabia Military Power Solutions Market Revenue (Million) Forecast, by Application 2019 & 2032
- Table 65: Israel Military Power Solutions Market Revenue (Million) Forecast, by Application 2019 & 2032
- Table 66: Rest of Middle East and Africa Military Power Solutions Market Revenue (Million) Forecast, by Application 2019 & 2032
Frequently Asked Questions
1. What is the projected Compound Annual Growth Rate (CAGR) of the Military Power Solutions Market?
The projected CAGR is approximately 7.75%.
2. Which companies are prominent players in the Military Power Solutions Market?
Key companies in the market include SFC Energy AG, EnerSys, Concorde Battery Corporation, Saft Groupe SAS (TotalEnergies SE), Arotech Corporation, RTX Corporation, Denchi Group Ltd, Eniquest, HIMOINSA S, Cummins Inc, EaglePicher Technologies LLC.
3. What are the main segments of the Military Power Solutions Market?
The market segments include Type, Source, Platform.
4. Can you provide details about the market size?
The market size is estimated to be USD 7.77 Million as of 2022.
5. What are some drivers contributing to market growth?
N/A
6. What are the notable trends driving market growth?
Generators Segment to Continue Market Share Domination.
7. Are there any restraints impacting market growth?
N/A
8. Can you provide examples of recent developments in the market?
August 2023: Collins Aerospace, a part of RTX Corporation, was awarded a USD 24 million contract for producing and delivering electric generators with containers to the USArmy Anniston Depot to support its Abrams M1A2 Main Battle Tank.
9. What pricing options are available for accessing the report?
Pricing options include single-user, multi-user, and enterprise licenses priced at USD 4750, USD 5250, and USD 8750 respectively.
10. Is the market size provided in terms of value or volume?
The market size is provided in terms of value, measured in Million.
11. Are there any specific market keywords associated with the report?
Yes, the market keyword associated with the report is "Military Power Solutions Market," which aids in identifying and referencing the specific market segment covered.
12. How do I determine which pricing option suits my needs best?
The pricing options vary based on user requirements and access needs. Individual users may opt for single-user licenses, while businesses requiring broader access may choose multi-user or enterprise licenses for cost-effective access to the report.
13. Are there any additional resources or data provided in the Military Power Solutions Market report?
While the report offers comprehensive insights, it's advisable to review the specific contents or supplementary materials provided to ascertain if additional resources or data are available.
14. How can I stay updated on further developments or reports in the Military Power Solutions Market?
To stay informed about further developments, trends, and reports in the Military Power Solutions Market, consider subscribing to industry newsletters, following relevant companies and organizations, or regularly checking reputable industry news sources and publications.
Methodology
Step 1 - Identification of Relevant Samples Size from Population Database


Step 2 - Approaches for Defining Global Market Size (Value, Volume* & Price*)

Note*: In applicable scenarios
Step 3 - Data Sources
Primary Research
- Web Analytics
- Survey Reports
- Research Institute
- Latest Research Reports
- Opinion Leaders
Secondary Research
- Annual Reports
- White Paper
- Latest Press Release
- Industry Association
- Paid Database
- Investor Presentations

Step 4 - Data Triangulation
Involves using different sources of information in order to increase the validity of a study
These sources are likely to be stakeholders in a program - participants, other researchers, program staff, other community members, and so on.
Then we put all data in single framework & apply various statistical tools to find out the dynamic on the market.
During the analysis stage, feedback from the stakeholder groups would be compared to determine areas of agreement as well as areas of divergence
