

Key Insights
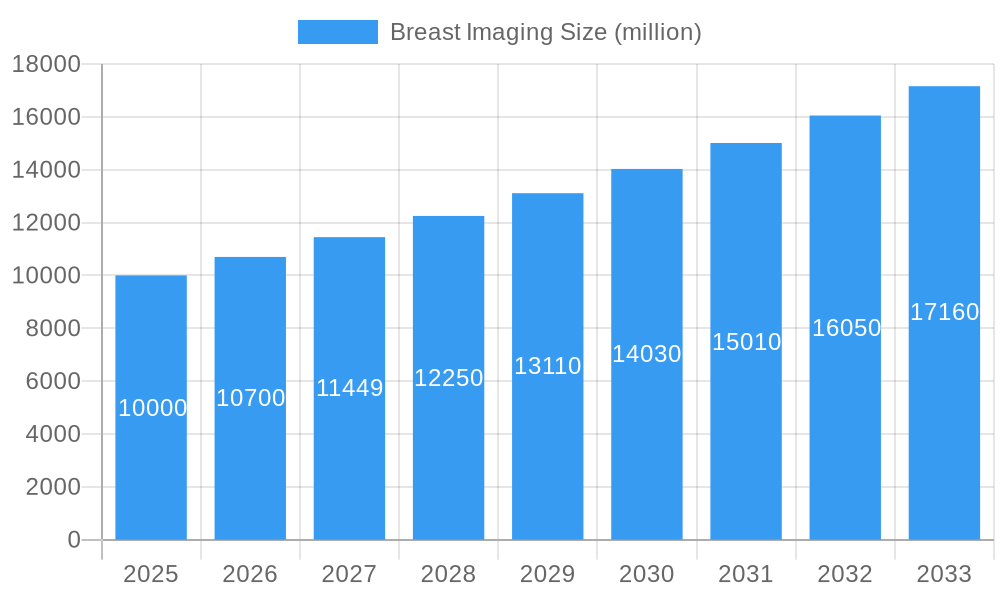
The global breast imaging market is experiencing substantial expansion, propelled by a rising incidence of breast cancer, continuous technological innovations in imaging, and heightened awareness surrounding early detection and diagnosis. The market, valued at $5.88 billion in the base year of 2025, is forecasted to achieve a Compound Annual Growth Rate (CAGR) of 9.7% between 2025 and 2033. Key growth catalysts include the increasing integration of advanced imaging solutions such as digital mammography, 3D tomosynthesis mammography, and breast MRI, which collectively enhance diagnostic precision and image clarity. The expanding elderly demographic, a significant contributor to breast cancer risk, further supports market growth. Additionally, government-backed breast cancer screening initiatives and escalating healthcare spending across both developed and emerging economies are contributing factors. Challenges include the substantial investment required for advanced imaging technologies and the demand for specialized personnel for operation and interpretation.
Breast Imaging Market Size (In Billion)
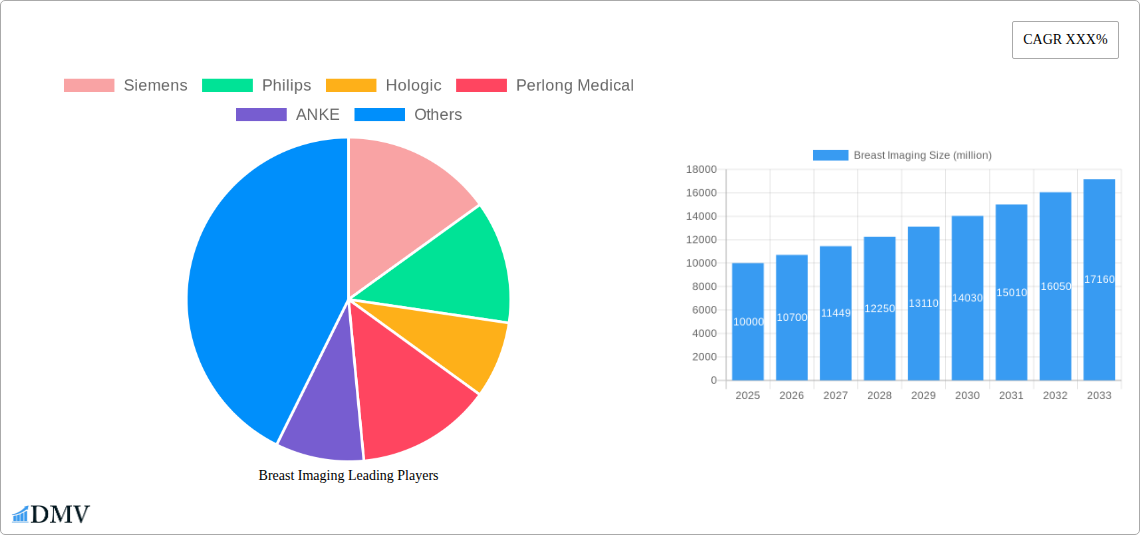
The market is comprehensively segmented by imaging modality (mammography, ultrasound, MRI, etc.), geographic region (North America, Europe, Asia-Pacific, etc.), and end-user (hospitals, clinics, diagnostic centers). Prominent industry leaders like Siemens, Philips, Hologic, and GE Healthcare actively shape the market, characterized by vigorous competition driven by innovation and strategic consolidations.
Breast Imaging Company Market Share
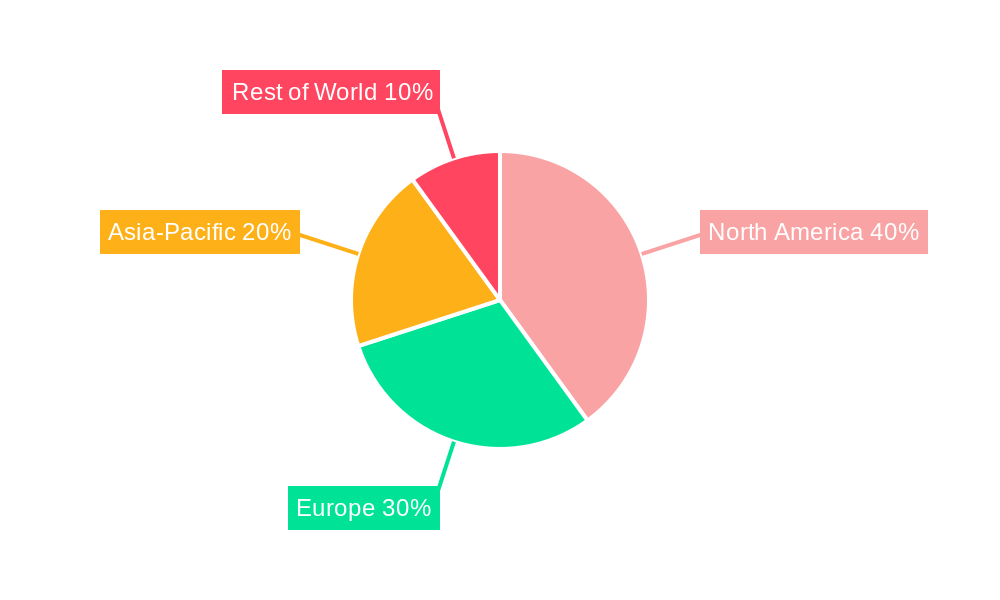
Within the segmental analysis, digital mammography currently commands the largest market share, attributed to its broad accessibility and cost-effectiveness compared to alternative technologies. However, 3D tomosynthesis mammography is projected to exhibit the most rapid growth during the forecast period, owing to its enhanced capacity to identify subtle abnormalities and minimize false positives. Geographically, North America and Europe demonstrate robust market penetration, supported by sophisticated healthcare infrastructure and elevated awareness levels. Conversely, emerging economies in the Asia-Pacific and Latin America regions present significant growth opportunities, facilitated by increasing disposable incomes and expanded healthcare investments. The competitive environment is defined by intense competition among established entities, with a growing emphasis on technological advancements, strategic collaborations, and product portfolio expansion to meet evolving market demands.
Breast Imaging Market Report: A Comprehensive Analysis (2019-2033)
This insightful report provides a comprehensive analysis of the global breast imaging market, projecting a multi-million dollar valuation by 2033. The study meticulously examines market trends, technological advancements, competitive landscapes, and future growth opportunities, offering crucial insights for stakeholders across the healthcare ecosystem. Covering the period from 2019 to 2033, with a base year of 2025 and a forecast period of 2025-2033, this report is essential for strategic decision-making.
Breast Imaging Market Composition & Trends
This section delves into the intricate structure of the breast imaging market, assessing its concentration, innovation drivers, regulatory hurdles, substitute technologies, end-user profiles, and merger & acquisition (M&A) activities. The report analyzes the market share distribution among key players, including Siemens, Philips, Hologic, and GE Healthcare, revealing the competitive dynamics at play. The total market size is estimated at $xx million in 2025, with a projected Compound Annual Growth Rate (CAGR) of xx% during the forecast period.
- Market Concentration: The market exhibits a moderately concentrated structure, with the top five players holding an estimated xx% market share in 2025.
- Innovation Catalysts: Advancements in AI-powered image analysis, 3D mammography, and molecular breast imaging are driving innovation and market expansion.
- Regulatory Landscape: Stringent regulatory approvals and reimbursement policies influence market access and adoption rates.
- Substitute Products: The emergence of alternative screening methods, such as ultrasound and MRI, impacts market growth for certain modalities.
- End-User Profiles: The report profiles hospitals, diagnostic imaging centers, and private clinics as key end-users, examining their unique needs and preferences.
- M&A Activities: The report analyzes significant M&A transactions in the sector, with aggregate deal values exceeding $xx million during the historical period (2019-2024). These activities have shaped the competitive landscape and spurred innovation.
Breast Imaging Industry Evolution
This in-depth analysis charts the evolution of the breast imaging industry, tracing market growth trajectories, technological leaps, and evolving consumer demands. Technological advancements, such as the adoption of digital mammography and tomosynthesis, have significantly improved diagnostic accuracy and efficiency. The report analyzes the growth rate for different imaging modalities and explores the impact of factors such as increasing awareness about breast cancer, improved healthcare infrastructure, and rising disposable incomes. The market is projected to reach $xx million by 2033, driven by factors such as increased screening rates and technological advancements. The adoption rate of AI-powered solutions is projected to increase to xx% by 2033.
Leading Regions, Countries, or Segments in Breast Imaging
This section identifies the leading regions, countries, and segments within the breast imaging market. North America currently holds the largest market share, driven by high healthcare expenditure, advanced infrastructure, and a strong focus on preventative healthcare.
Key Drivers in North America:
- High prevalence of breast cancer.
- Strong regulatory support for advanced imaging technologies.
- High investment in healthcare infrastructure.
- Increased awareness and screening rates.
Other Key Regions: Europe and Asia-Pacific also show substantial growth potential, fueled by increasing healthcare investments and growing awareness of breast cancer screening. The report provides detailed regional breakdowns, identifying growth drivers and market dynamics for each region.
Breast Imaging Product Innovations
Recent years have witnessed a surge in product innovations within the breast imaging sector. The development of AI-powered image analysis tools significantly enhances diagnostic accuracy and reduces the workload on radiologists. Furthermore, advancements in 3D mammography and molecular breast imaging provide more detailed and precise images, leading to earlier and more accurate diagnoses. The integration of these technologies improves workflow efficiency and enhances patient outcomes.
Propelling Factors for Breast Imaging Growth
The growth of the breast imaging market is propelled by several key factors. The rising incidence of breast cancer globally is a significant driver, necessitating increased screening and diagnostic capabilities. Technological advancements, such as AI-powered image analysis and 3D mammography, improve diagnostic accuracy and efficiency, fueling market expansion. Favorable reimbursement policies and increasing healthcare expenditure further contribute to market growth.
Obstacles in the Breast Imaging Market
Despite significant growth potential, several obstacles hinder market expansion. High equipment costs and maintenance expenses represent a significant barrier to entry for smaller clinics and healthcare providers. Supply chain disruptions can impact the availability of equipment and supplies, affecting the delivery of healthcare services. Intense competition among established players also poses a challenge. Furthermore, regulatory hurdles and reimbursement policies can affect market access and adoption rates.
Future Opportunities in Breast Imaging
The breast imaging market presents numerous promising opportunities for future growth. The increasing adoption of AI-powered solutions, the development of novel imaging modalities, and the expansion into underserved markets create significant potential. Personalized medicine and the integration of breast imaging with other diagnostic tools offer further opportunities for market expansion and improved patient outcomes. Tele-radiology and remote diagnostics are also emerging as key growth drivers.
Major Players in the Breast Imaging Ecosystem
- Siemens
- Philips
- Hologic
- Perlong Medical
- ANKE
- Angell
- Sinomdt
- Macroo
- Orich Medical Equipment
- GE Healthcare
- Planmed
- Metaltronica
- TOSHIBA
- MEDI-FUTURE
- FUJIFILM
- IMS
- Genoray
Key Developments in Breast Imaging Industry
- 2022-Q4: Siemens launched a new AI-powered breast imaging solution.
- 2023-Q1: Philips announced a strategic partnership to expand its distribution network.
- 2023-Q2: Hologic acquired a smaller breast imaging company, expanding its product portfolio. (Further details on acquisitions and specific years/months will be included in the full report, as available data allows).
Strategic Breast Imaging Market Forecast
The global breast imaging market is poised for robust growth over the forecast period (2025-2033), driven by technological advancements, increasing prevalence of breast cancer, and rising healthcare expenditure. The adoption of AI-powered image analysis tools, coupled with the expansion of advanced imaging modalities, will significantly contribute to market expansion. Emerging markets present lucrative opportunities for growth, while established markets are expected to witness continuous growth fueled by ongoing technological innovations and increasing awareness of breast cancer screening.
Breast Imaging Segmentation
-
1. Application
- 1.1. General Surgery
- 1.2. Breast Surgery
- 1.3. Physical examination
-
2. Type
- 2.1. Analog Breast Imaging Equipment
- 2.2. Digital Breast Imaging Equipment
Breast Imaging Segmentation By Geography
-
1. North America
- 1.1. United States
- 1.2. Canada
- 1.3. Mexico
-
2. South America
- 2.1. Brazil
- 2.2. Argentina
- 2.3. Rest of South America
-
3. Europe
- 3.1. United Kingdom
- 3.2. Germany
- 3.3. France
- 3.4. Italy
- 3.5. Spain
- 3.6. Russia
- 3.7. Benelux
- 3.8. Nordics
- 3.9. Rest of Europe
-
4. Middle East & Africa
- 4.1. Turkey
- 4.2. Israel
- 4.3. GCC
- 4.4. North Africa
- 4.5. South Africa
- 4.6. Rest of Middle East & Africa
-
5. Asia Pacific
- 5.1. China
- 5.2. India
- 5.3. Japan
- 5.4. South Korea
- 5.5. ASEAN
- 5.6. Oceania
- 5.7. Rest of Asia Pacific
Breast Imaging Regional Market Share
Geographic Coverage of Breast Imaging
Breast Imaging REPORT HIGHLIGHTS
| Aspects | Details |
|---|---|
| Study Period | 2020-2034 |
| Base Year | 2025 |
| Estimated Year | 2026 |
| Forecast Period | 2026-2034 |
| Historical Period | 2020-2025 |
| Growth Rate | CAGR of 9.7% from 2020-2034 |
| Segmentation |
|
Table of Contents
- 1. Introduction
- 1.1. Research Scope
- 1.2. Market Segmentation
- 1.3. Research Methodology
- 1.4. Definitions and Assumptions
- 2. Executive Summary
- 2.1. Introduction
- 3. Market Dynamics
- 3.1. Introduction
- 3.2. Market Drivers
- 3.3. Market Restrains
- 3.4. Market Trends
- 4. Market Factor Analysis
- 4.1. Porters Five Forces
- 4.2. Supply/Value Chain
- 4.3. PESTEL analysis
- 4.4. Market Entropy
- 4.5. Patent/Trademark Analysis
- 5. Global Breast Imaging Analysis, Insights and Forecast, 2020-2032
- 5.1. Market Analysis, Insights and Forecast - by Application
- 5.1.1. General Surgery
- 5.1.2. Breast Surgery
- 5.1.3. Physical examination
- 5.2. Market Analysis, Insights and Forecast - by Type
- 5.2.1. Analog Breast Imaging Equipment
- 5.2.2. Digital Breast Imaging Equipment
- 5.3. Market Analysis, Insights and Forecast - by Region
- 5.3.1. North America
- 5.3.2. South America
- 5.3.3. Europe
- 5.3.4. Middle East & Africa
- 5.3.5. Asia Pacific
- 5.1. Market Analysis, Insights and Forecast - by Application
- 6. North America Breast Imaging Analysis, Insights and Forecast, 2020-2032
- 6.1. Market Analysis, Insights and Forecast - by Application
- 6.1.1. General Surgery
- 6.1.2. Breast Surgery
- 6.1.3. Physical examination
- 6.2. Market Analysis, Insights and Forecast - by Type
- 6.2.1. Analog Breast Imaging Equipment
- 6.2.2. Digital Breast Imaging Equipment
- 6.1. Market Analysis, Insights and Forecast - by Application
- 7. South America Breast Imaging Analysis, Insights and Forecast, 2020-2032
- 7.1. Market Analysis, Insights and Forecast - by Application
- 7.1.1. General Surgery
- 7.1.2. Breast Surgery
- 7.1.3. Physical examination
- 7.2. Market Analysis, Insights and Forecast - by Type
- 7.2.1. Analog Breast Imaging Equipment
- 7.2.2. Digital Breast Imaging Equipment
- 7.1. Market Analysis, Insights and Forecast - by Application
- 8. Europe Breast Imaging Analysis, Insights and Forecast, 2020-2032
- 8.1. Market Analysis, Insights and Forecast - by Application
- 8.1.1. General Surgery
- 8.1.2. Breast Surgery
- 8.1.3. Physical examination
- 8.2. Market Analysis, Insights and Forecast - by Type
- 8.2.1. Analog Breast Imaging Equipment
- 8.2.2. Digital Breast Imaging Equipment
- 8.1. Market Analysis, Insights and Forecast - by Application
- 9. Middle East & Africa Breast Imaging Analysis, Insights and Forecast, 2020-2032
- 9.1. Market Analysis, Insights and Forecast - by Application
- 9.1.1. General Surgery
- 9.1.2. Breast Surgery
- 9.1.3. Physical examination
- 9.2. Market Analysis, Insights and Forecast - by Type
- 9.2.1. Analog Breast Imaging Equipment
- 9.2.2. Digital Breast Imaging Equipment
- 9.1. Market Analysis, Insights and Forecast - by Application
- 10. Asia Pacific Breast Imaging Analysis, Insights and Forecast, 2020-2032
- 10.1. Market Analysis, Insights and Forecast - by Application
- 10.1.1. General Surgery
- 10.1.2. Breast Surgery
- 10.1.3. Physical examination
- 10.2. Market Analysis, Insights and Forecast - by Type
- 10.2.1. Analog Breast Imaging Equipment
- 10.2.2. Digital Breast Imaging Equipment
- 10.1. Market Analysis, Insights and Forecast - by Application
- 11. Competitive Analysis
- 11.1. Global Market Share Analysis 2025
- 11.2. Company Profiles
- 11.2.1 Siemens
- 11.2.1.1. Overview
- 11.2.1.2. Products
- 11.2.1.3. SWOT Analysis
- 11.2.1.4. Recent Developments
- 11.2.1.5. Financials (Based on Availability)
- 11.2.2 Philips
- 11.2.2.1. Overview
- 11.2.2.2. Products
- 11.2.2.3. SWOT Analysis
- 11.2.2.4. Recent Developments
- 11.2.2.5. Financials (Based on Availability)
- 11.2.3 Hologic
- 11.2.3.1. Overview
- 11.2.3.2. Products
- 11.2.3.3. SWOT Analysis
- 11.2.3.4. Recent Developments
- 11.2.3.5. Financials (Based on Availability)
- 11.2.4 Perlong Medical
- 11.2.4.1. Overview
- 11.2.4.2. Products
- 11.2.4.3. SWOT Analysis
- 11.2.4.4. Recent Developments
- 11.2.4.5. Financials (Based on Availability)
- 11.2.5 ANKE
- 11.2.5.1. Overview
- 11.2.5.2. Products
- 11.2.5.3. SWOT Analysis
- 11.2.5.4. Recent Developments
- 11.2.5.5. Financials (Based on Availability)
- 11.2.6 Angell
- 11.2.6.1. Overview
- 11.2.6.2. Products
- 11.2.6.3. SWOT Analysis
- 11.2.6.4. Recent Developments
- 11.2.6.5. Financials (Based on Availability)
- 11.2.7 Sinomdt
- 11.2.7.1. Overview
- 11.2.7.2. Products
- 11.2.7.3. SWOT Analysis
- 11.2.7.4. Recent Developments
- 11.2.7.5. Financials (Based on Availability)
- 11.2.8 Macroo
- 11.2.8.1. Overview
- 11.2.8.2. Products
- 11.2.8.3. SWOT Analysis
- 11.2.8.4. Recent Developments
- 11.2.8.5. Financials (Based on Availability)
- 11.2.9 Orich Medical Equipment
- 11.2.9.1. Overview
- 11.2.9.2. Products
- 11.2.9.3. SWOT Analysis
- 11.2.9.4. Recent Developments
- 11.2.9.5. Financials (Based on Availability)
- 11.2.10 GE Healthcare
- 11.2.10.1. Overview
- 11.2.10.2. Products
- 11.2.10.3. SWOT Analysis
- 11.2.10.4. Recent Developments
- 11.2.10.5. Financials (Based on Availability)
- 11.2.11 Planmed
- 11.2.11.1. Overview
- 11.2.11.2. Products
- 11.2.11.3. SWOT Analysis
- 11.2.11.4. Recent Developments
- 11.2.11.5. Financials (Based on Availability)
- 11.2.12 Metaltronica
- 11.2.12.1. Overview
- 11.2.12.2. Products
- 11.2.12.3. SWOT Analysis
- 11.2.12.4. Recent Developments
- 11.2.12.5. Financials (Based on Availability)
- 11.2.13 TOSHIBA
- 11.2.13.1. Overview
- 11.2.13.2. Products
- 11.2.13.3. SWOT Analysis
- 11.2.13.4. Recent Developments
- 11.2.13.5. Financials (Based on Availability)
- 11.2.14 MEDI-FUTURE
- 11.2.14.1. Overview
- 11.2.14.2. Products
- 11.2.14.3. SWOT Analysis
- 11.2.14.4. Recent Developments
- 11.2.14.5. Financials (Based on Availability)
- 11.2.15 FUJIFILM
- 11.2.15.1. Overview
- 11.2.15.2. Products
- 11.2.15.3. SWOT Analysis
- 11.2.15.4. Recent Developments
- 11.2.15.5. Financials (Based on Availability)
- 11.2.16 IMS
- 11.2.16.1. Overview
- 11.2.16.2. Products
- 11.2.16.3. SWOT Analysis
- 11.2.16.4. Recent Developments
- 11.2.16.5. Financials (Based on Availability)
- 11.2.17 Genoray
- 11.2.17.1. Overview
- 11.2.17.2. Products
- 11.2.17.3. SWOT Analysis
- 11.2.17.4. Recent Developments
- 11.2.17.5. Financials (Based on Availability)
- 11.2.1 Siemens
List of Figures
- Figure 1: Global Breast Imaging Revenue Breakdown (billion, %) by Region 2025 & 2033
- Figure 2: North America Breast Imaging Revenue (billion), by Application 2025 & 2033
- Figure 3: North America Breast Imaging Revenue Share (%), by Application 2025 & 2033
- Figure 4: North America Breast Imaging Revenue (billion), by Type 2025 & 2033
- Figure 5: North America Breast Imaging Revenue Share (%), by Type 2025 & 2033
- Figure 6: North America Breast Imaging Revenue (billion), by Country 2025 & 2033
- Figure 7: North America Breast Imaging Revenue Share (%), by Country 2025 & 2033
- Figure 8: South America Breast Imaging Revenue (billion), by Application 2025 & 2033
- Figure 9: South America Breast Imaging Revenue Share (%), by Application 2025 & 2033
- Figure 10: South America Breast Imaging Revenue (billion), by Type 2025 & 2033
- Figure 11: South America Breast Imaging Revenue Share (%), by Type 2025 & 2033
- Figure 12: South America Breast Imaging Revenue (billion), by Country 2025 & 2033
- Figure 13: South America Breast Imaging Revenue Share (%), by Country 2025 & 2033
- Figure 14: Europe Breast Imaging Revenue (billion), by Application 2025 & 2033
- Figure 15: Europe Breast Imaging Revenue Share (%), by Application 2025 & 2033
- Figure 16: Europe Breast Imaging Revenue (billion), by Type 2025 & 2033
- Figure 17: Europe Breast Imaging Revenue Share (%), by Type 2025 & 2033
- Figure 18: Europe Breast Imaging Revenue (billion), by Country 2025 & 2033
- Figure 19: Europe Breast Imaging Revenue Share (%), by Country 2025 & 2033
- Figure 20: Middle East & Africa Breast Imaging Revenue (billion), by Application 2025 & 2033
- Figure 21: Middle East & Africa Breast Imaging Revenue Share (%), by Application 2025 & 2033
- Figure 22: Middle East & Africa Breast Imaging Revenue (billion), by Type 2025 & 2033
- Figure 23: Middle East & Africa Breast Imaging Revenue Share (%), by Type 2025 & 2033
- Figure 24: Middle East & Africa Breast Imaging Revenue (billion), by Country 2025 & 2033
- Figure 25: Middle East & Africa Breast Imaging Revenue Share (%), by Country 2025 & 2033
- Figure 26: Asia Pacific Breast Imaging Revenue (billion), by Application 2025 & 2033
- Figure 27: Asia Pacific Breast Imaging Revenue Share (%), by Application 2025 & 2033
- Figure 28: Asia Pacific Breast Imaging Revenue (billion), by Type 2025 & 2033
- Figure 29: Asia Pacific Breast Imaging Revenue Share (%), by Type 2025 & 2033
- Figure 30: Asia Pacific Breast Imaging Revenue (billion), by Country 2025 & 2033
- Figure 31: Asia Pacific Breast Imaging Revenue Share (%), by Country 2025 & 2033
List of Tables
- Table 1: Global Breast Imaging Revenue billion Forecast, by Application 2020 & 2033
- Table 2: Global Breast Imaging Revenue billion Forecast, by Type 2020 & 2033
- Table 3: Global Breast Imaging Revenue billion Forecast, by Region 2020 & 2033
- Table 4: Global Breast Imaging Revenue billion Forecast, by Application 2020 & 2033
- Table 5: Global Breast Imaging Revenue billion Forecast, by Type 2020 & 2033
- Table 6: Global Breast Imaging Revenue billion Forecast, by Country 2020 & 2033
- Table 7: United States Breast Imaging Revenue (billion) Forecast, by Application 2020 & 2033
- Table 8: Canada Breast Imaging Revenue (billion) Forecast, by Application 2020 & 2033
- Table 9: Mexico Breast Imaging Revenue (billion) Forecast, by Application 2020 & 2033
- Table 10: Global Breast Imaging Revenue billion Forecast, by Application 2020 & 2033
- Table 11: Global Breast Imaging Revenue billion Forecast, by Type 2020 & 2033
- Table 12: Global Breast Imaging Revenue billion Forecast, by Country 2020 & 2033
- Table 13: Brazil Breast Imaging Revenue (billion) Forecast, by Application 2020 & 2033
- Table 14: Argentina Breast Imaging Revenue (billion) Forecast, by Application 2020 & 2033
- Table 15: Rest of South America Breast Imaging Revenue (billion) Forecast, by Application 2020 & 2033
- Table 16: Global Breast Imaging Revenue billion Forecast, by Application 2020 & 2033
- Table 17: Global Breast Imaging Revenue billion Forecast, by Type 2020 & 2033
- Table 18: Global Breast Imaging Revenue billion Forecast, by Country 2020 & 2033
- Table 19: United Kingdom Breast Imaging Revenue (billion) Forecast, by Application 2020 & 2033
- Table 20: Germany Breast Imaging Revenue (billion) Forecast, by Application 2020 & 2033
- Table 21: France Breast Imaging Revenue (billion) Forecast, by Application 2020 & 2033
- Table 22: Italy Breast Imaging Revenue (billion) Forecast, by Application 2020 & 2033
- Table 23: Spain Breast Imaging Revenue (billion) Forecast, by Application 2020 & 2033
- Table 24: Russia Breast Imaging Revenue (billion) Forecast, by Application 2020 & 2033
- Table 25: Benelux Breast Imaging Revenue (billion) Forecast, by Application 2020 & 2033
- Table 26: Nordics Breast Imaging Revenue (billion) Forecast, by Application 2020 & 2033
- Table 27: Rest of Europe Breast Imaging Revenue (billion) Forecast, by Application 2020 & 2033
- Table 28: Global Breast Imaging Revenue billion Forecast, by Application 2020 & 2033
- Table 29: Global Breast Imaging Revenue billion Forecast, by Type 2020 & 2033
- Table 30: Global Breast Imaging Revenue billion Forecast, by Country 2020 & 2033
- Table 31: Turkey Breast Imaging Revenue (billion) Forecast, by Application 2020 & 2033
- Table 32: Israel Breast Imaging Revenue (billion) Forecast, by Application 2020 & 2033
- Table 33: GCC Breast Imaging Revenue (billion) Forecast, by Application 2020 & 2033
- Table 34: North Africa Breast Imaging Revenue (billion) Forecast, by Application 2020 & 2033
- Table 35: South Africa Breast Imaging Revenue (billion) Forecast, by Application 2020 & 2033
- Table 36: Rest of Middle East & Africa Breast Imaging Revenue (billion) Forecast, by Application 2020 & 2033
- Table 37: Global Breast Imaging Revenue billion Forecast, by Application 2020 & 2033
- Table 38: Global Breast Imaging Revenue billion Forecast, by Type 2020 & 2033
- Table 39: Global Breast Imaging Revenue billion Forecast, by Country 2020 & 2033
- Table 40: China Breast Imaging Revenue (billion) Forecast, by Application 2020 & 2033
- Table 41: India Breast Imaging Revenue (billion) Forecast, by Application 2020 & 2033
- Table 42: Japan Breast Imaging Revenue (billion) Forecast, by Application 2020 & 2033
- Table 43: South Korea Breast Imaging Revenue (billion) Forecast, by Application 2020 & 2033
- Table 44: ASEAN Breast Imaging Revenue (billion) Forecast, by Application 2020 & 2033
- Table 45: Oceania Breast Imaging Revenue (billion) Forecast, by Application 2020 & 2033
- Table 46: Rest of Asia Pacific Breast Imaging Revenue (billion) Forecast, by Application 2020 & 2033
Frequently Asked Questions
1. What is the projected Compound Annual Growth Rate (CAGR) of the Breast Imaging?
The projected CAGR is approximately 9.7%.
2. Which companies are prominent players in the Breast Imaging?
Key companies in the market include Siemens, Philips, Hologic, Perlong Medical, ANKE, Angell, Sinomdt, Macroo, Orich Medical Equipment, GE Healthcare, Planmed, Metaltronica, TOSHIBA, MEDI-FUTURE, FUJIFILM, IMS, Genoray.
3. What are the main segments of the Breast Imaging?
The market segments include Application, Type.
4. Can you provide details about the market size?
The market size is estimated to be USD 5.88 billion as of 2022.
5. What are some drivers contributing to market growth?
N/A
6. What are the notable trends driving market growth?
N/A
7. Are there any restraints impacting market growth?
N/A
8. Can you provide examples of recent developments in the market?
N/A
9. What pricing options are available for accessing the report?
Pricing options include single-user, multi-user, and enterprise licenses priced at USD 5900.00, USD 8850.00, and USD 11800.00 respectively.
10. Is the market size provided in terms of value or volume?
The market size is provided in terms of value, measured in billion.
11. Are there any specific market keywords associated with the report?
Yes, the market keyword associated with the report is "Breast Imaging," which aids in identifying and referencing the specific market segment covered.
12. How do I determine which pricing option suits my needs best?
The pricing options vary based on user requirements and access needs. Individual users may opt for single-user licenses, while businesses requiring broader access may choose multi-user or enterprise licenses for cost-effective access to the report.
13. Are there any additional resources or data provided in the Breast Imaging report?
While the report offers comprehensive insights, it's advisable to review the specific contents or supplementary materials provided to ascertain if additional resources or data are available.
14. How can I stay updated on further developments or reports in the Breast Imaging?
To stay informed about further developments, trends, and reports in the Breast Imaging, consider subscribing to industry newsletters, following relevant companies and organizations, or regularly checking reputable industry news sources and publications.
Methodology
Step 1 - Identification of Relevant Samples Size from Population Database


Step 2 - Approaches for Defining Global Market Size (Value, Volume* & Price*)

Note*: In applicable scenarios
Step 3 - Data Sources
Primary Research
- Web Analytics
- Survey Reports
- Research Institute
- Latest Research Reports
- Opinion Leaders
Secondary Research
- Annual Reports
- White Paper
- Latest Press Release
- Industry Association
- Paid Database
- Investor Presentations

Step 4 - Data Triangulation
Involves using different sources of information in order to increase the validity of a study
These sources are likely to be stakeholders in a program - participants, other researchers, program staff, other community members, and so on.
Then we put all data in single framework & apply various statistical tools to find out the dynamic on the market.
During the analysis stage, feedback from the stakeholder groups would be compared to determine areas of agreement as well as areas of divergence