

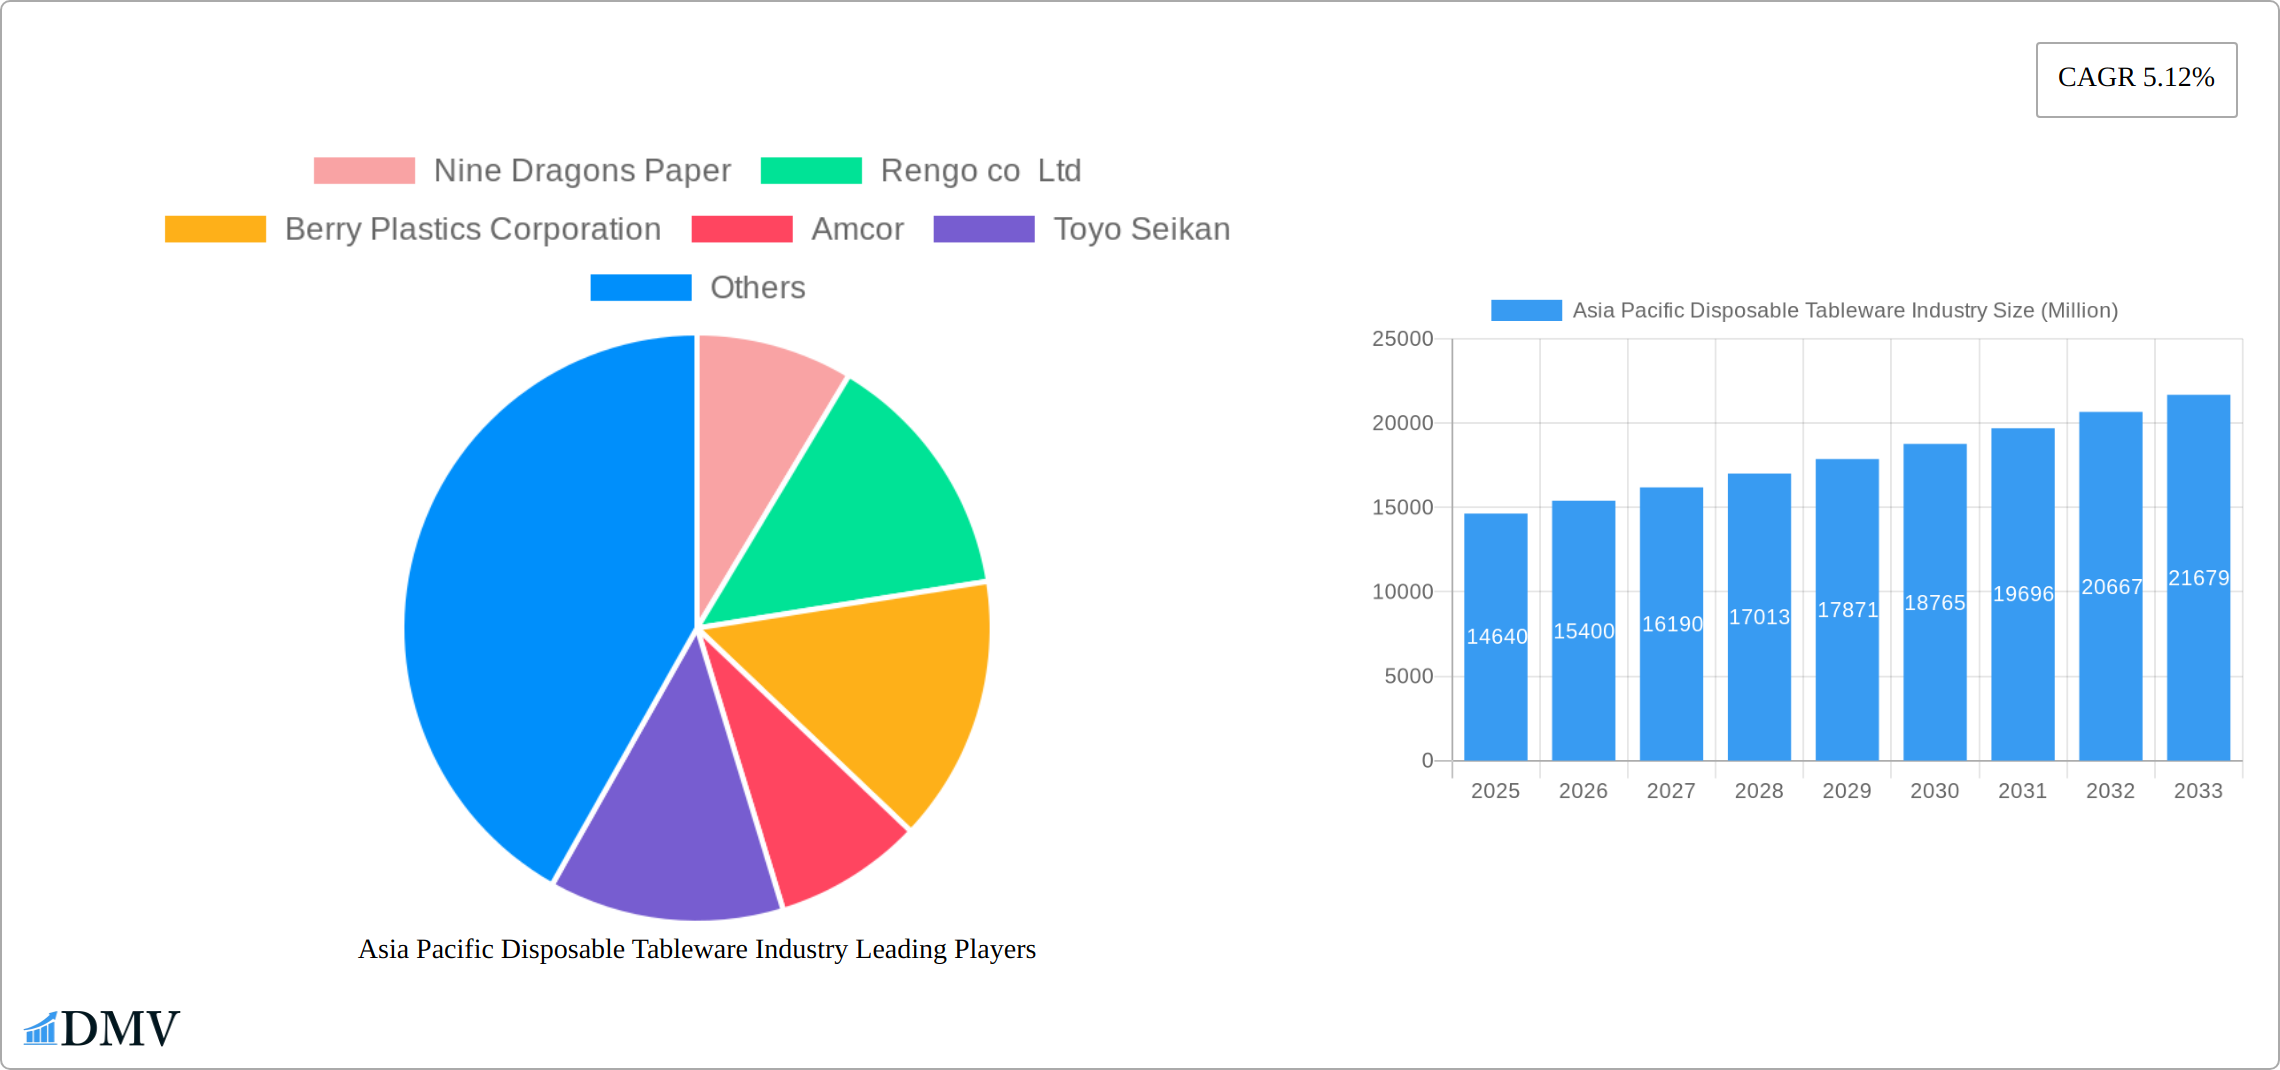
Key Insights
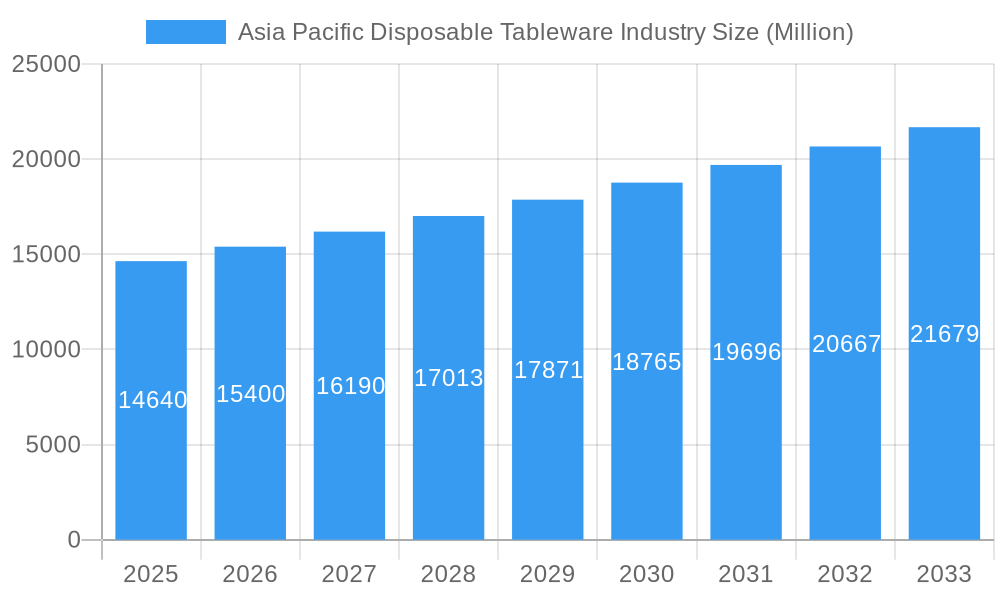
The Asia-Pacific disposable tableware market, valued at $14.64 billion in 2025, is projected to experience robust growth, driven by several key factors. The rising popularity of convenient and hygienic single-use products, particularly in burgeoning economies like India and China, fuels significant demand. The expanding food delivery and takeaway sectors further contribute to this growth, as disposable tableware becomes essential for maintaining food safety and convenience. A shift towards eco-friendly and biodegradable options is also emerging as a significant trend, although the dominance of conventional plastic remains substantial. Growth is segmented across product types (cups, plates, bowls, cutlery), applications (residential, commercial), and distribution channels (hypermarkets, convenience stores, online retailers). While the market faces challenges like environmental concerns and fluctuating raw material prices, the overall positive growth trajectory is expected to continue throughout the forecast period (2025-2033). Competitive pressures among established players like Nine Dragons Paper, Rengo Co., Ltd., and Amcor, alongside the emergence of regional manufacturers, will shape the market landscape. Innovation in sustainable materials and packaging solutions will be critical for companies seeking to maintain a competitive edge.
Asia Pacific Disposable Tableware Industry Market Size (In Billion)
The projected Compound Annual Growth Rate (CAGR) of 5.12% indicates a steady expansion, with specific regional contributions varying based on economic development and consumer preferences. China and India, with their large and rapidly growing populations, are expected to be significant drivers of market expansion. However, regulatory changes concerning plastic waste management and environmental awareness could influence the growth trajectory, potentially favoring companies offering eco-friendly alternatives. The increasing preference for online grocery shopping and food delivery services will also contribute to the growth of the online distribution channel. Therefore, companies need to adapt their strategies to meet changing consumer demands and comply with evolving environmental regulations to secure long-term success in this dynamic market.
Asia Pacific Disposable Tableware Industry Company Market Share
Asia Pacific Disposable Tableware Industry Market Composition & Trends
The Asia Pacific disposable tableware market is dynamic and diverse, characterized by moderate market concentration. Key players like Nine Dragons Paper and Amcor hold significant shares, collectively accounting for approximately 30% of the market. However, a fragmented landscape provides opportunities for smaller, specialized companies. Driving innovation are several key factors: the surging demand for eco-friendly options fuels the development of sustainable materials such as biodegradable plastics and recycled paper; evolving regulatory landscapes, particularly in Japan and South Korea, with stricter waste management policies, are influencing product design and material selection; and the competitive pressure from substitute products like reusable tableware necessitates continuous innovation and cost optimization.
Despite the challenges posed by reusable alternatives, the inherent convenience of disposable tableware remains a primary driver of demand across residential and commercial sectors. High-growth markets such as China and India, characterized by rapid urbanization and fast-paced lifestyles, exhibit particularly strong demand. The market's dynamism is also reflected in robust M&A activity, with deal values exceeding $1 billion in the last five years, primarily driven by companies seeking to expand their product portfolios and geographic reach. This consolidation trend is likely to continue as larger players seek to gain market share and leverage economies of scale.
- Market Share Distribution: A moderately concentrated market with Nine Dragons Paper and Amcor holding a combined share of approximately 30%, alongside a significant number of smaller players.
- Innovation Catalysts: Strong consumer preference for eco-friendly products, coupled with increasingly stringent environmental regulations, accelerates innovation in sustainable materials and manufacturing processes.
- Regulatory Landscape: Japan and South Korea, among other nations, are implementing stricter waste management policies, significantly influencing product development and disposal strategies.
- Substitute Products: The growing popularity of reusable tableware presents a competitive challenge, necessitating differentiation through convenience, affordability, and sustainability.
- End-User Profiles: High demand in rapidly urbanizing areas of China and India, driven by convenience and the growth of the food service industry.
- M&A Activities: Significant merger and acquisition activity, with deal values exceeding $1 billion in the past five years, reflecting industry consolidation and expansion efforts.
Asia Pacific Disposable Tableware Industry Industry Evolution
The Asia Pacific Disposable Tableware Industry has witnessed significant evolution over the study period of 2019-2033. Market growth trajectories have been robust, with an estimated Compound Annual Growth Rate (CAGR) of 5% from 2025 to 2033, driven by increasing urbanization and changing lifestyles. Technological advancements have played a pivotal role, with companies like Berry Plastics Corporation and Rengo Co Ltd investing in new manufacturing techniques to enhance product quality and reduce costs. For instance, Berry Plastics has introduced advanced thermoforming technologies that have improved the durability and aesthetic appeal of disposable cups and plates.
Shifting consumer demands are also influencing market dynamics. There is a growing preference for aesthetically pleasing and functional disposable tableware, particularly in the commercial sector, where businesses seek to enhance customer experience. Adoption metrics indicate a 10% increase in the use of disposable tableware in restaurants and cafes across the region since 2019. Additionally, the rise of e-commerce has transformed distribution channels, with online sales of disposable tableware growing by 15% annually.
The industry's evolution is further shaped by sustainability initiatives, with companies like Nippon Paper and Oji Holdings leading the charge in developing eco-friendly products. These efforts are not only responding to regulatory pressures but also aligning with consumer preferences for environmentally responsible products. As the industry continues to evolve, the focus on innovation and sustainability will remain critical for long-term growth and competitiveness.
Leading Regions, Countries, or Segments in Asia Pacific Disposable Tableware Industry
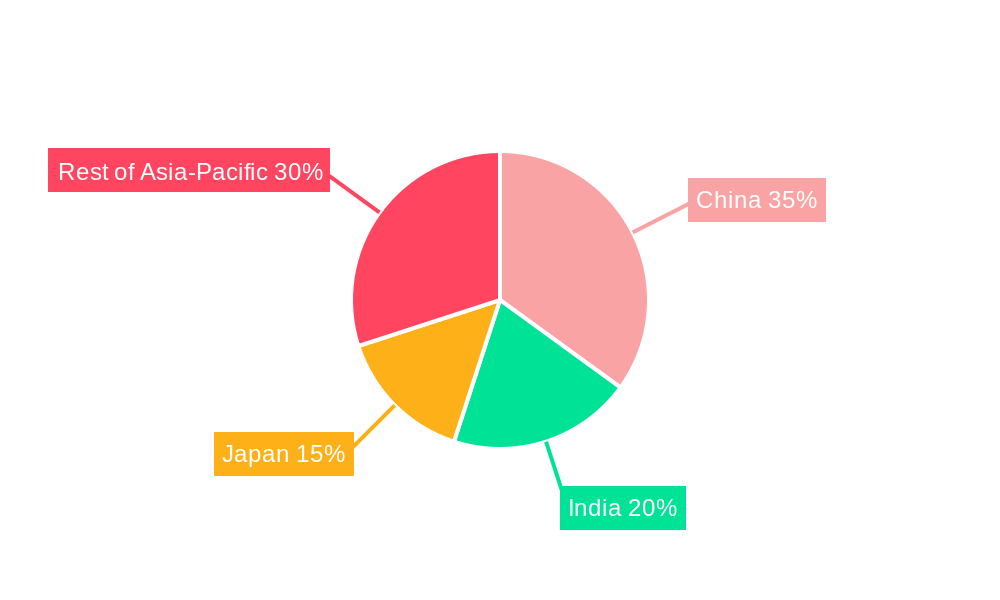
In the Asia Pacific Disposable Tableware Industry, certain regions, countries, and segments stand out as leaders. China emerges as the dominant market, driven by its large population, rapid urbanization, and a burgeoning food service industry. The country's disposable tableware market is projected to grow at a CAGR of 6% from 2025 to 2033, fueled by increasing demand in both residential and commercial sectors.
- Key Drivers in China:
- Investment Trends: Significant investments in manufacturing infrastructure.
- Regulatory Support: Government initiatives promoting sustainable practices.
India is another key player, with a focus on disposable cups and plates, which account for over 40% of the market. The growth is propelled by the expanding middle class and the rise of quick-service restaurants.
- Key Drivers in India:
- Investment Trends: Growing investments in the FMCG sector.
- Regulatory Support: Encouragement of eco-friendly products.
In terms of product segments, disposable cups lead the market, driven by their widespread use in both residential and commercial settings. The segment is expected to grow at a CAGR of 5.5% during the forecast period.
- Key Drivers for Disposable Cups:
- Investment Trends: Innovations in material and design.
- Regulatory Support: Focus on reducing plastic use.
The commercial application segment is also significant, with a projected growth rate of 5.2% from 2025 to 2033. This is largely due to the expansion of the hospitality industry and the increasing number of events and catering services.
- Key Drivers for Commercial Application:
- Investment Trends: Expansion of the hospitality sector.
- Regulatory Support: Emphasis on hygiene and safety standards.
Online distribution channels are gaining traction, with a projected CAGR of 7% over the forecast period. The convenience and variety offered by online platforms are key factors driving this growth.
- Key Drivers for Online Distribution:
- Investment Trends: Increased investment in e-commerce infrastructure.
- Regulatory Support: Supportive policies for digital commerce.
Asia Pacific Disposable Tableware Industry Product Innovations
Product innovations in the Asia Pacific Disposable Tableware Industry are focused on enhancing sustainability and functionality. Companies like Mondi Group have introduced biodegradable cups made from plant-based materials, offering a unique selling proposition in terms of environmental impact. Technological advancements, such as the use of advanced printing techniques, allow for customizable designs that cater to both residential and commercial needs. Performance metrics indicate a 20% increase in consumer preference for eco-friendly disposable tableware over the past three years, highlighting the success of these innovations.
Propelling Factors for Asia Pacific Disposable Tableware Industry Growth
The growth of the Asia Pacific Disposable Tableware Industry is propelled by several key factors. Technological advancements, such as the development of biodegradable materials, are driving innovation and meeting consumer demand for sustainable products. Economically, the rise of the middle class in countries like China and India is increasing disposable income, leading to higher consumption of disposable tableware. Regulatory influences, such as government initiatives promoting eco-friendly products, are also significant. For example, Japan's commitment to reducing plastic waste has spurred the adoption of paper-based alternatives.
Obstacles in the Asia Pacific Disposable Tableware Industry Market
The Asia Pacific Disposable Tableware Industry faces several obstacles that could impede growth. Regulatory challenges, such as stringent environmental regulations, increase the cost of compliance for manufacturers. Supply chain disruptions, particularly those caused by global events like pandemics, have led to production delays and increased costs, with a 10% rise in production expenses reported in 2021. Competitive pressures are intense, with companies like Nine Dragons Paper and Amcor vying for market share, leading to price wars that can erode profit margins.
Future Opportunities in Asia Pacific Disposable Tableware Industry
Emerging opportunities in the Asia Pacific Disposable Tableware Industry include the expansion into new markets like Southeast Asia, where urbanization is rapidly increasing. Technological advancements in biodegradable materials offer the potential for new product lines. Consumer trends towards sustainability and convenience are driving demand for innovative disposable tableware solutions. Additionally, the growth of e-commerce provides a platform for reaching a broader audience and increasing sales through online channels.
Major Players in the Asia Pacific Disposable Tableware Industry Ecosystem
Key Developments in Asia Pacific Disposable Tableware Industry Industry
- February 2022: Nippon Paper Industries collaborated with Elopak Paper Industries to collectively put efforts in the field of Liquid-Paper Packaging and to expand the market size in the Asia-Pacific region. This partnership aims to leverage combined expertise to develop innovative packaging solutions, enhancing market dynamics and product offerings.
- September 2021: Oji Holding Corporation acquired a majority 80% shares in Punjab-based Empire Packages Private Limited, which provides services to several Fortune 500 companies and large FMCG companies in North India. This acquisition is expected to significantly expand Oji Holdings' market share in countries like India, Bangladesh, and Nepal, strengthening its position in the region.
Strategic Asia Pacific Disposable Tableware Industry Market Forecast
The strategic forecast for the Asia Pacific Disposable Tableware Industry indicates robust growth potential, driven by increasing urbanization and the rising demand for convenience products. Future opportunities lie in the development of sustainable and innovative disposable tableware solutions, which align with consumer trends towards eco-friendly products. The market is expected to see a continued shift towards online distribution channels, offering new avenues for growth. With a projected CAGR of 5% from 2025 to 2033, the industry is poised for significant expansion, particularly in emerging markets like Southeast Asia.
Asia Pacific Disposable Tableware Industry Segmentation
- 1. Production Analysis
- 2. Consumption Analysis
- 3. Import Market Analysis (Value & Volume)
- 4. Export Market Analysis (Value & Volume)
- 5. Price Trend Analysis
Asia Pacific Disposable Tableware Industry Segmentation By Geography
-
1. Asia Pacific
- 1.1. China
- 1.2. Japan
- 1.3. South Korea
- 1.4. India
- 1.5. Australia
- 1.6. New Zealand
- 1.7. Indonesia
- 1.8. Malaysia
- 1.9. Singapore
- 1.10. Thailand
- 1.11. Vietnam
- 1.12. Philippines
Asia Pacific Disposable Tableware Industry Regional Market Share
Geographic Coverage of Asia Pacific Disposable Tableware Industry
Asia Pacific Disposable Tableware Industry REPORT HIGHLIGHTS
| Aspects | Details |
|---|---|
| Study Period | 2020-2034 |
| Base Year | 2025 |
| Estimated Year | 2026 |
| Forecast Period | 2026-2034 |
| Historical Period | 2020-2025 |
| Growth Rate | CAGR of 5.12% from 2020-2034 |
| Segmentation |
|
Table of Contents
- 1. Introduction
- 1.1. Research Scope
- 1.2. Market Segmentation
- 1.3. Research Objective
- 1.4. Definitions and Assumptions
- 2. Executive Summary
- 2.1. Market Snapshot
- 3. Market Dynamics
- 3.1. Market Drivers
- 3.2. Market Restrains
- 3.3. Market Trends
- 3.4. Market Opportunities
- 4. Market Factor Analysis
- 4.1. Porters Five Forces
- 4.1.1. Bargaining Power of Suppliers
- 4.1.2. Bargaining Power of Buyers
- 4.1.3. Threat of New Entrants
- 4.1.4. Threat of Substitutes
- 4.1.5. Competitive Rivalry
- 4.2. PESTEL analysis
- 4.3. BCG Analysis
- 4.3.1. Stars (High Growth, High Market Share)
- 4.3.2. Cash Cows (Low Growth, High Market Share)
- 4.3.3. Question Mark (High Growth, Low Market Share)
- 4.3.4. Dogs (Low Growth, Low Market Share)
- 4.4. Ansoff Matrix Analysis
- 4.5. Supply Chain Analysis
- 4.6. Regulatory Landscape
- 4.7. Current Market Potential and Opportunity Assessment (TAM–SAM–SOM Framework)
- 4.8. DMV Analyst Note
- 4.1. Porters Five Forces
- 5. Market Analysis, Insights and Forecast 2021-2033
- 5.1. Market Analysis, Insights and Forecast - by Production Analysis
- 5.2. Market Analysis, Insights and Forecast - by Consumption Analysis
- 5.3. Market Analysis, Insights and Forecast - by Import Market Analysis (Value & Volume)
- 5.4. Market Analysis, Insights and Forecast - by Export Market Analysis (Value & Volume)
- 5.5. Market Analysis, Insights and Forecast - by Price Trend Analysis
- 5.6. Market Analysis, Insights and Forecast - by Region
- 5.6.1. Asia Pacific
- 6. Asia Pacific Disposable Tableware Industry Analysis, Insights and Forecast, 2021-2033
- 6.1. Market Analysis, Insights and Forecast - by Production Analysis
- 6.2. Market Analysis, Insights and Forecast - by Consumption Analysis
- 6.3. Market Analysis, Insights and Forecast - by Import Market Analysis (Value & Volume)
- 6.4. Market Analysis, Insights and Forecast - by Export Market Analysis (Value & Volume)
- 6.5. Market Analysis, Insights and Forecast - by Price Trend Analysis
- 7. Competitive Analysis
- 7.1. Company Profiles
- 7.1.1 Nine Dragons Paper
- 7.1.1.1. Company Overview
- 7.1.1.2. Products
- 7.1.1.3. Company Financials
- 7.1.1.4. SWOT Analysis
- 7.1.2 Rengo co Ltd
- 7.1.2.1. Company Overview
- 7.1.2.2. Products
- 7.1.2.3. Company Financials
- 7.1.2.4. SWOT Analysis
- 7.1.3 Berry Plastics Corporation
- 7.1.3.1. Company Overview
- 7.1.3.2. Products
- 7.1.3.3. Company Financials
- 7.1.3.4. SWOT Analysis
- 7.1.4 Amcor
- 7.1.4.1. Company Overview
- 7.1.4.2. Products
- 7.1.4.3. Company Financials
- 7.1.4.4. SWOT Analysis
- 7.1.5 Toyo Seikan
- 7.1.5.1. Company Overview
- 7.1.5.2. Products
- 7.1.5.3. Company Financials
- 7.1.5.4. SWOT Analysis
- 7.1.6 Nippon Paper
- 7.1.6.1. Company Overview
- 7.1.6.2. Products
- 7.1.6.3. Company Financials
- 7.1.6.4. SWOT Analysis
- 7.1.7 Mondi Group
- 7.1.7.1. Company Overview
- 7.1.7.2. Products
- 7.1.7.3. Company Financials
- 7.1.7.4. SWOT Analysis
- 7.1.8 Guangdong Huasheng Meto
- 7.1.8.1. Company Overview
- 7.1.8.2. Products
- 7.1.8.3. Company Financials
- 7.1.8.4. SWOT Analysis
- 7.1.9 Oji Holdings
- 7.1.9.1. Company Overview
- 7.1.9.2. Products
- 7.1.9.3. Company Financials
- 7.1.9.4. SWOT Analysis
- 7.1.10 Sonoco Products**List Not Exhaustive
- 7.1.10.1. Company Overview
- 7.1.10.2. Products
- 7.1.10.3. Company Financials
- 7.1.10.4. SWOT Analysis
- 7.1.11 Taizhou Fuling Plastics
- 7.1.11.1. Company Overview
- 7.1.11.2. Products
- 7.1.11.3. Company Financials
- 7.1.11.4. SWOT Analysis
- 7.1.1 Nine Dragons Paper
- 7.2. Market Entropy
- 7.2.1 Company's Key Areas Served
- 7.2.2 Recent Developments
- 7.3. Company Market Share Analysis 2025
- 7.3.1 Top 5 Companies Market Share Analysis
- 7.3.2 Top 3 Companies Market Share Analysis
- 7.4. List of Potential Customers
- 8. Research Methodology
List of Figures
- Figure 1: Asia Pacific Disposable Tableware Industry Revenue Breakdown (Million, %) by Product 2025 & 2033
- Figure 2: Asia Pacific Disposable Tableware Industry Share (%) by Company 2025
List of Tables
- Table 1: Asia Pacific Disposable Tableware Industry Revenue Million Forecast, by Production Analysis 2020 & 2033
- Table 2: Asia Pacific Disposable Tableware Industry Revenue Million Forecast, by Consumption Analysis 2020 & 2033
- Table 3: Asia Pacific Disposable Tableware Industry Revenue Million Forecast, by Import Market Analysis (Value & Volume) 2020 & 2033
- Table 4: Asia Pacific Disposable Tableware Industry Revenue Million Forecast, by Export Market Analysis (Value & Volume) 2020 & 2033
- Table 5: Asia Pacific Disposable Tableware Industry Revenue Million Forecast, by Price Trend Analysis 2020 & 2033
- Table 6: Asia Pacific Disposable Tableware Industry Revenue Million Forecast, by Region 2020 & 2033
- Table 7: Asia Pacific Disposable Tableware Industry Revenue Million Forecast, by Production Analysis 2020 & 2033
- Table 8: Asia Pacific Disposable Tableware Industry Revenue Million Forecast, by Consumption Analysis 2020 & 2033
- Table 9: Asia Pacific Disposable Tableware Industry Revenue Million Forecast, by Import Market Analysis (Value & Volume) 2020 & 2033
- Table 10: Asia Pacific Disposable Tableware Industry Revenue Million Forecast, by Export Market Analysis (Value & Volume) 2020 & 2033
- Table 11: Asia Pacific Disposable Tableware Industry Revenue Million Forecast, by Price Trend Analysis 2020 & 2033
- Table 12: Asia Pacific Disposable Tableware Industry Revenue Million Forecast, by Country 2020 & 2033
- Table 13: China Asia Pacific Disposable Tableware Industry Revenue (Million) Forecast, by Application 2020 & 2033
- Table 14: Japan Asia Pacific Disposable Tableware Industry Revenue (Million) Forecast, by Application 2020 & 2033
- Table 15: South Korea Asia Pacific Disposable Tableware Industry Revenue (Million) Forecast, by Application 2020 & 2033
- Table 16: India Asia Pacific Disposable Tableware Industry Revenue (Million) Forecast, by Application 2020 & 2033
- Table 17: Australia Asia Pacific Disposable Tableware Industry Revenue (Million) Forecast, by Application 2020 & 2033
- Table 18: New Zealand Asia Pacific Disposable Tableware Industry Revenue (Million) Forecast, by Application 2020 & 2033
- Table 19: Indonesia Asia Pacific Disposable Tableware Industry Revenue (Million) Forecast, by Application 2020 & 2033
- Table 20: Malaysia Asia Pacific Disposable Tableware Industry Revenue (Million) Forecast, by Application 2020 & 2033
- Table 21: Singapore Asia Pacific Disposable Tableware Industry Revenue (Million) Forecast, by Application 2020 & 2033
- Table 22: Thailand Asia Pacific Disposable Tableware Industry Revenue (Million) Forecast, by Application 2020 & 2033
- Table 23: Vietnam Asia Pacific Disposable Tableware Industry Revenue (Million) Forecast, by Application 2020 & 2033
- Table 24: Philippines Asia Pacific Disposable Tableware Industry Revenue (Million) Forecast, by Application 2020 & 2033
Frequently Asked Questions
1. What is the projected Compound Annual Growth Rate (CAGR) of the Asia Pacific Disposable Tableware Industry?
The projected CAGR is approximately 5.12%.
2. Which companies are prominent players in the Asia Pacific Disposable Tableware Industry?
Key companies in the market include Nine Dragons Paper, Rengo co Ltd, Berry Plastics Corporation, Amcor, Toyo Seikan, Nippon Paper, Mondi Group, Guangdong Huasheng Meto, Oji Holdings, Sonoco Products**List Not Exhaustive, Taizhou Fuling Plastics.
3. What are the main segments of the Asia Pacific Disposable Tableware Industry?
The market segments include Production Analysis, Consumption Analysis, Import Market Analysis (Value & Volume), Export Market Analysis (Value & Volume), Price Trend Analysis.
4. Can you provide details about the market size?
The market size is estimated to be USD 14.64 Million as of 2022.
5. What are some drivers contributing to market growth?
Increasing Construction and Renovation Activities is Driving the Market.
6. What are the notable trends driving market growth?
Increase in the Usage of Disposable Items.
7. Are there any restraints impacting market growth?
Increasing Regulations and Tariffs is Restraining the Market.
8. Can you provide examples of recent developments in the market?
In February 2022, Nippon Paper Industries collaborated with Elopak Paper Industries to collectively put efforts in the field of Liquid- Paper Packaging and to expand the market size in Asia - Pacific region.
9. What pricing options are available for accessing the report?
Pricing options include single-user, multi-user, and enterprise licenses priced at USD 4750, USD 5250, and USD 8750 respectively.
10. Is the market size provided in terms of value or volume?
The market size is provided in terms of value, measured in Million.
11. Are there any specific market keywords associated with the report?
Yes, the market keyword associated with the report is "Asia Pacific Disposable Tableware Industry," which aids in identifying and referencing the specific market segment covered.
12. How do I determine which pricing option suits my needs best?
The pricing options vary based on user requirements and access needs. Individual users may opt for single-user licenses, while businesses requiring broader access may choose multi-user or enterprise licenses for cost-effective access to the report.
13. Are there any additional resources or data provided in the Asia Pacific Disposable Tableware Industry report?
While the report offers comprehensive insights, it's advisable to review the specific contents or supplementary materials provided to ascertain if additional resources or data are available.
14. How can I stay updated on further developments or reports in the Asia Pacific Disposable Tableware Industry?
To stay informed about further developments, trends, and reports in the Asia Pacific Disposable Tableware Industry, consider subscribing to industry newsletters, following relevant companies and organizations, or regularly checking reputable industry news sources and publications.
Methodology
Step 1 - Identification of Relevant Samples Size from Population Database


Step 2 - Approaches for Defining Global Market Size (Value, Volume* & Price*)

Note*: In applicable scenarios
Step 3 - Data Sources
Primary Research
- Web Analytics
- Survey Reports
- Research Institute
- Latest Research Reports
- Opinion Leaders
Secondary Research
- Annual Reports
- White Paper
- Latest Press Release
- Industry Association
- Paid Database
- Investor Presentations

Step 4 - Data Triangulation
Involves using different sources of information in order to increase the validity of a study
These sources are likely to be stakeholders in a program - participants, other researchers, program staff, other community members, and so on.
Then we put all data in single framework & apply various statistical tools to find out the dynamic on the market.
During the analysis stage, feedback from the stakeholder groups would be compared to determine areas of agreement as well as areas of divergence